Exhibit 99.2

Cheniere Energy, Inc. Capital Allocation Update September 12, 2022 NYSE American: LNG
Exhibit 99.2
Cheniere Energy, Inc. Capital Allocation Update September 12, 2022 NYSE American: LNG
Safe Harbor Statements Forward-Looking Statements This presentation contains certain statements that are, or may be deemed to be, “forward-looking statements” within the meaning of Section 27A of the Securities Act of 1933, as amended, and Section 21E of the Securities Exchange Act of 1934, as amended. All statements, other than statements of historical or present facts or conditions, included or incorporated by reference herein are “forward-looking statements.” Included among “forward-looking statements” are, among other things: • statements regarding the ability of Cheniere Energy Partners, L.P. to pay or increase distributions to its unitholders or Cheniere Energy, Inc. to pay or increase dividends to its shareholders or participate in share or unit buybacks; • statements regarding Cheniere Energy, Inc.’s or Cheniere Energy Partners, L.P.’s expected receipt of cash distributions from their respective subsidiaries; • statements that Cheniere Energy Partners, L.P. expects to commence or complete construction of its proposed liquefied natural gas (“LNG”) terminals, liquefaction facilities, pipeline facilities or other projects, or any expansions or portions thereof, by certain dates or at all; • statements that Cheniere Energy, Inc. expects to commence or complete construction of its proposed LNG terminals, liquefaction facilities, pipeline facilities or other projects, or any expansions or portions thereof, by certain dates or at all; • statements regarding future levels of domestic and international natural gas production, supply or consumption or future levels of LNG imports into or exports from North America and other countries worldwide, or purchases of natural gas, regardless of the source of such information, or the transportation or other infrastructure, or demand for and prices related to natural gas, LNG or other hydrocarbon products; • statements regarding any financing transactions or arrangements, or ability to enter into such transactions; • statements relating to Cheniere’s capital deployment, including intent, ability, extent, and timing of capital expenditures, debt repayment, dividends, and share repurchases; • Statements regarding our future sources of liquidity and cash requirements; • statements relating to the construction of our proposed liquefaction facilities and natural gas liquefaction trains (“Trains”) and the construction of our pipelines, including statements concerning the engagement of any engineering, procurement and construction (“EPC”) contractor or other contractor and the anticipated terms and provisions of any agreement with any EPC or other contractor, and anticipated costs related thereto; • statements regarding any agreement to be entered into or performed substantially in the future, including any revenues anticipated to be received and the anticipated timing thereof, and statements regarding the amounts of total LNG regasification, natural gas, liquefaction or storage capacities that are, or may become, subject to contracts; • statements regarding counterparties to our commercial contracts, construction contracts and other contracts; • statements regarding our planned development and construction of additional Trains or pipelines, including the financing of such Trains or pipelines; • statements that our Trains, when completed, will have certain characteristics, including amounts of liquefaction capacities; • statements regarding our business strategy, our strengths, our business and operation plans or any other plans, forecasts, projections or objectives, including anticipated revenues, capital expenditures, maintenance and operating costs, free cash flow, run rate SG&A estimates, cash flows, EBITDA, Consolidated Adjusted EBITDA, distributable cash flow, distributable cash flow per share and unit, deconsolidated debt outstanding, and deconsolidated contracted EBITDA, any or all of which are subject to change; • statements regarding projections of revenues, expenses, earnings or losses, working capital or other financial items; • statements regarding legislative, governmental, regulatory, administrative or other public body actions, approvals, requirements, permits, applications, filings, investigations, proceedings or decisions; • statements regarding our anticipated LNG and natural gas marketing activities; and • any other statements that relate to non-historical or future information. These forward-looking statements are often identified by the use of terms and phrases such as “achieve,” “anticipate,” “believe,” “contemplate,” “continue,” “could,” “develop,” “estimate,” “example,” “expect,” “forecast,” “goals,” “guidance,” “intend,” “may,” “opportunities,” “plan,” “potential,” “predict,” “project,” “propose,” “pursue,” “should,” “subject to,” “strategy,” “target,” “will,” and similar terms and phrases, or by use of future tense. Although we believe that the expectations reflected in these forward-looking statements are reasonable, they do involve assumptions, risks and uncertainties, and these expectations may prove to be incorrect. You should not place undue reliance on these forward-looking statements, which speak only as of the date of this presentation. Our actual results could differ materially from those anticipated in these forward-looking statements as a result of a variety of factors, including those discussed in “Risk Factors” in the Cheniere Energy, Inc. and Cheniere Energy Partners, L.P. Annual Reports on Form 10-K filed with the SEC on February 24, 2022, which are incorporated by reference into this presentation. All forward-looking statements attributable to us or persons acting on our behalf are expressly qualified in their entirety by these “Risk Factors.” These forward-looking statements are made as of the date of this presentation, and other than as required by law, we undertake no obligation to update or revise any forward-looking statement or provide reasons why actual results may differ, whether as a result of new information, future events or otherwise. Reconciliation to U.S. GAAP Financial Information The following presentation includes certain “non-GAAP financial measures” as defined in Regulation G under the Securities Exchange Act of 1934, as amended. Schedules are included in the appendix hereto that reconcile the non-GAAP financial measures included in the following presentation to the most directly comparable financial measures calculated and presented in accordance with U.S. GAAP.
Agenda Introduction Randy Bhatia Vice President, Investor Relations Cheniere Highlights Jack Fusco President and Chief Executive Officer Capital Allocation Update Zach Davis Executive Vice President and Chief Financial Officer Q & A

Cheniere Highlights Jack Fusco, President and CEO
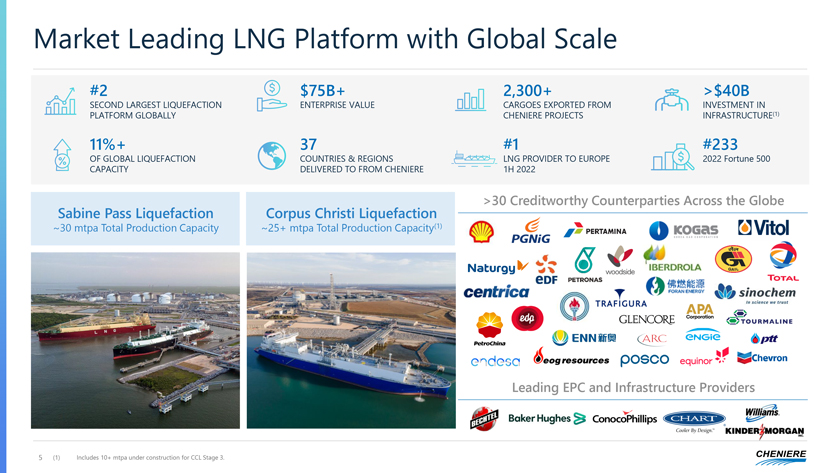
Market Leading LNG Platform with Global Scale #2 $75B+ 2,300+ >$40B SECOND LARGEST LIQUEFACTION ENTERPRISE VALUE CARGOES EXPORTED FROM INVESTMENT IN PLATFORM GLOBALLY CHENIERE PROJECTS INFRASTRUCTURE(1) 11%+ 37 #1 #233 OF GLOBAL LIQUEFACTION COUNTRIES & REGIONS LNG PROVIDER TO EUROPE 2022 Fortune 500 CAPACITY DELIVERED TO FROM CHENIERE 1H 2022 >30 Creditworthy Counterparties Across the Globe Sabine Pass Liquefaction Corpus Christi Liquefaction ~30 mtpa Total Production Capacity ~25+ mtpa Total Production Capacity(1) Leading EPC and Infrastructure Providers 5 (1) Includes 10+ mtpa under construction for CCL Stage 3.
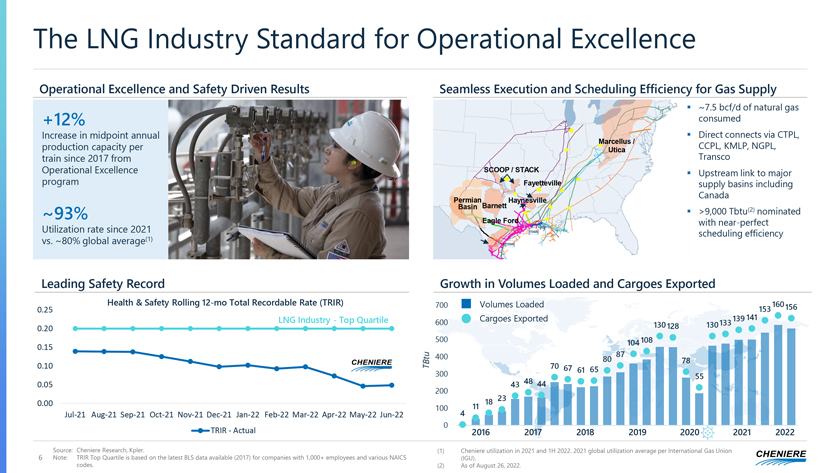
The LNG Industry Standard for Operational Excellence Operational Excellence and Safety Driven Results +12% Increase in midpoint annual production capacity per train since 2017 from Operational Excellence program ~93% Utilization rate since 2021 vs. ~80% global average(1) Leading Safety Record 0.25 Health & Safety Rolling 12-mo Total Recordable Rate (TRIR) LNG Industry—Top Quartile 0.20 0.15 0.10 0.05 0.00 Jul-21 Aug-21 Sep-21 Oct-21 Nov-21 Dec-21 Jan-22 Feb-22 Mar-22 Apr-22 May-22 Jun-22 TRIR—Actual : Cheniere Research, Kpler. 6 TRIR Top Quartile is based on the latest BLS data available (2017) for companies with 1,000+ employees and various NAICS codes. Seamless Execution and Scheduling Efficiency for Gas Supply ? ~7.5 bcf/d of natural gas consumed Marcellus / ? Direct connects via CTPL, CCPL, KMLP, NGPL, Utica Transco SCOOP / STACK ? Upstream link to major Fayetteville supply basins including Canada PermianBarnett Haynesville Basin (2) ? >9,000 Tbtu nominated Eagle Ford with near-perfect scheduling efficiency Growth in Volumes Loaded and Cargoes Exported 700 Volumes Loaded 160 156 141 153 600 Cargoes Exported 133 139 130 128 130 500 104 108 400 87 80 78 TBtu 70 67 61 65 300 55 43 48 44 200 11 18 23 100 4 0 2016 2017 2018 2019 2020 2021 2022 (1) Cheniere utilization in 2021 and 1H 2022. 2021 global utilization average per International Gas Union (IGU). (2) As of August 26, 2022.
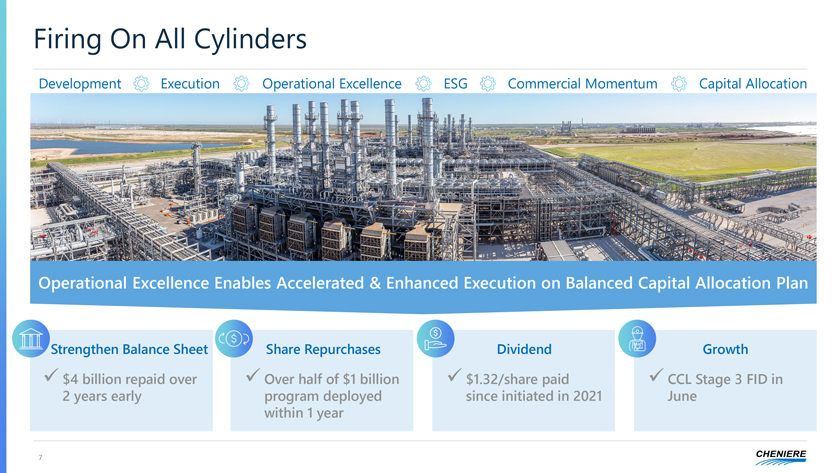
Firing On All Cylinders Development Execution Operational Excellence ESG Commercial Momentum Capital Allocation Operational Excellence Enables Accelerated & Enhanced Execution on Balanced Capital Allocation Plan Strengthen Balance Sheet Share Repurchases Dividend Growth ?$4 billion repaid over ?Over half of $1 billion ?$1.32/share paid ?CCL Stage 3 FID in 2 years early program deployed since initiated in 2021 June within 1 year
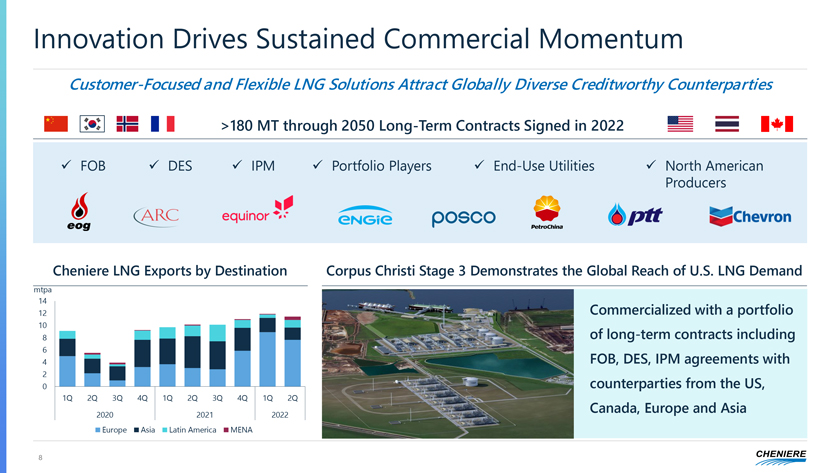
Innovation Drives Sustained Commercial Momentum Customer-Focused and Flexible LNG Solutions Attract Globally Diverse Creditworthy Counterparties >180 MT through 2050 Long-Term Contracts Signed in 2022 ? FOB ? DES ? IPM ? Portfolio Players ? End-Use Utilities ? North American Producers Cheniere LNG Exports by Destination Corpus Christi Stage 3 Demonstrates the Global Reach of U.S. LNG Demand mtpa 14 12 Commercialized with a portfolio 10 8 of long-term contracts including 6 4 FOB, DES, IPM agreements with 2 0 counterparties from the US, 1Q 2Q 3Q 4Q 1Q 2Q 3Q 4Q 1Q 2Q Canada, Europe and Asia 2020 2021 2022 Europe Asia Latin America MENA 8
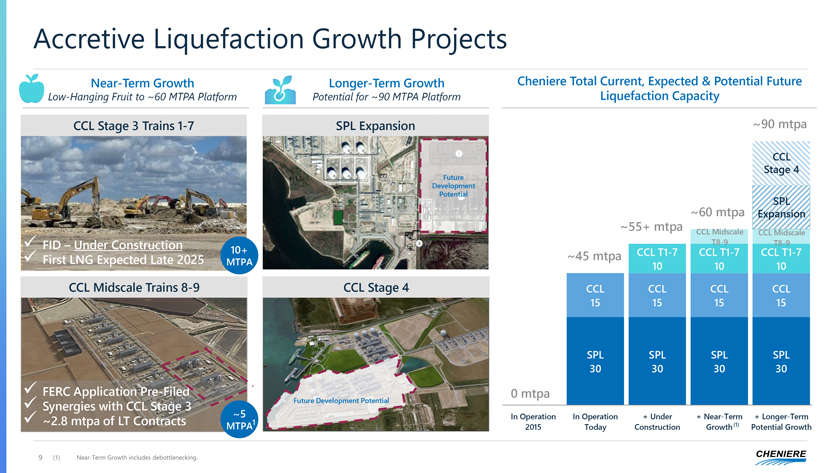
Accretive Liquefaction Growth Projects Near-Term Growth Longer-Term Growth Cheniere Total Current, Expected & Potential Future Low-Hanging Fruit to ~60 MTPA Platform Potential for ~90 MTPA Platform Liquefaction Capacity CCL Stage 3 Trains 1-7 SPL Expansion ~90 mtpa CCL Stage 4 Future Development Potential SPL ~60 mtpa Expansion ~55+ mtpa CCL Midscale CCL Midscale ? FID – Under Construction T8-9 T8-9 10+ ~45 mtpa CCL T1-7 CCL T1-7 CCL T1-7 ? First LNG Expected Late 2025 MTPA 10 10 10 CCL Midscale Trains 8-9 CCL Stage 4 CCL CCL CCL CCL 15 15 15 15 SPL SPL SPL SPL 30 30 30 30 ? FERC Application Pre-Filed 0 mtpa Future Development Potential CCL CCL SPL T1-7 ? Synergies with CCL Stage 3 ~5 In Operation 0 In Operation + Under + Near-Term + Longer-Term ? ~2.8 mtpa of LT Contracts MTPA1 (1) 2015 Today Construction Growth Potential Growth 60 9 (1) Near-Term Growth includes debottlenecking.
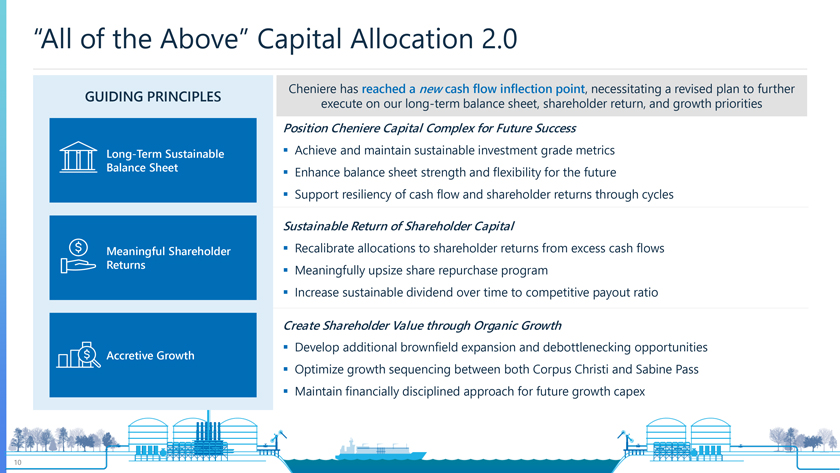
“All of the Above” Capital Allocation 2.0 GUIDING PRINCIPLES Cheniere has reached a new cash flow inflection point, necessitating a revised plan to further execute on our long-term balance sheet, shareholder return, and growth priorities Position Cheniere Capital Complex for Future Success Long-Term Sustainable ? Achieve and maintain sustainable investment grade metrics Balance Sheet ? Enhance balance sheet strength and flexibility for the future ? Support resiliency of cash flow and shareholder returns through cycles Sustainable Return of Shareholder Capital Meaningful Shareholder ? Recalibrate allocations to shareholder returns from excess cash flows Returns upsize share repurchase program ? Meaningfully ? Increase sustainable dividend over time to competitive payout ratio Create Shareholder Value through Organic Growth ? Develop additional brownfield expansion and debottlenecking opportunities Accretive Growth ? Optimize growth sequencing between both Corpus Christi and Sabine Pass ? Maintain financially disciplined approach for future growth capex
Capital Allocation Update Zach Davis, EVP and CFO
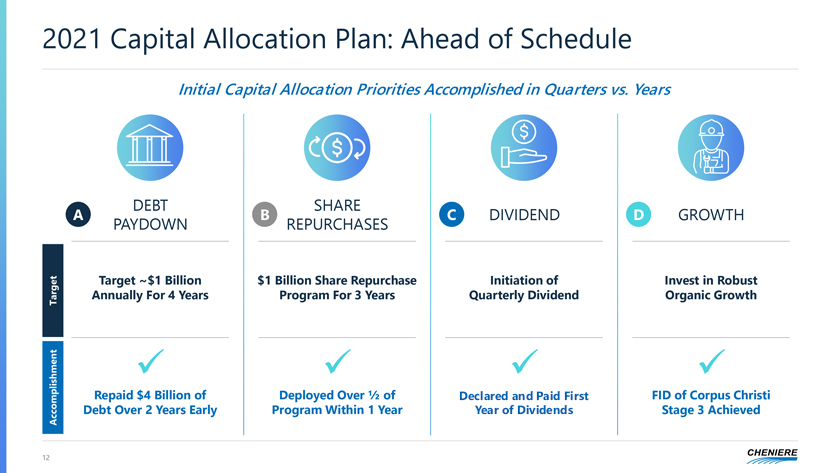
2021 Capital Allocation Plan: Ahead of Schedule Initial Capital Allocation Priorities Accomplished in Quarters vs. Years DEBT SHARE A B C DIVIDEND D GROWTH PAYDOWN REPURCHASES Target ~$1 Billion $1 Billion Share Repurchase Initiation of Invest in Robust Target Annually For 4 Years Program For 3 Years Quarterly Dividend Organic Growth ? ? ? ? Repaid $4 Billion of Deployed Over 1⁄2 of Initiated First Year FID of Corpus Christi Accomplishment Debt Over 2 Years Early Program Within 1 Year of Dividends Stage 3 Achieved
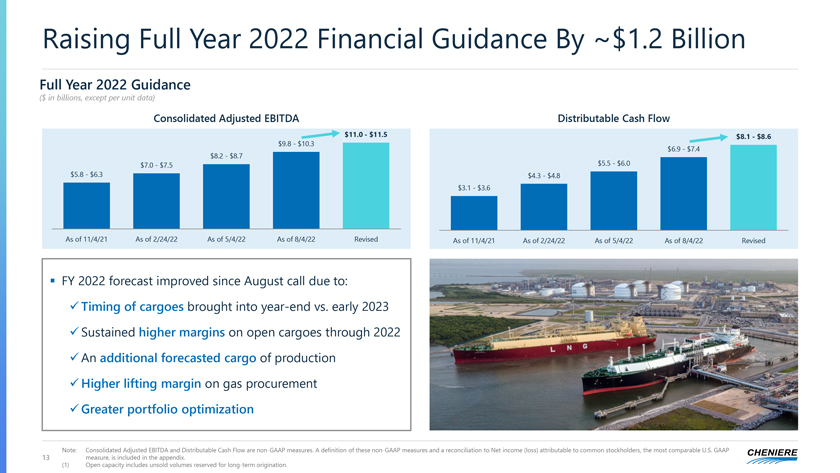
Raising Full Year 2022 Financial Guidance By ~$1.2 Billion Full Year 2022 Guidance ($ in billions, except per unit data) Consolidated Adjusted EBITDA Distributable Cash Flow $11.0—$11.5 $8.1—$8.6 $9.8—$10.3 $6.9—$7.4 $8.2—$8.7 $5.5—$6.0 $7.0—$7.5 $5.8—$6.3 $4.3—$4.8 $3.1—$3.6 As of 11/4/21 As of 2/24/22 As of 5/4/22 As of 8/4/22 Revised As of 11/4/21 As of 2/24/22 As of 5/4/22 As of 8/4/22 Revised ? FY 2022 forecast improved since August call due to: ?Timing of cargoes brought into year-end vs. early 2023 ?Sustained higher margins on open cargoes through 2022 ?An additional forecasted cargo of production ?Higher lifting margin on gas procurement ?Greater portfolio optimization Note: Consolidated Adjusted EBITDA and Distributable Cash Flow are non-GAAP measures. A definition of these non-GAAP measures and a reconciliation to Net income (loss) attributable to common stockholders, the most comparable U.S. GAAP 13 measure, is included in the appendix. (1) Open capacity includes unsold volumes reserved for long-term origination.
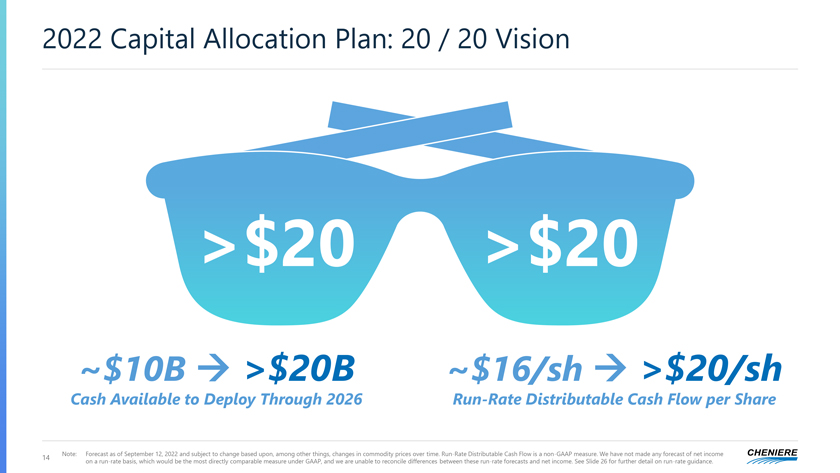
2022 Capital Allocation Plan: 20 / 20 Vision >$20 >$20 ~$10B ? >$20B ~$16/sh ? >$20/sh Cash Available to Deploy Through 2026 Run-Rate Distributable Cash Flow per Share 14 Note: Forecast as of September 12, 2022 and subject to change based upon, among other things, changes in commodity prices over time. Run-Rate Distributable Cash Flow is a non-GAAP measure. We have not made any forecast of net income on a run-rate basis, which would be the most directly comparable measure under GAAP, and we are unable to reconcile differences between these run-rate forecasts and net income. See Slide 26 for further detail on run-rate guidance.
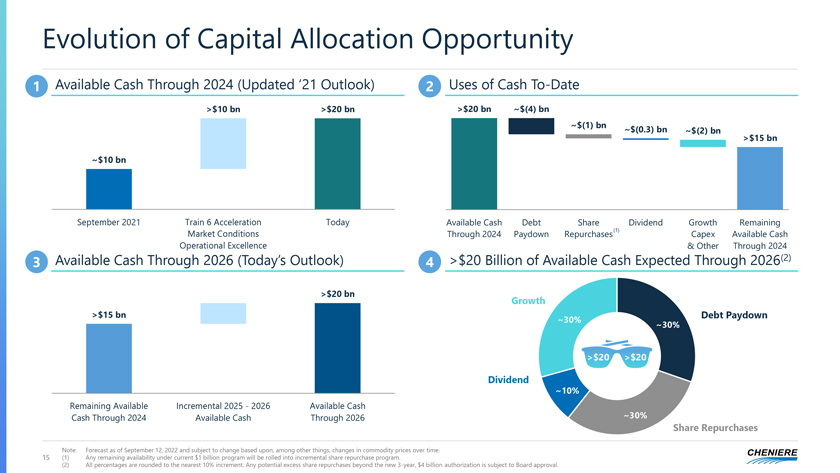
Evolution of Capital Allocation Opportunity 1 Available Cash Through 2024 (Updated ‘21 Outlook) 2 Uses of Cash To-Date >$10 bn >$20 bn >$20 bn ~$(4) bn ~$(1) bn ~$(0.3) bn ~$(2) bn >$15 bn ~$10 bn September 2021 Train 6 Acceleration Today Available Cash Debt Share Dividend Growth Remaining Market Conditions Through 2024 Paydown Repurchases(1) Capex Available Cash Operational Excellence & Other Through 2024 3 Available Cash Through 2026 (Today’s Outlook) 4 >$20 Billion of Available Cash Expected Through 2026(2) >$20 bn Growth >$15 bn Debt Paydown ~30% ~30% >$20 >$20 Dividend ~10% Remaining Available Incremental 2025—2026 Available Cash ~30% Cash Through 2024 Available Cash Through 2026 Share Repurchases Note: Forecast as of September 12, 2022 and subject to change based upon, among other things, changes in commodity prices over time. 15 (1) Any remaining availability under current $1 billion program will be rolled into incremental share repurchase program. (2) All percentages are rounded to the nearest 10% increment. Any potential excess share repurchases beyond the new 3-year, $4 billion authorization is subject to Board approval.
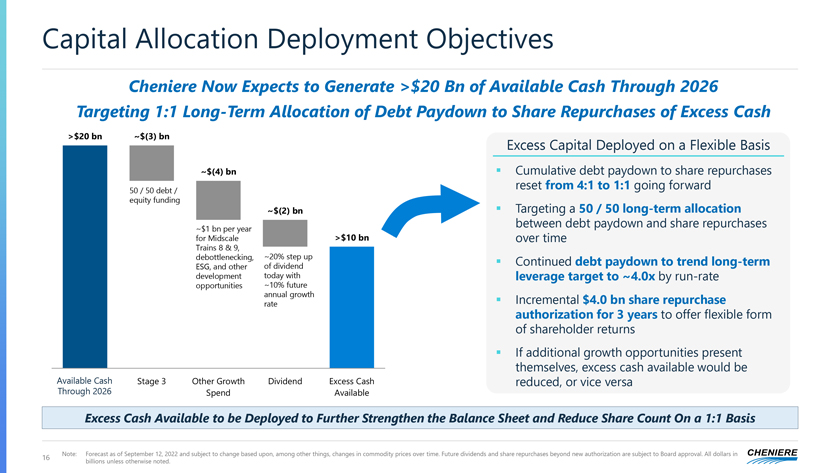
Capital Allocation Deployment Objectives Cheniere Now Expects to Generate >$20 Bn of Available Cash Through 2026 Targeting 1:1 Long-Term Allocation of Debt Paydown to Share Repurchases of Excess Cash >$20 bn ~$(3) bn Excess Capital Deployed on a Flexible Basis ~$(4) bn ? Cumulative debt paydown to share repurchases 50 / 50 debt / reset from 4:1 to 1:1 going forward equity funding ~$(2) bn ? Targeting a 50 / 50 long-term allocation ~$1 bn per year between debt paydown and share repurchases for Midscale >$10 bn over time Trains 8 & 9, ~20% step up debottlenecking, of dividend ? Continued debt paydown to trend long-term ESG, and other today with development ~10% future leverage target to ~4.0x by run-rate opportunities annual growth rate ? Incremental $4.0 bn share repurchase authorization for 3 years to offer flexible form of shareholder returns ? If additional growth opportunities present themselves, excess cash available would be Available Cash Stage 3 Other Growth Dividend Excess Cash reduced, or vice versa Through 2026 Spend Available Excess Cash Available to be Deployed to Further Strengthen the Balance Sheet and Reduce Share Count On a 1:1 Basis 16 Note: Forecast as of September 12, 2022 and subject to change based upon, among other things, changes in commodity prices over time. Future dividends and share repurchases beyond new authorization are subject to Board approval. All dollars in billions unless otherwise noted.
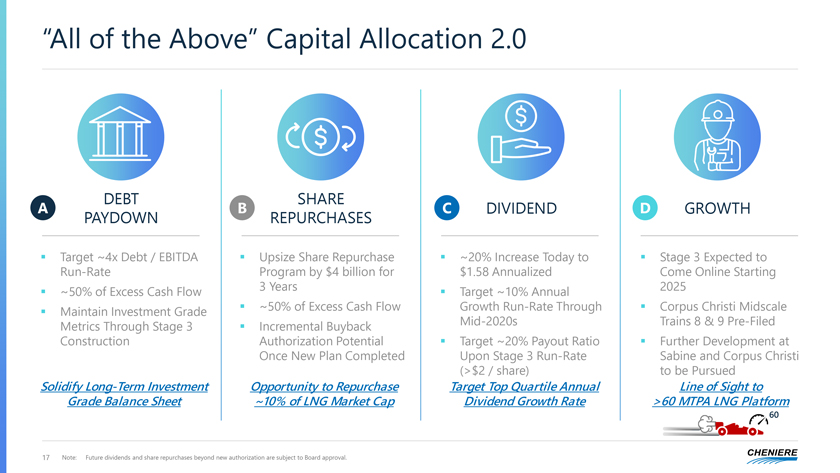
“All of the Above” Capital Allocation 2.0 DEBT SHARE A B C DIVIDEND D GROWTH PAYDOWN REPURCHASES ? Target ~4x Debt / EBITDA ? Upsize Share Repurchase ? ~20% Increase Today to ? Stage 3 Expected to Run-Rate Program by $4 billion for $1.58 Annualized Come Online Starting ? ~50% of Excess Cash Flow 3 Years ? Target ~10% Annual 2025 ? Maintain Investment Grade ? ~50% of Excess Cash Flow Growth Run-Rate Through ? Corpus Christi Midscale Metrics Through Stage 3 ? Incremental Buyback Mid-2020s Trains 8 & 9 Pre-Filed Construction Authorization Potential ? Target ~20% Payout Ratio ? Further Development at Once New Plan Completed Upon Stage 3 Run-Rate Sabine and Corpus Christi (>$2 / share) to be Pursued Solidify Long-Term Investment Opportunity to Repurchase Target Top Quartile Annual Line of Sight to Grade Balance Sheet ~10% of LNG Market Cap Dividend Growth Rate >60 MTPA LNG Platform 60 17 Note: Future dividends and share repurchases beyond new authorization are subject to Board approval.
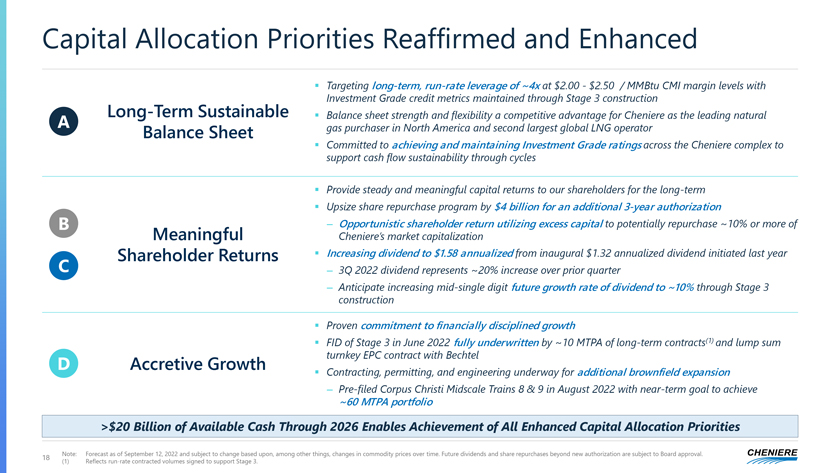
Capital Allocation Priorities Reaffirmed and Enhanced ? Targeting long-term, run-rate leverage of ~4x at $2.00—$2.50 / MMBtu CMI margin levels with Investment Grade credit metrics maintained through Stage 3 construction Long-Term Sustainable ? Balance sheet strength and flexibility a competitive advantage for Cheniere as the leading natural A gas purchaser in North America and second largest global LNG operator Balance Sheet ? Committed to achieving and maintaining Investment Grade ratings across the Cheniere complex to support cash flow sustainability through cycles ? Provide steady and meaningful capital returns to our shareholders for the long-term ? Upsize share repurchase program by $4 billion for an additional 3-year authorization B – Opportunistic shareholder return utilizing excess capital to potentially repurchase ~10% or more of Meaningful Cheniere’s market capitalization Shareholder Returns ? Increasing dividend to $1.58 annualized from inaugural $1.32 annualized dividend initiated last year C – 3Q 2022 dividend represents ~20% increase over prior quarter – Anticipate increasing mid-single digit future growth rate of dividend to ~10% through Stage 3 construction ? Proven commitment to financially disciplined growth ? FID of Stage 3 in June 2022 fully underwritten by ~10 MTPA of long-term contracts(1) and lump sum D Accretive Growth turnkey EPC contract with Bechtel ? Contracting, permitting, and engineering underway for additional brownfield expansion – Pre-filed Corpus Christi Midscale Trains 8 & 9 in August 2022 with near-term goal to achieve ~60 MTPA portfolio >$20 Billion of Available Cash Through 2026 Enables Achievement of All Enhanced Capital Allocation Priorities 18 Note: Forecast as of September 12, 2022 and subject to change based upon, among other things, changes in commodity prices over time. Future dividends and share repurchases beyond new authorization are subject to Board approval. (1) Reflects run-rate contracted volumes signed to support Stage 3.
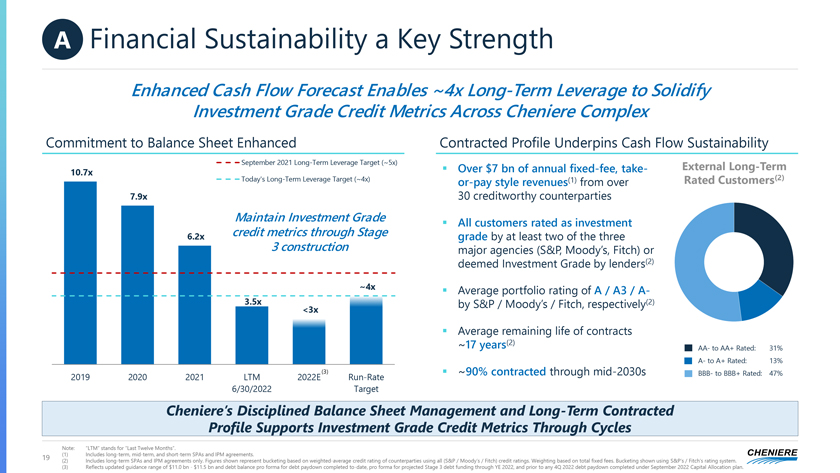
A Financial Sustainability a Key Strength Enhanced Cash Flow Forecast Enables ~4x Long-Term Leverage to Solidify Investment Grade Credit Metrics Across Cheniere Complex Commitment 1 2 to Balance 3 Sheet Enhanced 4 5 6 Contracted Profile Underpins Cash Flow Sustainability September 2021 Long-Term Leverage Target (~5x) External Long-Term 10.7x ? Over $7 bn of annual fixed-fee, take- (2) Today’s Long-Term Leverage Target (~4x) or-pay style revenues(1) from over Rated Customers 7.9x 30 creditworthy counterparties Maintain Investment Grade ? All customers rated as investment 6.2x credit metrics through Stage grade by at least two of the three 3 construction major agencies (S&P, Moody’s, Fitch) or deemed Investment Grade by lenders(2) ~4x ? Average portfolio rating of A / A3 / A- 3.5x by S&P / Moody’s / Fitch, respectively(2) <3x ? Average remaining life of contracts ~17 years(2) AA- to AA+ Rated: 31% A- to A+ Rated: 13% (3) ? ~90% contracted through mid-2030s BBB- to BBB+ Rated: 47% 2019 2020 2021 LTM 2022E Run-Rate 6/30/2022 Target Cheniere’s Disciplined Balance Sheet Management and Long-Term Contracted Profile Supports Investment Grade Credit Metrics Through Cycles Note: “LTM” stands for “Last Twelve Months”. 19 (1) Includes long-term, mid-term, and short-term SPAs and IPM agreements. (2) Includes long-term SPAs and IPM agreements only. Figures shown represent bucketing based on weighted-average credit rating of counterparties using all (S&P / Moody’s / Fitch) credit ratings. Weighting based on total fixed fees. Bucketing shown using S&P’s / Fitch’s rating system. (3) Reflects updated guidance range of $11.0 bn—$11.5 bn and debt balance pro forma for debt paydown completed to-date, pro forma for projected Stage 3 debt funding through YE 2022, and prior to any 4Q 2022 debt paydown completed under September 2022 Capital Allocation plan.
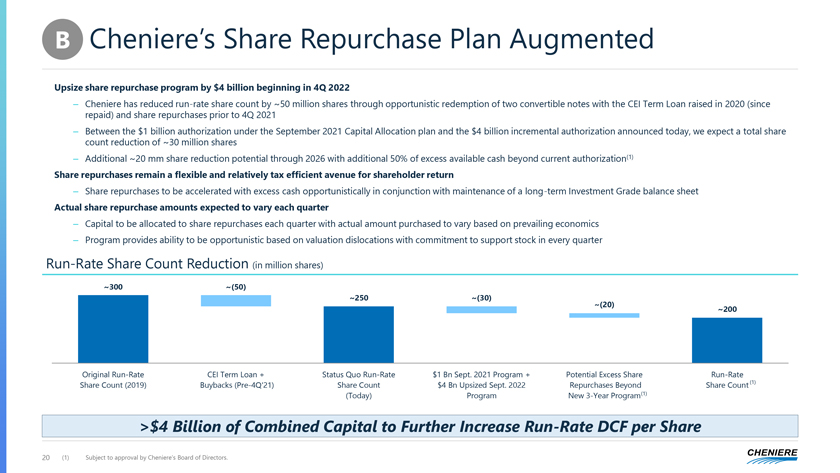
B Cheniere’s Share Repurchase Plan Augmented Upsize share repurchase program by $4 billion beginning in 4Q 2022 – Cheniere has reduced run-rate share count by ~50 million shares through opportunistic redemption of two convertible notes with the CEI Term Loan raised in 2020 (since repaid) and share repurchases prior to 4Q 2021 – Between the $1 billion authorization under the September 2021 Capital Allocation plan and the $4 billion incremental authorization announced today, we expect a total share count reduction of ~30 million shares – Additional ~20 mm share reduction potential through 2026 with additional 50% of excess available cash beyond current authorization(1) Share repurchases remain a flexible and relatively tax efficient avenue for shareholder return – Share repurchases to be accelerated with excess cash opportunistically in conjunction with maintenance of a long-term Investment Grade balance sheet Actual share repurchase amounts expected to vary each quarter – Capital to be allocated to share repurchases each quarter with actual amount purchased to vary based on prevailing economics – Program provides ability to be opportunistic based on valuation dislocations with commitment to support stock in every quarter Run-Rate Share Count Reduction (in million shares) ~300 ~(50) ~250 ~(30) ~(20) ~200 Original Run-Rate CEI Term Loan + Status Quo Run-Rate $1 Bn Sept. 2021 Program + Potential Excess Share Run-Rate Share Count (2019) Buybacks (Pre-4Q’21) Share Count $4 Bn Upsized Sept. 2022 Repurchases Beyond Share Count (1) (Today) Program New 3-Year Program(1) >$4 Billion of Combined Capital to Further Increase Run-Rate DCF per (1) Share 20 (1) Subject to approval by Cheniere’s Board of Directors.
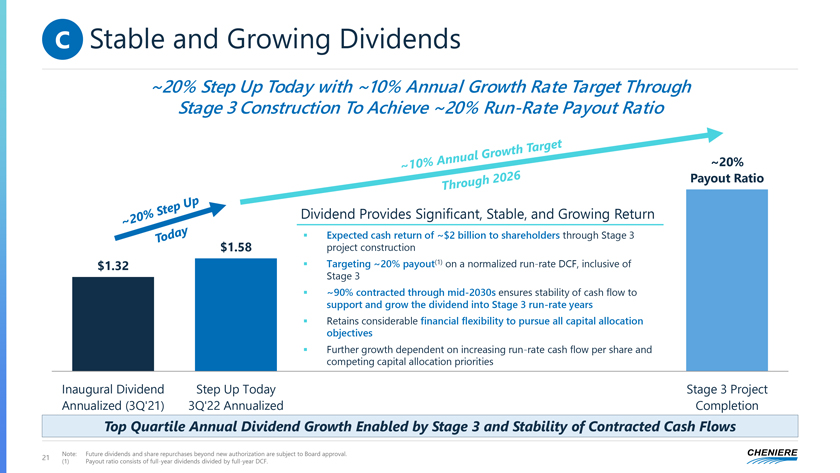
C Stable and Growing Dividends ~20% Step Up Today with ~10% Annual Growth Rate Target Through Stage 3 Construction To Achieve ~20% Run-Rate Payout Ratio ~20% Payout Ratio Dividend Provides Significant, Stable, and Growing Return ? Expected cash return of ~$2 billion to shareholders through Stage 3 $1.58 project construction $1.32 ? Targeting ~20% payout(1) on a normalized run-rate DCF, inclusive of Stage 3 ? ~90% contracted through mid-2030s ensures stability of cash flow to support and grow the dividend into Stage 3 run-rate years ? Retains considerable financial flexibility to pursue all capital allocation objectives ? Further growth dependent on increasing run-rate cash flow per share and competing capital allocation priorities Inaugural Dividend Step Up Today Stage 3 Project Annualized (3Q’21) 3Q’22 Annualized Completion Top Quartile Annual Dividend Growth Enabled by Stage 3 and Stability of Contracted Cash Flows 21 Note: Future dividends and share repurchases beyond new authorization are subject to Board approval. (1) Payout ratio consists of full-year dividends divided by full-year DCF.
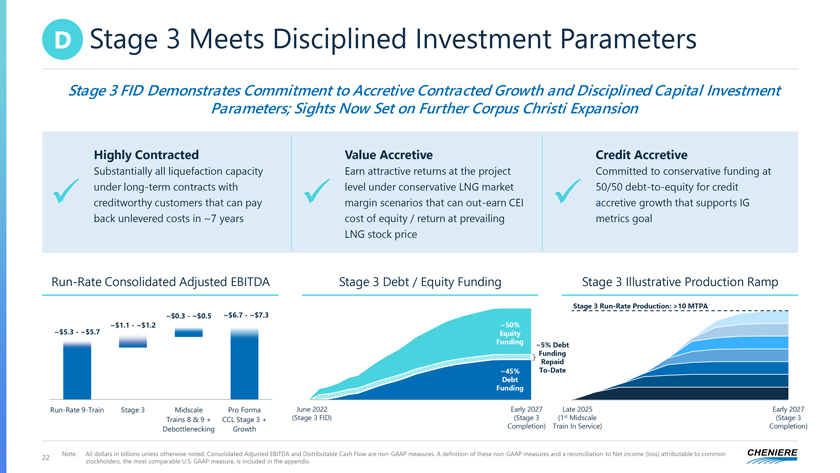
D Stage 3 Meets Disciplined Investment Parameters Stage 3 FID Demonstrates Commitment to Accretive Contracted Growth and Disciplined Capital Investment Parameters; Sights Now Set on Further Corpus Christi Expansion Highly Contracted Value Accretive Credit Accretive Substantially all liquefaction capacity Earn attractive returns at the project Committed to conservative funding at under long-term contracts with level under conservative LNG market 50/50 debt-to-equity for credit ? creditworthy customers that can pay ? margin scenarios that can out-earn CEI ? accretive growth that supports IG back unlevered costs in ~7 years cost of equity / return at prevailing metrics goal LNG stock price Run-Rate Consolidated Adjusted EBITDA Stage 3 Debt / Equity Funding Stage 3 Illustrative Production Ramp Stage 3 Run-Rate Production: >10 MTPA ~$0.3—~$0.5 ~$6.7—~$7.3 ~$1.1—~$1.2 ~50% ~$5.3—~$5.7 Equity Funding ~5% Debt Funding Repaid ~45% To-Date Debt Funding Run-Rate 9-Train Stage 3 Midscale Pro Forma June 2022 Early 2027 Late 2025 Early 2027 Trains 8 & 9 + CCL Stage 3 + (Stage 3 FID) (Stage 3 (1st Midscale (Stage 3 Debottlenecking Growth Completion) Train In Service) Completion) 22 Note: All dollars in billions unless otherwise noted. Consolidated Adjusted EBITDA and Distributable Cash Flow are non-GAAP measures. A definition of these non-GAAP measures and a reconciliation to Net income (loss) attributable to common stockholders, the most comparable U.S. GAAP measure, is included in the appendix.
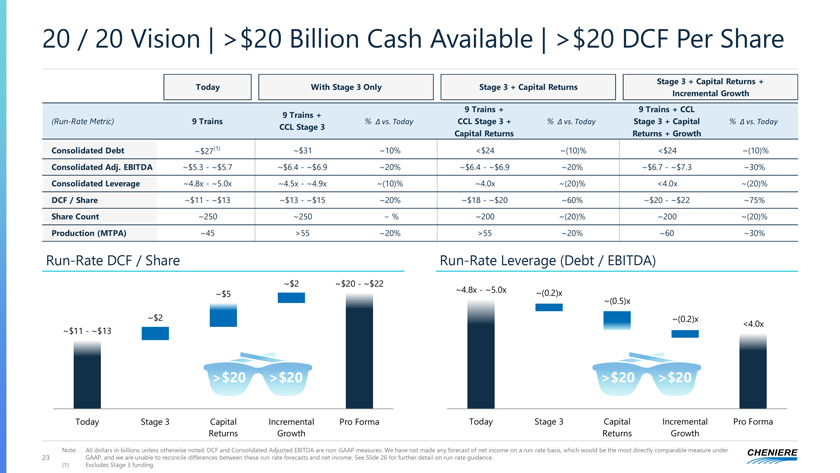
20 / 20 Vision | >$20 Billion Cash Available | >$20 DCF Per Share Stage 3 + Capital Returns + Today With Stage 3 Only Stage 3 + Capital Returns Incremental Growth 9 Trains + 9 Trains + CCL 9 Trains + (Run-Rate Metric) 9 Trains % ? vs. Today CCL Stage 3 + % ? vs. Today Stage 3 + Capital % ? vs. Today CCL Stage 3 Capital Returns Returns + Growth Consolidated Debt ~$27(1) ~$31 ~10% <$24 ~(10)% <$24 ~(10)% Consolidated Adj. EBITDA ~$5.3—~$5.7 ~$6.4—~$6.9 ~20% ~$6.4—~$6.9 ~20% ~$6.7—~$7.3 ~30% Consolidated Leverage ~4.8x—~5.0x ~4.5x—~4.9x ~(10)% ~4.0x ~(20)% <4.0x ~(20)% DCF / Share ~$11—~$13 ~$13—~$15 ~20% ~$18—~$20 ~60% ~$20—~$22 ~75% Share Count ~250 ~250—% ~200 ~(20)% ~200 ~(20)% Production (MTPA) ~45 >55 ~20% >55 ~20% ~60 ~30% Run-Rate DCF / Share Run-Rate Leverage (Debt / EBITDA) ~$2 ~$20—~$22 ~$5 ~4.8x—~5.0x ~(0.2)x ~(0.5)x ~$2 ~(0.2)x <4.0x ~$11—~$13 >$20 >$20 >$20 >$20 Today Stage 3 Capital Incremental Pro Forma Today Stage 3 Capital Incremental Pro Forma Returns Growth Returns Growth Note: All dollars in billions unless otherwise noted. DCF and Consolidated Adjusted EBITDA are non-GAAP measures. We have not made any forecast of net income on a run-rate basis, which would be the most directly comparable measure under 23 GAAP, and we are unable to reconcile differences between these run-rate forecasts and net income. See Slide 26 for further detail on run-rate guidance. (1) Excludes Stage 3 funding.
Cheniere Energy, Inc. Capital Allocation Update September 12, 2022 NYSE American: LNG
Appendix
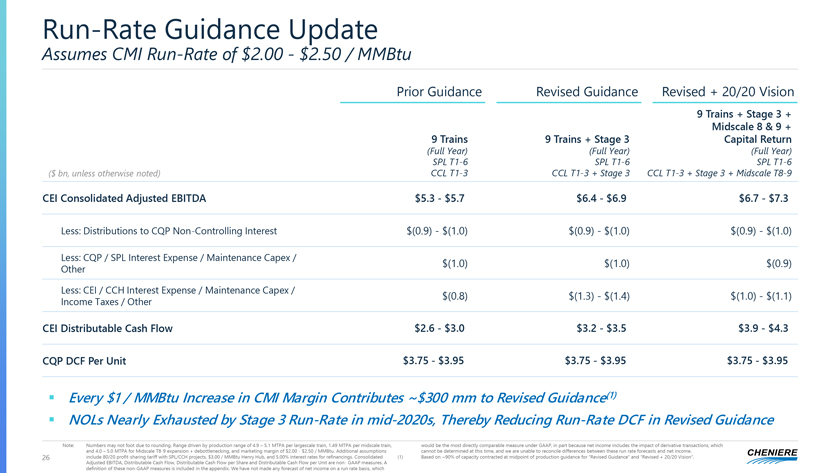
Run-Rate Guidance Update Assumes CMI Run-Rate of $2.00—$2.50 / MMBtu Prior Guidance Revised Guidance Revised + 20/20 Vision 9 Trains + Stage 3 + Midscale 8 & 9 + 9 Trains 9 Trains + Stage 3 Capital Return (Full Year) (Full Year) (Full Year) SPL T1-6 SPL T1-6 SPL T1-6 ($ bn, unless otherwise noted) CCL T1-3 CCL T1-3 + Stage 3 CCL T1-3 + Stage 3 + Midscale T8-9 CEI Consolidated Adjusted EBITDA $5.3—$5.7) $6.4—$6.9) $6.7—$7.3) Less: Distributions to CQP Non-Controlling Interest $(0.9)—$(1.0) $(0.9)—$(1.0) $(0.9)—$(1.0) Less: CQP / SPL Interest Expense / Maintenance Capex / $(1.0) $(1.0) $(0.9) Other Less: CEI / CCH Interest Expense / Maintenance Capex / $(0.8) $(1.3)—$(1.4) $(1.0)—$(1.1) Income Taxes / Other CEI Distributable Cash Flow $2.6—$3.0) $3.2—$3.5) $3.9—$4.3) CQP DCF Per Unit $3.75—$3.95) $3.75—$3.95) $3.75—$3.95) ? Every $1 / MMBtu Increase in CMI Margin Contributes ~$300 mm to Revised Guidance(1) ? NOLs Nearly Exhausted by Stage 3 Run-Rate in mid-2020s, Thereby Reducing Run-Rate DCF in Revised Guidance Note: Numbers may not foot due to rounding. Range driven by production range of 4.9 – 5.1 MTPA per largescale train, 1.49 MTPA per midscale train, would be the most directly comparable measure under GAAP, in part because net income includes the impact of derivative transactions, which and 4.0 – 5.0 MTPA for Midscale T8-9 expansion + debottlenecking, and marketing margin of $2.00—$2.50 / MMBtu. Additional assumptions cannot be determined at this time, and we are unable to reconcile differences between these run rate forecasts and net income. 26 include 80/20 profit-sharing tariff with SPL/CCH projects, $3.00 / MMBtu Henry Hub, and 5.00% interest rates for refinancings. Consolidated (1) Based on ~90% of capacity contracted at midpoint of production guidance for “Revised Guidance” and “Revised + 20/20 Vision”. Adjusted EBITDA, Distributable Cash Flow, Distributable Cash Flow per Share and Distributable Cash Flow per Unit are non- GAAP measures. A definition of these non-GAAP measures is included in the appendix. We have not made any forecast of net income on a run rate basis, which
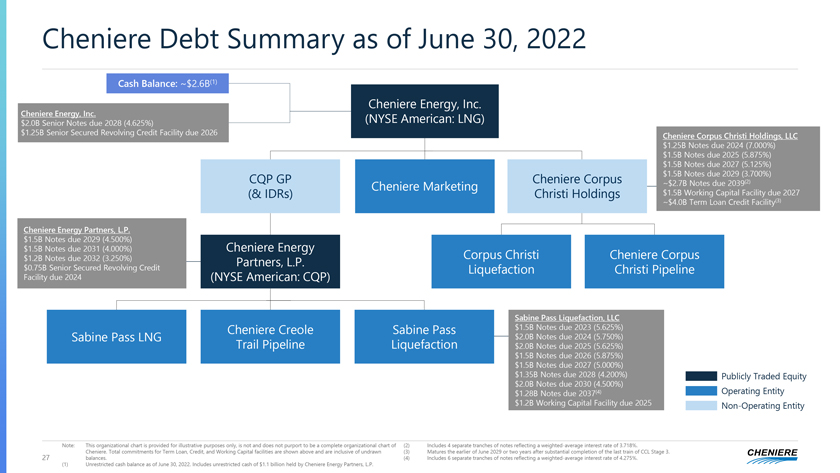
Cheniere Debt Summary as of June 30, 2022 Cash Balance: ~$2.6B(1) Cheniere Energy, Inc. Cheniere Energy, Inc. $2.0B Senior Notes due 2028 (4.625%) (NYSE American: LNG) $1.25B Senior Secured Revolving Credit Facility due 2026 Cheniere Corpus Christi Holdings, LLC $1.25B Notes due 2024 (7.000%) $1.5B Notes due 2025 (5.875%) $1.5B Notes due 2027 (5.125%) CQP GP Cheniere Corpus $1.5B Notes due 2029 (3.700%) Cheniere Marketing ~$2.7B Notes due 2039(2) (& IDRs) Christi Holdings $1.5B Working Capital Facility due 2027 ~$4.0B Term Loan Credit Facility(3) Cheniere Energy Partners, L.P. $1.5B Notes due 2029 (4.500%) $1.5B Notes due 2031 (4.000%) Cheniere Energy $1.2B Notes due 2032 (3.250%) Corpus Christi Cheniere Corpus Partners, L.P. $0.75B Senior Secured Revolving Credit Liquefaction Christi Pipeline Facility due 2024 (NYSE American: CQP) Sabine Pass Liquefaction, LLC Cheniere Creole Sabine Pass $1.5B Notes due 2023 (5.625%) Sabine Pass LNG $2.0B Notes due 2024 (5.750%) Trail Pipeline Liquefaction $2.0B Notes due 2025 (5.625%) $1.5B Notes due 2026 (5.875%) $1.5B Notes due 2027 (5.000%) $1.35B Notes due 2028 (4.200%) Publicly Traded Equity $2.0B Notes due 2030 (4.500%) $1.28B Notes due 2037(4) Operating Entity $1.2B Working Capital Facility due 2025 Non-Operating Entity Note: This organizational chart is provided for illustrative purposes only, is not and does not purport to be a complete organizational chart of (2) Includes 4 separate tranches of notes reflecting a weighted-average interest rate of 3.718%. Cheniere. Total commitments for Term Loan, Credit, and Working Capital facilities are shown above and are inclusive of undrawn (3) Matures the earlier of June 2029 or two years after substantial completion of the last train of CCL Stage 3. 27 balances. (4) Includes 6 separate tranches of notes reflecting a weighted-average interest rate of 4.275%. (1) Unrestricted cash balance as of June 30, 2022. Includes unrestricted cash of $1.1 billion held by Cheniere Energy Partners, L.P.
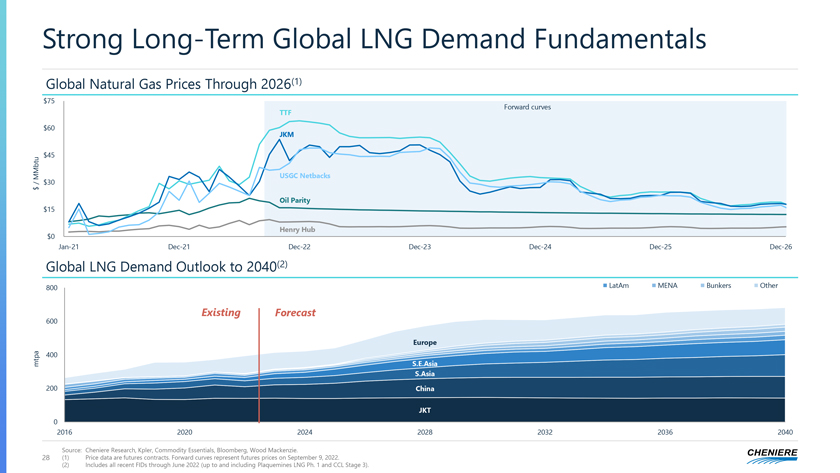
Strong Long-Term Global LNG Demand Fundamentals Global Natural Gas Prices Through 2026(1) $75 Forward curves TTF $60 JKM $45 MMbtu USGC Netbacks / $30 $ Oil Parity $15 Henry Hub $0 Jan-21 Dec-21 Dec-22 Dec-23 Dec-24 Dec-25 Dec-26 Global LNG Demand Outlook to 2040(2) 800 LatAm MENA Bunkers Other 600 Existing Forecast Europe 400 mtpa S.E.Asia S.Asia 200 China JKT 0 2016 2020 2024 2028 2032 2036 2040 Source: Cheniere Research, Kpler, Commodity Essentials, Bloomberg, Wood Mackenzie. 28 (1) Price data are futures contracts. Forward curves represent futures prices on September 9, 2022. (2) Includes all recent FIDs through June 2022 (up to and including Plaquemines LNG Ph. 1 and CCL Stage 3).
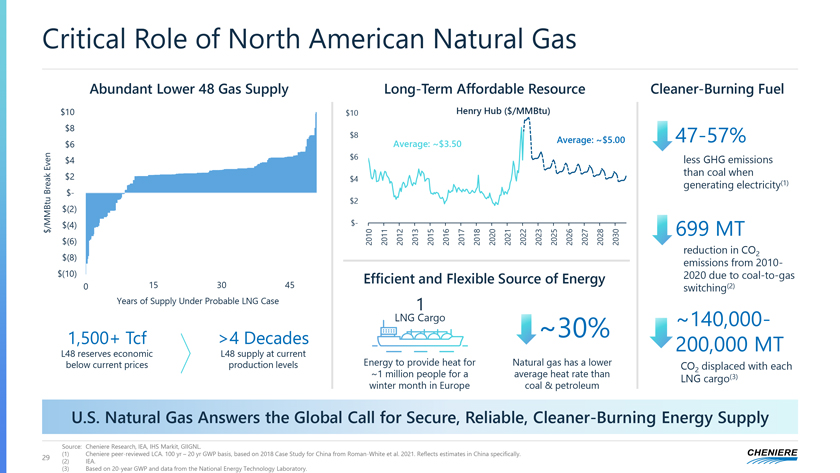
Critical Role of North American Natural Gas Abundant Lower 48 Gas Supply Long-Term Affordable Resource Cleaner-Burning Fuel $10 $10 Henry Hub ($/MMBtu) $8 $8 Average: ~$5.00 47-57% $6 Average: ~$3.50 Even $4 $6 less GHG emissions $2 $4 than coal when reak generating electricity(1) B $- $2 $(2) /MMBtu $(4) $- $ 699 MT $(6) 2010 2011 2012 2013 2015 2016 2017 2018 2020 2021 2022 2023 2025 2026 2027 2028 2030 reduction in CO2 $(8) emissions from 2010- $(10) Efficient and Flexible Source of Energy 2020 due to coal-to-gas 0 15 30 45 switching(2) Years of Supply Under Probable LNG Case 1 LNG Cargo ~30% ~140,000- 1,500+ Tcf >4 Decades 200,000 MT L48 reserves economic L48 supply at current below current prices production levels Energy to provide heat for Natural gas has a lower CO displaced with each ~1 million people for a average heat rate than 2 LNG cargo(3) winter month in Europe coal & petroleum U.S. Natural Gas Answers the Global Call for Secure, Reliable, Cleaner-Burning Energy Supply Source: Cheniere Research, IEA, IHS Markit, GIIGNL. 29 (1) Cheniere peer-reviewed LCA. 100 yr – 20 yr GWP basis, based on 2018 Case Study for China from Roman-White et al. 2021. Reflects estimates in China specifically. (2) IEA. (3) Based on 20-year GWP and data from the National Energy Technology Laboratory.
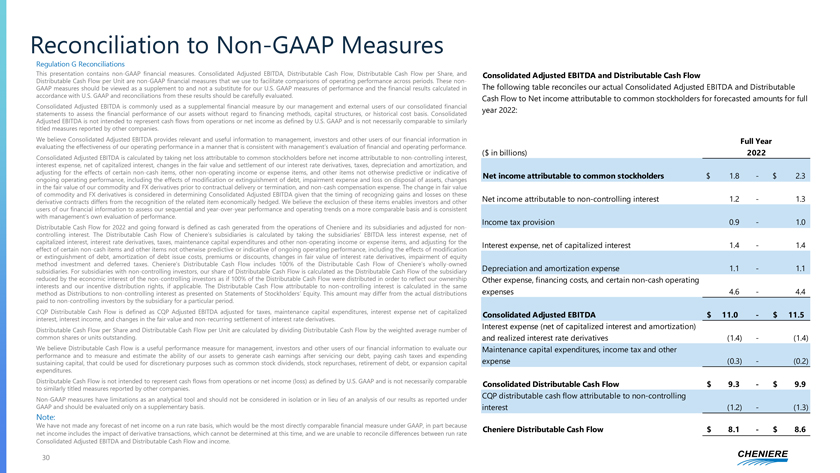
Reconciliation to Non-GAAP Measures Regulation G Reconciliations This presentation contains non-GAAP financial measures. Consolidated Adjusted EBITDA, Distributable Cash Flow, Distributable Cash Flow per Share, and Distributable Cash Flow per Unit are non-GAAP financial measures that we use to facilitate comparisons of operating performance across periods. These non-GAAP measures should be viewed as a supplement to and not a substitute for our U.S. GAAP measures of performance and the financial results calculated in accordance with U.S. GAAP and reconciliations from these results should be carefully evaluated. Consolidated Adjusted EBITDA is commonly used as a supplemental financial measure by our management and external users of our consolidated financial statements to assess the financial performance of our assets without regard to financing methods, capital structures, or historical cost basis. Consolidated Adjusted EBITDA is not intended to represent cash flows from operations or net income as defined by U.S. GAAP and is not necessarily comparable to similarly titled measures reported by other companies. We believe Consolidated Adjusted EBITDA provides relevant and useful information to management, investors and other users of our financial information in evaluating the effectiveness of our operating performance in a manner that is consistent with management’s evaluation of financial and operating performance. Consolidated Adjusted EBITDA is calculated by taking net loss attributable to common stockholders before net income attributable to non-controlling interest, interest expense, net of capitalized interest, changes in the fair value and settlement of our interest rate derivatives, taxes, depreciation and amortization, and adjusting for the effects of certain non-cash items, other non-operating income or expense items, and other items not otherwise predictive or indicative of ongoing operating performance, including the effects of modification or extinguishment of debt, impairment expense and loss on disposal of assets, changes in the fair value of our commodity and FX derivatives prior to contractual delivery or termination, and non-cash compensation expense. The change in fair value of commodity and FX derivatives is considered in determining Consolidated Adjusted EBITDA given that the timing of recognizing gains and losses on these derivative contracts differs from the recognition of the related item economically hedged. We believe the exclusion of these items enables investors and other users of our financial information to assess our sequential and year-over-year performance and operating trends on a more comparable basis and is consistent with management’s own evaluation of performance. Distributable Cash Flow for 2022 and going forward is defined as cash generated from the operations of Cheniere and its subsidiaries and adjusted for non-controlling interest. The Distributable Cash Flow of Cheniere’s subsidiaries is calculated by taking the subsidiaries’ EBITDA less interest expense, net of capitalized interest, interest rate derivatives, taxes, maintenance capital expenditures and other non-operating income or expense items, and adjusting for the effect of certain non-cash items and other items not otherwise predictive or indicative of ongoing operating performance, including the effects of modification or extinguishment of debt, amortization of debt issue costs, premiums or discounts, changes in fair value of interest rate derivatives, impairment of equity method investment and deferred taxes. Cheniere’s Distributable Cash Flow includes 100% of the Distributable Cash Flow of Cheniere’s wholly-owned subsidiaries. For subsidiaries with non-controlling investors, our share of Distributable Cash Flow is calculated as the Distributable Cash Flow of the subsidiary reduced by the economic interest of the non-controlling investors as if 100% of the Distributable Cash Flow were distributed in order to reflect our ownership interests and our incentive distribution rights, if applicable. The Distributable Cash Flow attributable to non-controlling interest is calculated in the same method as Distributions to non-controlling interest as presented on Statements of Stockholders’ Equity. This amount may differ from the actual distributions paid to non-controlling investors by the subsidiary for a particular period. CQP Distributable Cash Flow is defined as CQP Adjusted EBITDA adjusted for taxes, maintenance capital expenditures, interest expense net of capitalized interest, interest income, and changes in the fair value and non-recurring settlement of interest rate derivatives. Distributable Cash Flow per Share and Distributable Cash Flow per Unit are calculated by dividing Distributable Cash Flow by the weighted average number of common shares or units outstanding. We believe Distributable Cash Flow is a useful performance measure for management, investors and other users of our financial information to evaluate our performance and to measure and estimate the ability of our assets to generate cash earnings after servicing our debt, paying cash taxes and expending sustaining capital, that could be used for discretionary purposes such as common stock dividends, stock repurchases, retirement of debt, or expansion capital expenditures. Distributable Cash Flow is not intended to represent cash flows from operations or net income (loss) as defined by U.S. GAAP and is not necessarily comparable to similarly titled measures reported by other companies. Non-GAAP measures have limitations as an analytical tool and should not be considered in isolation or in lieu of an analysis of our results as reported under GAAP and should be evaluated only on a supplementary basis. Note: We have not made any forecast of net income on a run rate basis, which would be the most directly comparable financial measure under GAAP, in part because net income includes the impact of derivative transactions, which cannot be determined at this time, and we are unable to reconcile differences between run rate Consolidated Adjusted EBITDA and Distributable Cash Flow and income. Consolidated Adjusted EBITDA and Distributable Cash Flow The following table reconciles our actual Consolidated Adjusted EBITDA and Distributable Cash Flow to Net income attributable to common stockholders for forecasted amounts for full year 2022: Full Year ($ in billions) 2022 Net income attributable to common stockholders $ 1.8 — $ 2.3 Net income attributable to non-controlling interest 1.2 — 1.3 Income tax provision 0.9 — 1.0 Interest expense, net of capitalized interest 1.4 — 1.4 Depreciation and amortization expense 1.1 — 1.1 Other expense, financing costs, and certain non-cash operating expenses 4.6 — 4.4 Consolidated Adjusted EBITDA $ 11.0 — $ 11.5 Interest expense (net of capitalized interest and amortization) and realized interest rate derivatives (1.4)— (1.4) Maintenance capital expenditures, income tax and other expense (0.3)— (0.2) Consolidated Distributable Cash Flow $ 9.3 — $ 9.9 CQP distributable cash flow attributable to non-controlling interest (1.2)— (1.3) Cheniere Distributable Cash Flow $ 8.1 — $ 8.6

Investor Relations Contacts Randy Bhatia Vice President, Investor Relations – (713) 375-5479, randy.bhatia@cheniere.com Frances Smith Manager, Investor Relations – (713) 375-5753, frances.smith@cheniere.com © 2021 Cheniere Energy, Inc. All Rights Reserved