Cheniere Energy, Inc.
IPAA Oil & Gas Investment Symposium New York April 20, 2004
“Is it too late?”
Charif Souki – Chairman, President & Chief Executive Officer
Cheniere Energy, Inc.
Safe Harbor Act Statement Under the Private Securities Litigation Reform Act of 1995: Certain information in this presentation are forward looking statements that are based on management’s belief, as well as assumptions made by, and information currently available to management. While the company believes that its expectations are based upon reasonable assumptions, there can be no assurances that the company’s financial goals will be realized. Numerous uncertainties and risk factors may affect the company’s actual results and may cause results to differ materially from those expressed in forward-looking statements made by or on behalf of the company. These uncertainties and risk factors include political, economic, environmental and geological issues, including but not limited to, the continued need for additional capital, the competition within the oil and gas industry, the price of oil and gas, currency fluctuations, and other risks detailed from time to time in the company’s periodic reports filed with the United States Securities and Exchange Commission.

American Stock Exchange Ticker: LNG
Stock Shares
Performance Outstanding Market Cap
March 31, 2003 $1.40 13,297,393 $ 18,616,350
March 31, 2004 $17.34 18,707,811 $ 324,393,442
Cheniere Energy, Inc.
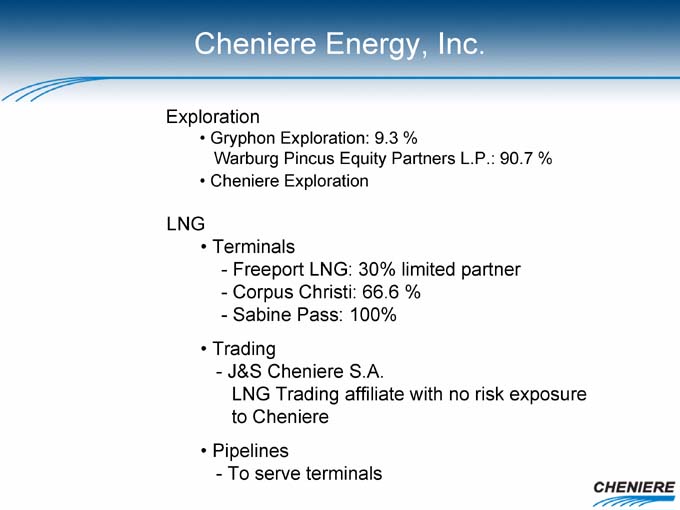
Exploration
• Gryphon Exploration: 9.3 %
Warburg Pincus Equity Partners L.P.: 90.7 %
• Cheniere Exploration
LNG
• Terminals
- Freeport LNG: 30% limited partner
- Corpus Christi: 66.6 %
- Sabine Pass: 100%
• Trading
- J&S Cheniere S.A.
LNG Trading affiliate with no risk exposure to Cheniere
• Pipelines
| - |
|
To serve terminals |
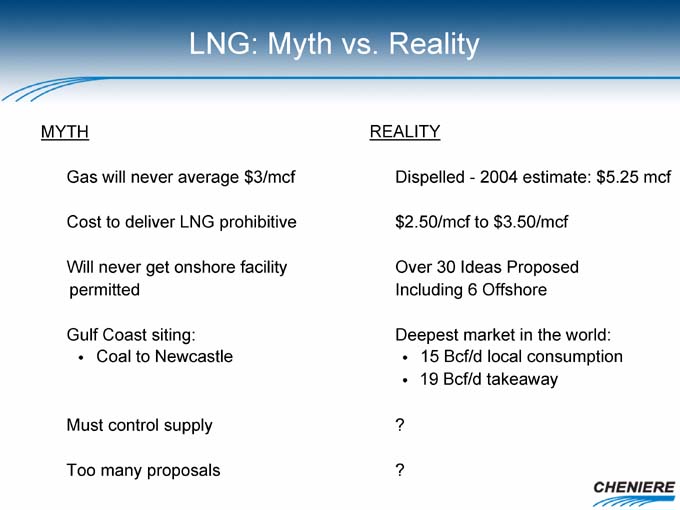
LNG: Myth vs. Reality
MYTH
• Gas will never average $3/mcf
• Cost to deliver LNG prohibitive
• Will never get onshore facility permitted
• Gulf Coast siting:
• Coal to Newcastle
Must control supply
• Too many proposals
REALITY
• Dispelled—2004 estimate: $5.25 mcf
•$ 2.50/mcf to $3.50/mcf
• Over 30 Ideas Proposed Including 6 Offshore
• Deepest market in the world:
• 15 Bcf/d local consumption
• 19 Bcf/d takeaway
• ?
• ?
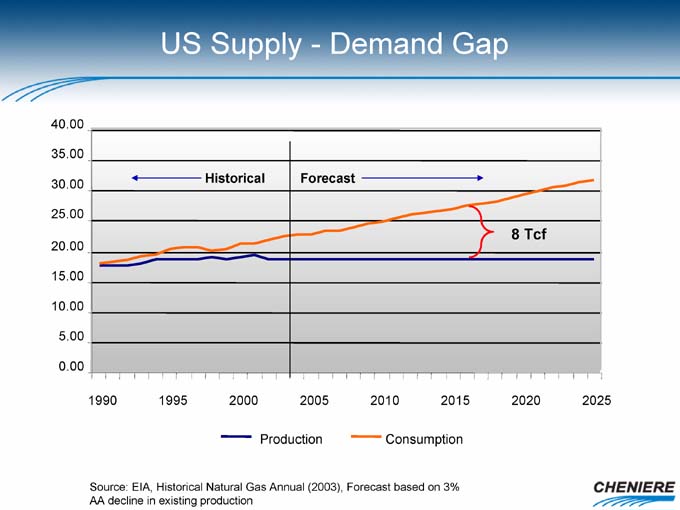
US Supply—Demand Gap
Historical Forecast
8 Tcf
Production Consumption
Source: EIA, Historical Natural Gas Annual (2003), Forecast based on 3% AA decline in existing production
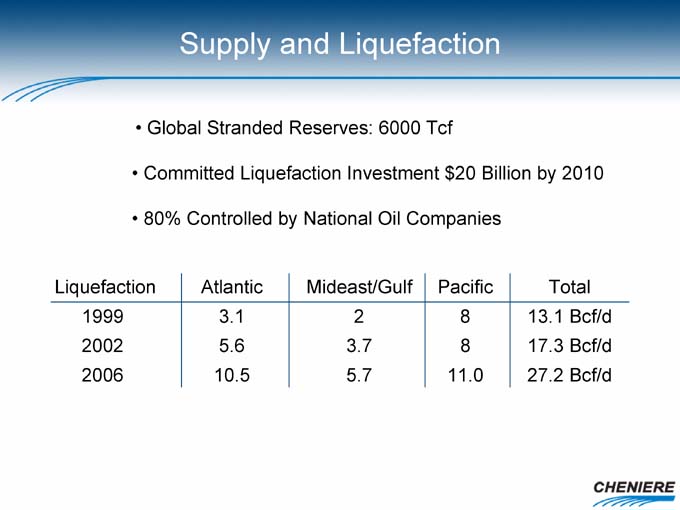
Supply and Liquefaction
• Global Stranded Reserves: 6000 Tcf
• Committed Liquefaction Investment $20 Billion by 2010
• 80% Controlled by National Oil Companies
Liquefaction Atlantic Mideast/Gulf Pacific Total
1999 3.1 2 8 13.1 Bcf/d
2002 5.6 3.7 8 17.3 Bcf/d
2006 10.5 5.7 11.0 27.2 Bcf/d
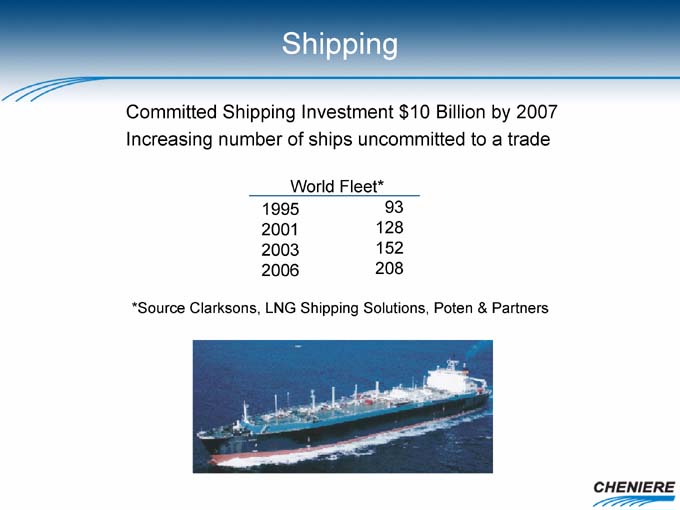
Shipping
Committed Shipping Investment $10 Billion by 2007 Increasing number of ships uncommitted to a trade
World Fleet*
1995 93
2001 128
2003 152
2006 208
*Source Clarksons, LNG Shipping Solutions, Poten & Partners
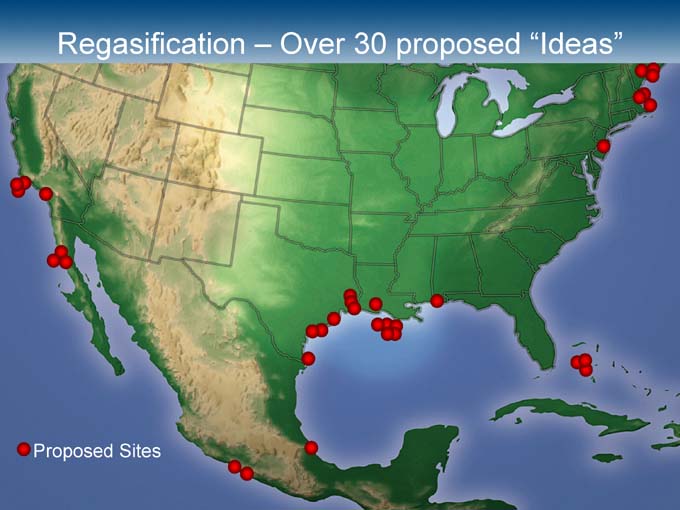
Regasification – Over 30 proposed “Ideas”
Proposed Sites
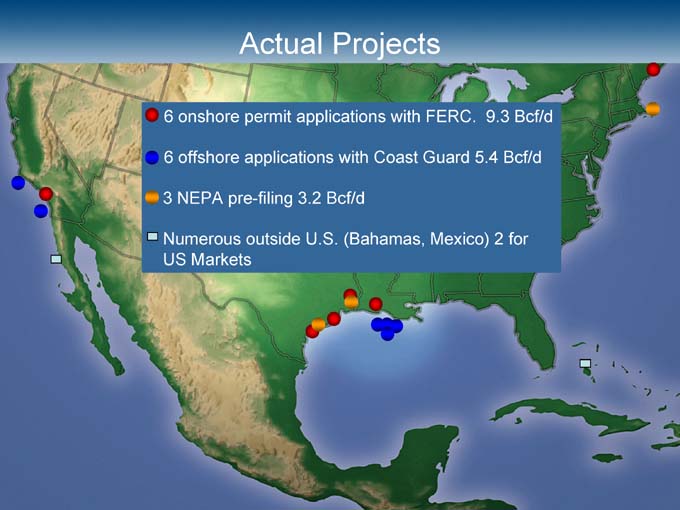
Actual Projects
6 onshore permit applications with FERC. 9.3 Bcf/d 6 offshore applications with Coast Guard 5.4 Bcf/d 3 NEPA pre-filing 3.2 Bcf/d
Numerous outside U.S. (Bahamas, Mexico) 2 for US Markets
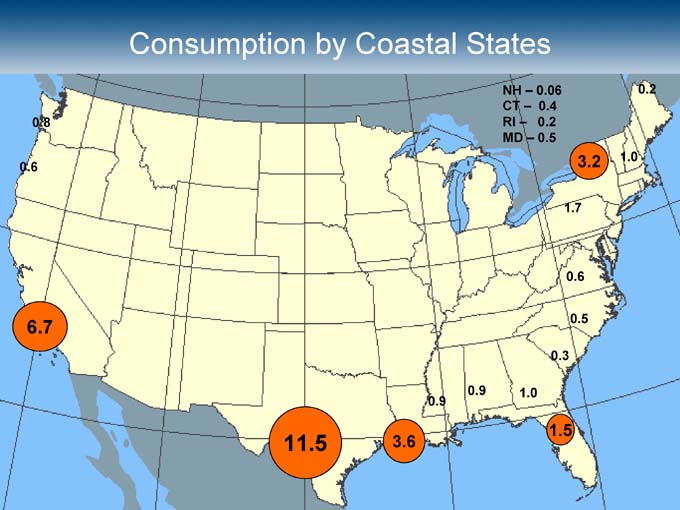
Consumption by Coastal States
NH – 0.06
CT – 0.4
RI – 0.2
MD – 0.5
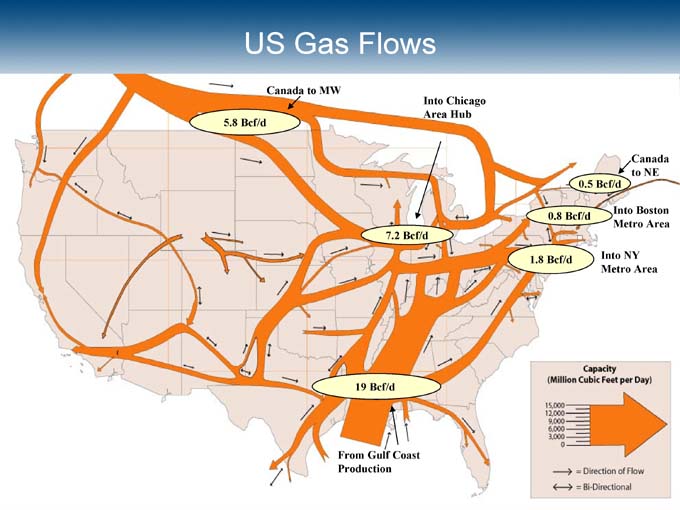
US Gas Flows
Canada to MW 5.8 Bcf/d
Into Chicago Area Hub 7.2 Bcf/d
From Gulf Coast Production 19 Bcf/d
Canada to NE 0.5 Bcf/d
Into Boston Metro Area 0.8 Bcf/d
Into NY Metro Area 1.8 Bcf/d
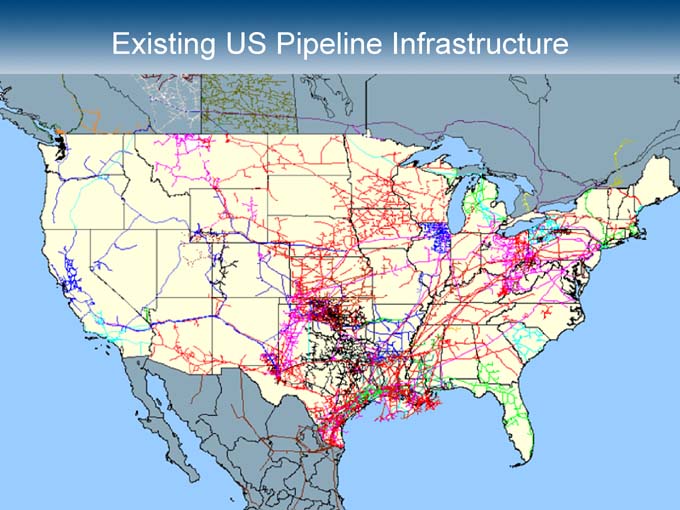
Existing US Pipeline Infrastructure

Permitting
Permit Requirements
• Objective: FERC codes and rules very straight forward
• Subjective: Local acceptance
• Length of process: 12-18 months from filing application
Offshore
• Never done
• More expensive
• Reliability un-tested
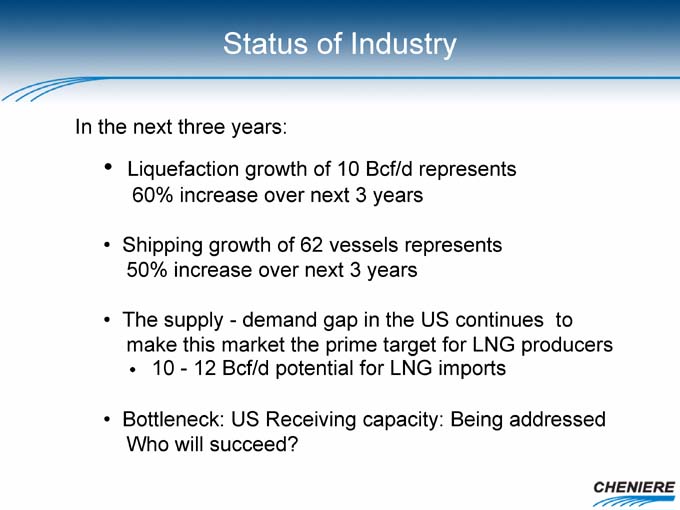
Status of Industry
In the next three years:
• Liquefaction growth of 10 Bcf/d represents 60% increase over next 3 years
• Shipping growth of 62 vessels represents 50% increase over next 3 years
• The supply—demand gap in the US continues to make this market the prime target for LNG producers
• 10—12 Bcf/d potential for LNG imports
• Bottleneck: US Receiving capacity: Being addressed Who will succeed?
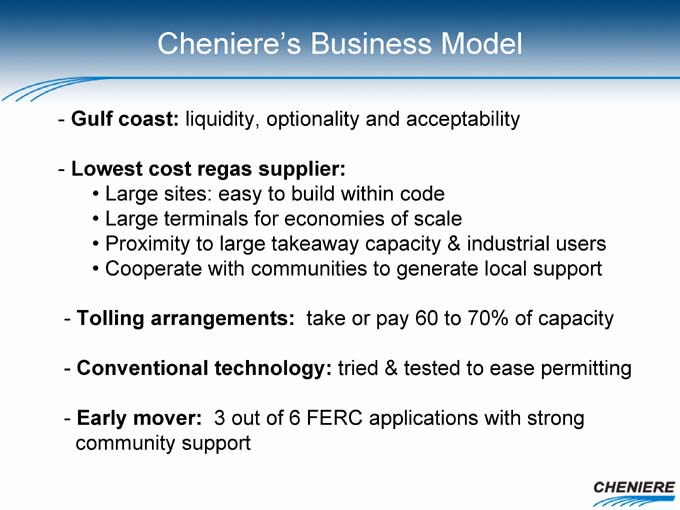
Cheniere’s Business Model
- Gulf coast: liquidity, optionality and acceptability
- Lowest cost regas supplier:
• Large sites: easy to build within code
• Large terminals for economies of scale
• Proximity to large takeaway capacity & industrial users
• Cooperate with communities to generate local support
- Tolling arrangements: take or pay 60 to 70% of capacity
- Conventional technology: tried & tested to ease permitting
- Early mover: 3 out of 6 FERC applications with strong community support
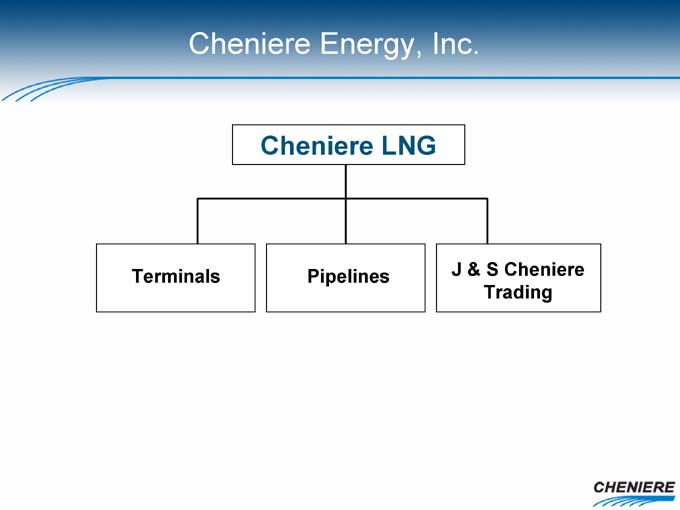
Cheniere Energy, Inc.
Cheniere LNG
Terminals
Pipelines
J & S Cheniere Trading
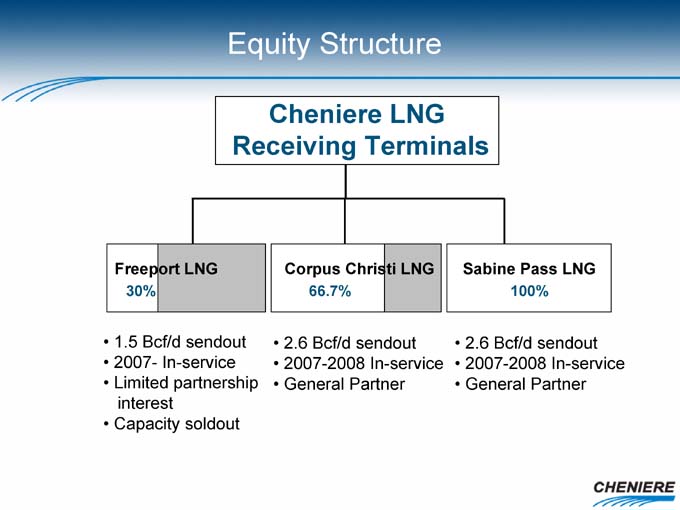
Equity Structure
Cheniere LNG Receiving Terminals
Freeport LNG
30%
• 1.5 Bcf/d sendout
• 2007- In-service
• Limited partnership interest
• Capacity soldout
Corpus Christi LNG
66.7%
• 2.6 Bcf/d sendout
• 2007-2008 In-service
• General Partner
Sabine Pass LNG
100%
• 2.6 Bcf/d sendout
• 2007-2008 In-service
• General Partner
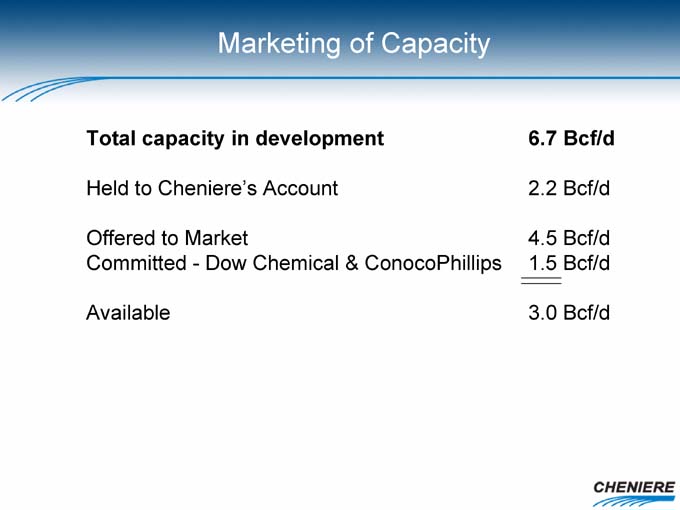
Marketing of Capacity
Total capacity in development 6.7 Bcf/d
Held to Cheniere’s Account 2.2 Bcf/d
Offered to Market 4.5 Bcf/d
Committed—Dow Chemical & ConocoPhillips 1.5 Bcf/d
Available 3.0 Bcf/d
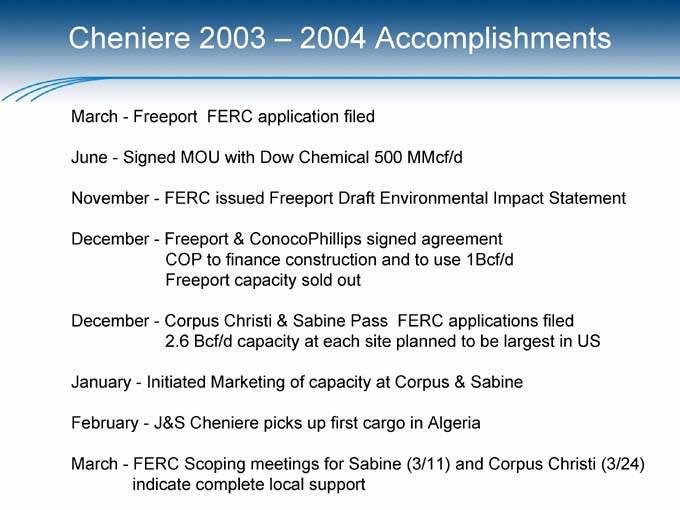
Cheniere 2003 – 2004 Accomplishments
March—Freeport FERC application filed
June—Signed MOU with Dow Chemical 500 MMcf/d
November—FERC issued Freeport Draft Environmental Impact Statement
December—Freeport & ConocoPhillips signed agreement COP to finance construction and to use 1Bcf/d Freeport capacity sold out
December—Corpus Christi & Sabine Pass FERC applications filed 2.6 Bcf/d capacity at each site planned to be largest in US
January—Initiated Marketing of capacity at Corpus & Sabine
February—J&S Cheniere picks up first cargo in Algeria
March—FERC Scoping meetings for Sabine (3/11) and Corpus Christi (3/24) indicate complete local support
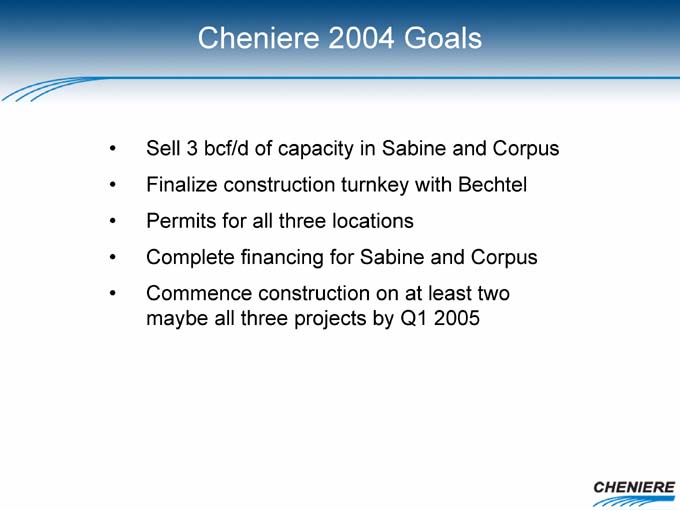
Cheniere 2004 Goals
• Sell 3 bcf/d of capacity in Sabine and Corpus
• Finalize construction turnkey with Bechtel
• Permits for all three locations
• Complete financing for Sabine and Corpus
• Commence construction on at least two maybe all three projects by Q1 2005
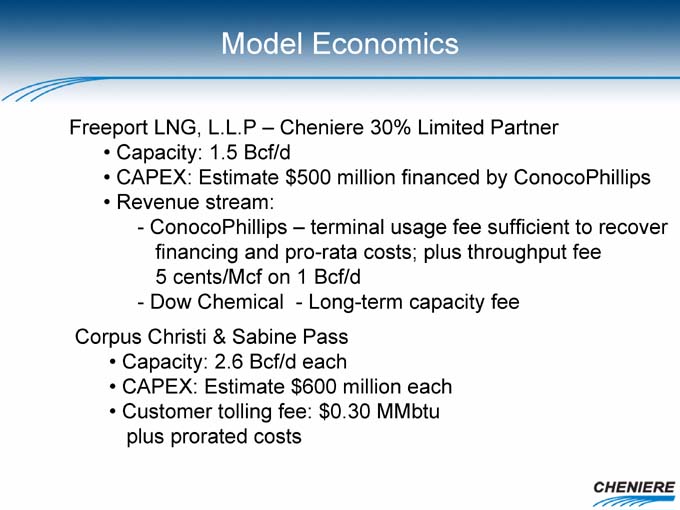
Model Economics
Freeport LNG, L.L.P – Cheniere 30% Limited Partner
• Capacity: 1.5 Bcf/d
• CAPEX: Estimate $500 million financed by ConocoPhillips
• Revenue stream:
- ConocoPhillips – terminal usage fee sufficient to recover financing and pro-rata costs; plus throughput fee 5 cents/Mcf on 1 Bcf/d
- Dow Chemical—Long-term capacity fee
Corpus Christi & Sabine Pass
• Capacity: 2.6 Bcf/d each
• CAPEX: Estimate $600 million each
• Customer tolling fee: $0.30 MMbtu plus prorated costs
Cheniere Energy, Inc.
Is it too late?
• By 2007/2008 these terminals represent only a portion of this nation’s requirements.
• These terminals, with strong local support and early applications will be among the first new terminals built onshore in the US.
• With their cost structure they will provide the lowest regas costs in the US
• If we execute our business plan we will be able to retain 2 Bcf/d to market for our own account. Our share of Freeport’s cash flow is only the first step.
• The value creation process should be completed early next year. With permits and long term take or pay contracts, during Q1 2005, valuing the company will become a discounting exercise.