Exhibit 99.1
Corporate Presentation April 2008 CHENIERE ENERGY
This presentation contains certain statements that are, or may be deemed to be, “forward-looking statements” within the meaning of Section 27A of the Securities Act of 1933, as amended, and Section 21E of the Securities Exchange Act of 1934 as amended. All statements, other than statements of historical fact, included herein are “forward-looking statements.” Included among “forward-looking statements” are, among other things: statements that we expect to commence or complete construction of each or any of our proposed liquefied natural gas, or LNG, receiving terminals and pipelines by certain dates, or at all; statements that we expect to receive authorization from the Federal Energy Regulatory Commission, or FERC, to construct and operate proposed LNG receiving terminals and pipelines by a certain date, or at all; statements regarding future levels of domestic natural gas production and consumption, or the future level of LNG imports into North America, or regarding projected future capacity of liquefaction or regasification, liquefaction utilization or total monthly LNG trade facilities worldwide, regardless of the source of such information; statements regarding any financing transactions or arrangements, whether on the part of Cheniere or at the project level; statements relating to the construction of our proposed LNG receiving terminals and pipelines, including statements concerning estimated costs, and the engagement of any contractor; statements regarding any Terminal Use Agreement, or TUA, or other commercial arrangements presently contracted, optioned, marketed or potential arrangements to be performed substantially in the future, including any cash distributions and revenues anticipated to be received; statements regarding the commercial terms and potential revenues from activities described in this presentation; statements regarding the commercial terms or potential revenue from any arrangements which may arise from the marketing of uncommitted capacity from any of the terminals, including the Creole Trail and Corpus Christi terminals which do not currently have contractual commitments; statements that our proposed LNG receiving terminals, when completed, will have certain characteristics, including amounts of regasification and storage capacities, a number of storage tanks and docks and pipeline interconnections; statements regarding forecasts, including any potential revenue and capital expenditures and cash flows; statements regarding our proposed pipelines and the capital expenditures and potential revenues related to them; statements regarding our proposed LNG receiving terminals’ access to existing pipelines, and their ability to obtain transportation capacity on existing pipelines; statements regarding the Cheniere Southern Trail Pipeline, and its potential business opportunities; statements regarding possible expansions of the currently projected size of, or any enhancements at, any of our proposed LNG receiving terminals, and statements regarding potential acquisitions; statements regarding the payment by Cheniere Energy Partners, L.P. of cash distributions; statements regarding our business strategy, our business plan or any other plans, forecasts, examples, models, or objectives, any or all of which are subject to change; statements regarding estimated corporate overhead expenses; and any other statements that relate to non-historical information. These forward-looking statements are often identified by the use of terms and phrases such as “achieve,” “anticipate,” “believe,” “estimate,” “example,” “expect,” “forecast,” “opportunities,” “plan,” “potential,” “project,” “propose,” “subject to,” and similar terms and phrases. Although we believe that the expectations reflected in these forward-looking statements are reasonable, they do involve assumptions, risks and uncertainties, and these expectations may prove to be incorrect. You should not place undue reliance on these forward-looking statements, which speak only as of the date of this presentation. Our actual results could differ materially from those anticipated in these forward-looking statements as a result of a variety of factors, including those discussed in “Risk Factors” in the Cheniere Energy, Inc. and Cheniere Energy Partners, L.P. Annual Reports on Form 10-K for the year ended December 31, 2007. All forward-looking statements attributable to us or persons acting on our behalf are expressly qualified in their entirety by these ”Risk Factors”. These forward-looking statements are made as of the date of this presentation, and we undertake no obligation to publicly update or revise any forward-looking statements. Safe Harbor Statement
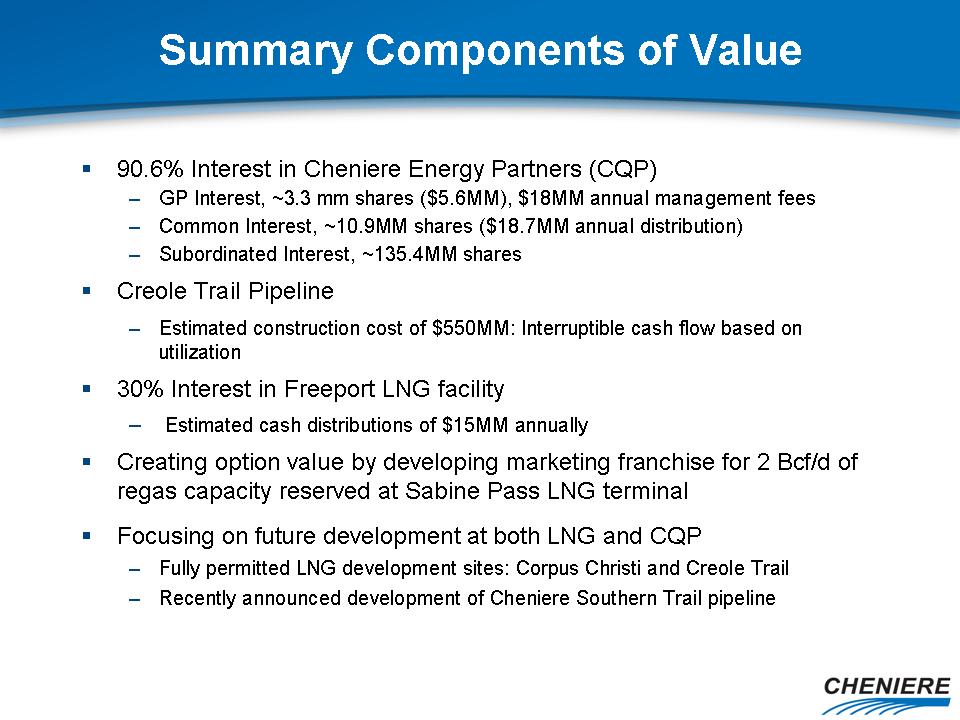
Summary Components of Value 90.6% Interest in Cheniere Energy Partners (CQP) GP Interest, ~3.3 mm shares ($5.6MM), $18MM annual management fees Common Interest, ~10.9MM shares ($18.7MM annual distribution) Subordinated Interest, ~135.4MM shares Creole Trail Pipeline Estimated construction cost of $550MM: Interruptible cash flow based on utilization 30% Interest in Freeport LNG facility Estimated cash distributions of $15MM annually Creating option value by developing marketing franchise for 2 Bcf/d of regas capacity reserved at Sabine Pass LNG terminal Focusing on future development at both LNG and CQP Fully permitted LNG development sites: Corpus Christi and Creole Trail Recently announced development of Cheniere Southern Trail pipeline
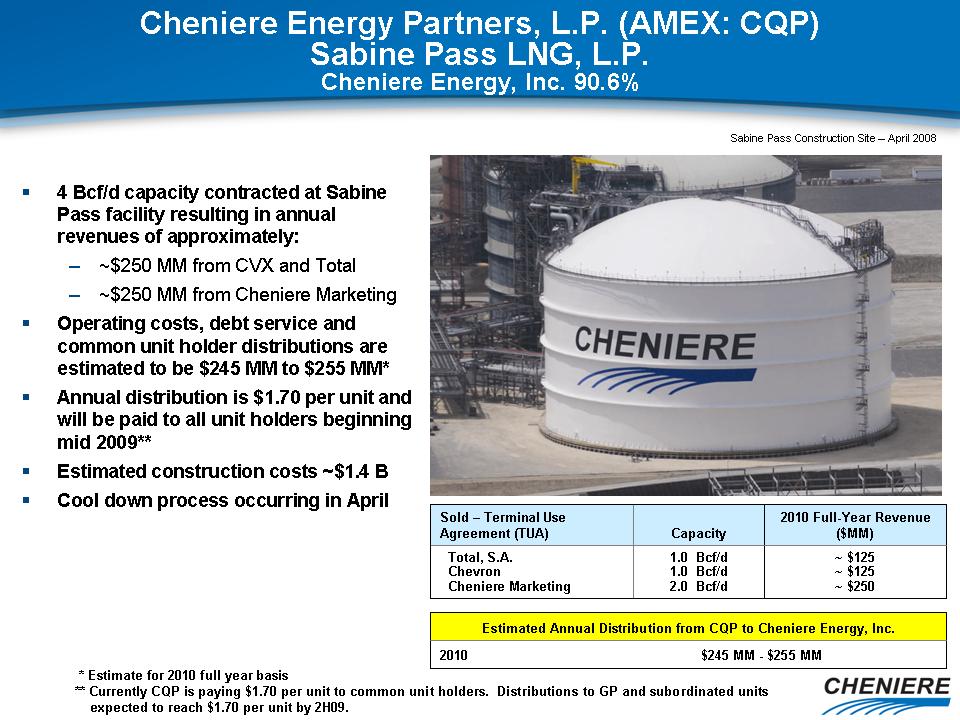
Cheniere Energy Partners, L.P. (AMEX: CQP) Sabine Pass LNG, L.P. Cheniere Energy, Inc. 90.6% Sabine Pass Construction Site – April 2008 4 Bcf/d capacity contracted at Sabine Pass facility resulting in annual revenues of approximately: $250 MM from CVX and Total $250 MM from Cheniere Marketing Operating costs, debt service and common unit holder distributions are estimated to be $245 MM to $255 MM* Annual distribution is $1.70 per unit and will be paid to all unit holders beginning mid 2009** Estimated construction costs ~$1.4 B Cool down process occurring in April * Estimate for 2010 full year basis ** Currently CQP is paying $1.70 per unit to common unit holders. Distributions to GP and subordinated units expected to reach $1.70 per unit by 2H09.
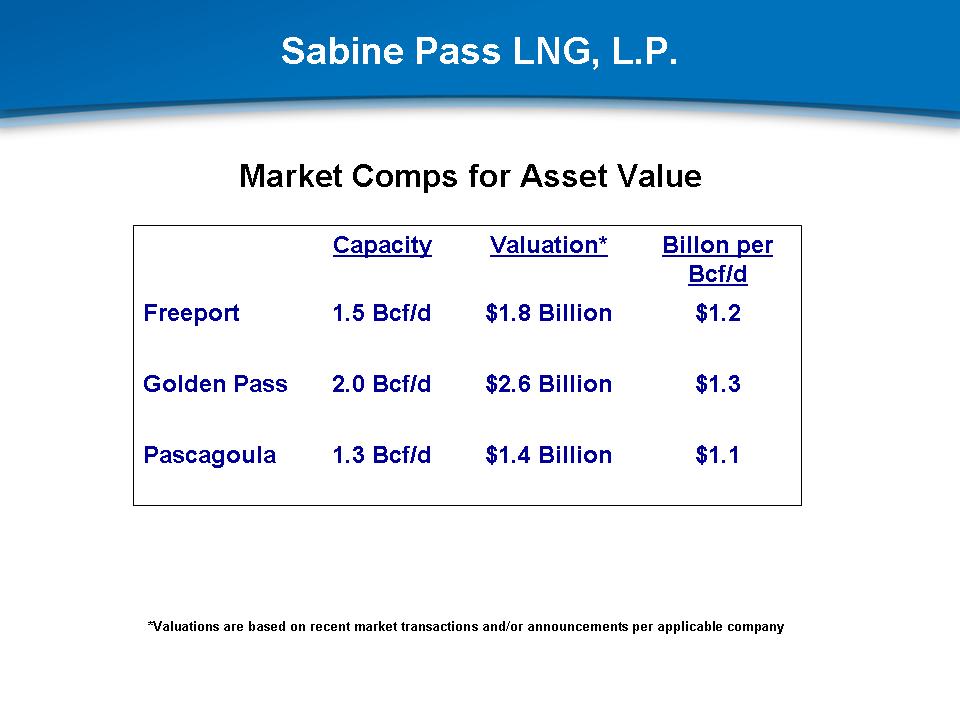
Sabine Pass LNG, L.P. Market Comps for Asset Value *Valuations are based on recent market transactions and/or announcements per applicable company Capacity Valuation* Billon per Bcf/d Freeport 1.5 Bcf/d $1.8 Billion $1.2 Golden Pass 2.0 Bcf/d $2.6 Billion $1.3 Pascagoula 1.3 Bcf/d $1.4 Billion $1.1
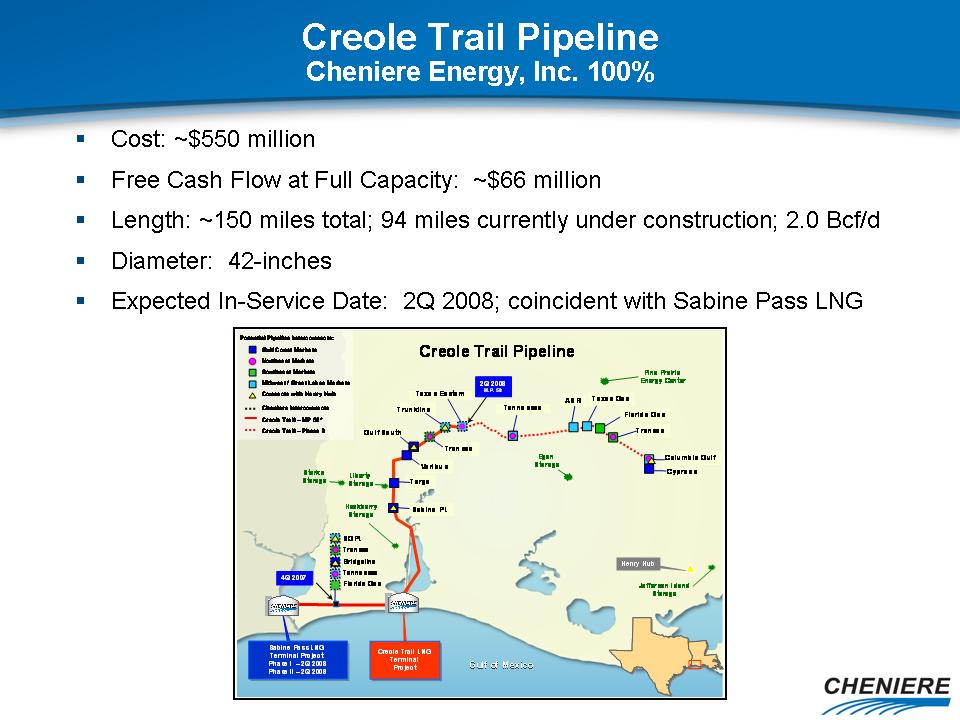
Creole Trail Pipeline Cheniere Energy, Inc. 100% Cost: ~$550 million Free Cash Flow at Full Capacity: ~$66 million Length: ~150 miles total; 94 miles currently under construction; 2.0 Bcf/d Diameter: 42-inches Expected In-Service Date: 2Q 2008; coincident with Sabine Pass LNG
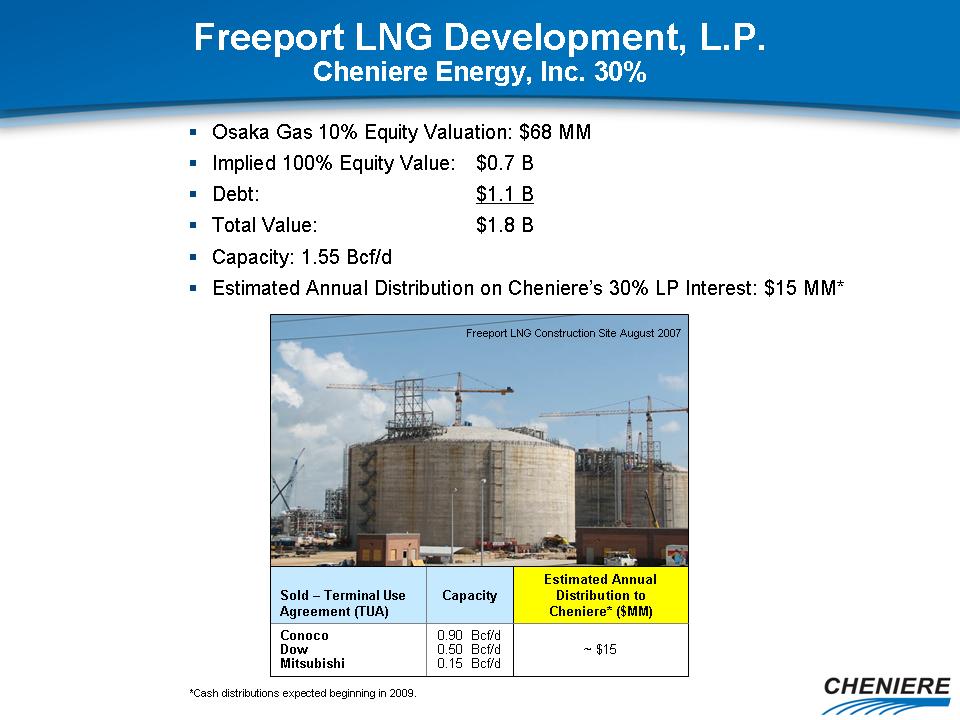
Freeport LNG Development, L.P. Cheniere Energy, Inc. 30% Osaka Gas 10% Equity Valuation: $68 MM Implied 100% Equity Value: $0.7 B Debt: $1.1 B Total Value: $1.8 B Capacity: 1.55 Bcf/d Estimated Annual Distribution on Cheniere’s 30% LP Interest: $15 MM* Freeport LNG Construction Site August 2007 *Cash distributions expected beginning in 2009. Sold – Terminal Use Agreement (TUA) Capacity Estimated Annual Distribution to Cheniere* ($MM) Conoco Dow Mitsubishi 0.90 Bcf/d 0.50 Bcf/d 0.15 Bcf/d ~ $15
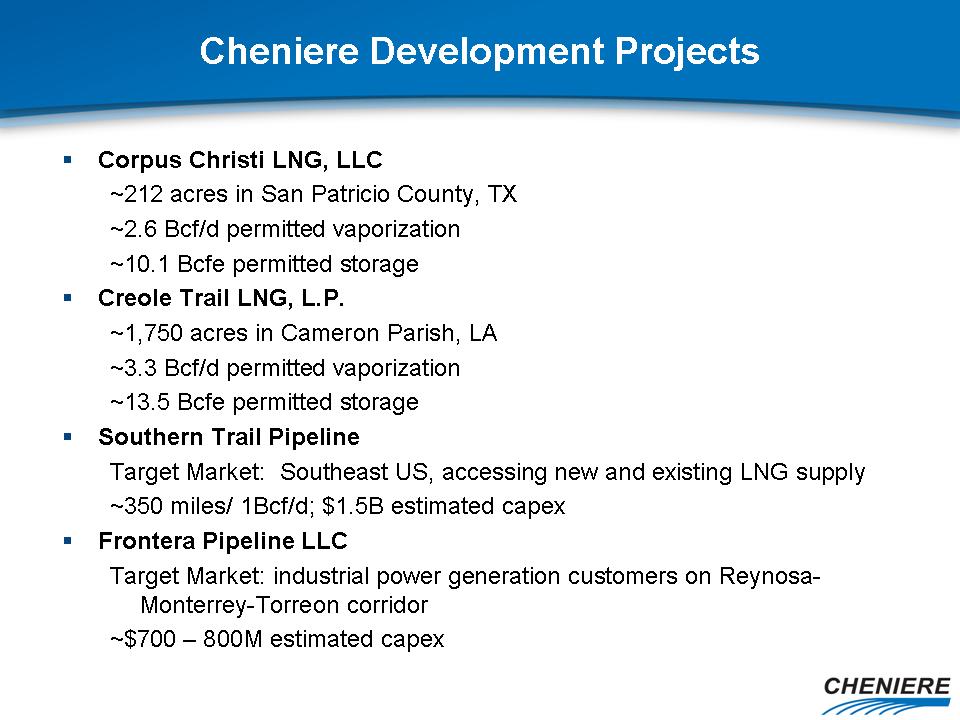
Cheniere Development Projects Corpus Christi LNG, LLC ~212 acres in San Patricio County, TX ~2.6 Bcf/d permitted vaporization ~10.1 Bcfe permitted storage Creole Trail LNG, L.P. ~1,750 acres in Cameron Parish, LA ~3.3 Bcf/d permitted vaporization ~13.5 Bcfe permitted storage Southern Trail Pipeline Target Market: Southeast US, accessing new and existing LNG supply ~350 miles/ 1Bcf/d; $1.5B estimated capex Frontera Pipeline LLC Target Market: industrial power generation customers on Reynosa-Monterrey-Torreon corridor ~$700 – 800M estimated capex
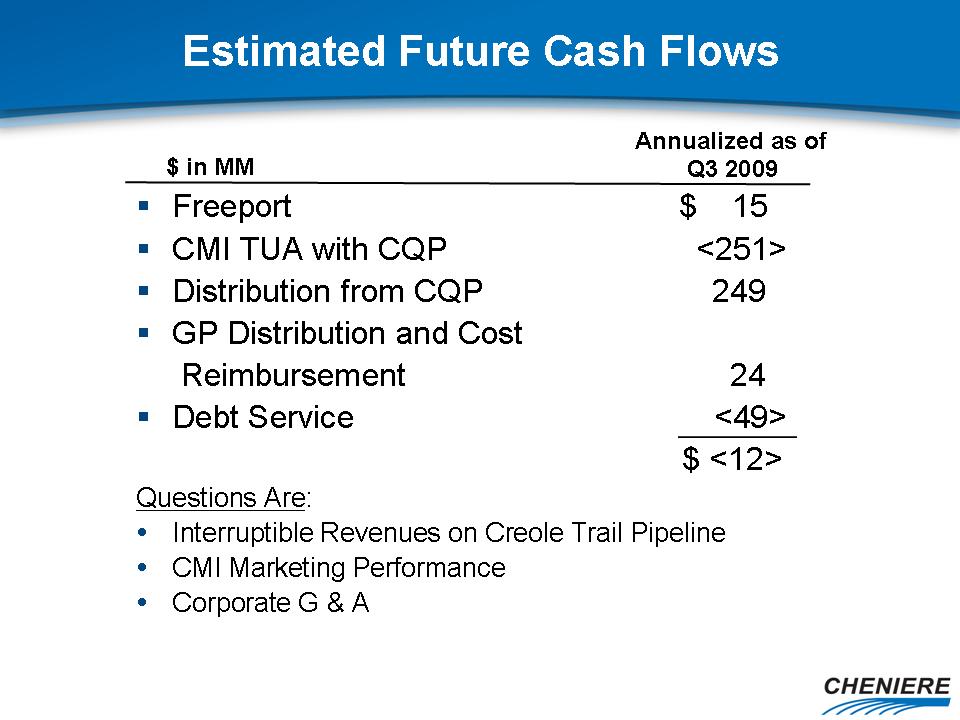
Estimated Future Cash Flows Body: Freeport $ 15 CMI TUA with CQP <251> Distribution from CQP 249 GP Distribution and Cost Reimbursement 24 Debt Service <49> $ <12> Questions Are: Interruptible Revenues on Creole Trail Pipeline CMI Marketing Performance Corporate G & A Annualized as of Q3 2009 $ in MM
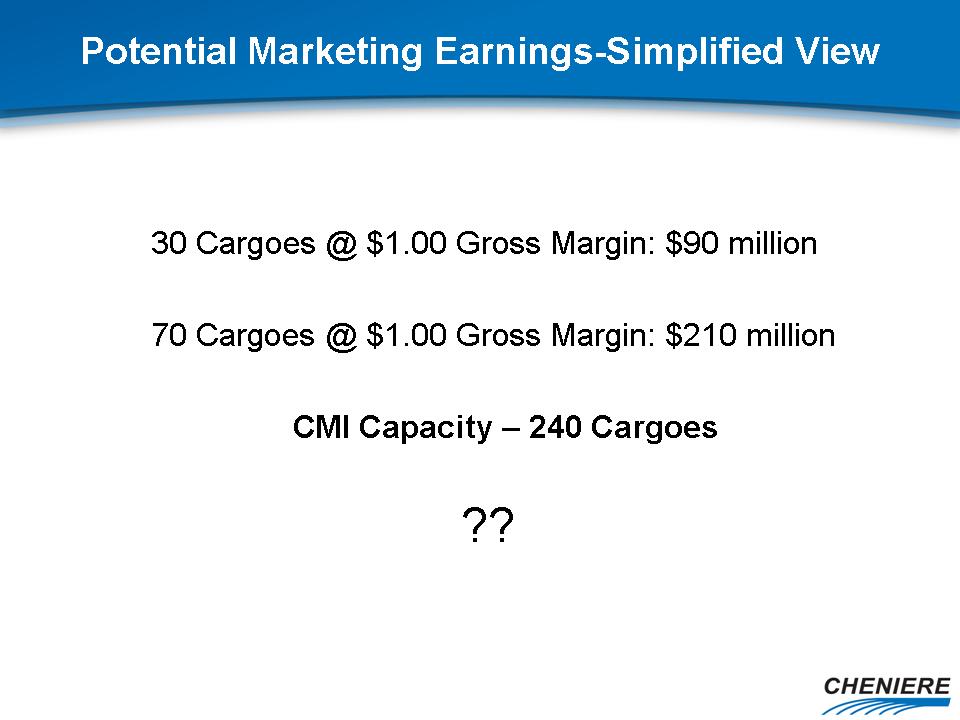
Potential Marketing Earnings-Simplified View 30 Cargoes @ $1.00 Gross Margin: $90 million 70 Cargoes @ $1.00 Gross Margin: $210 million CMI Capacity – 240 Cargoes ??
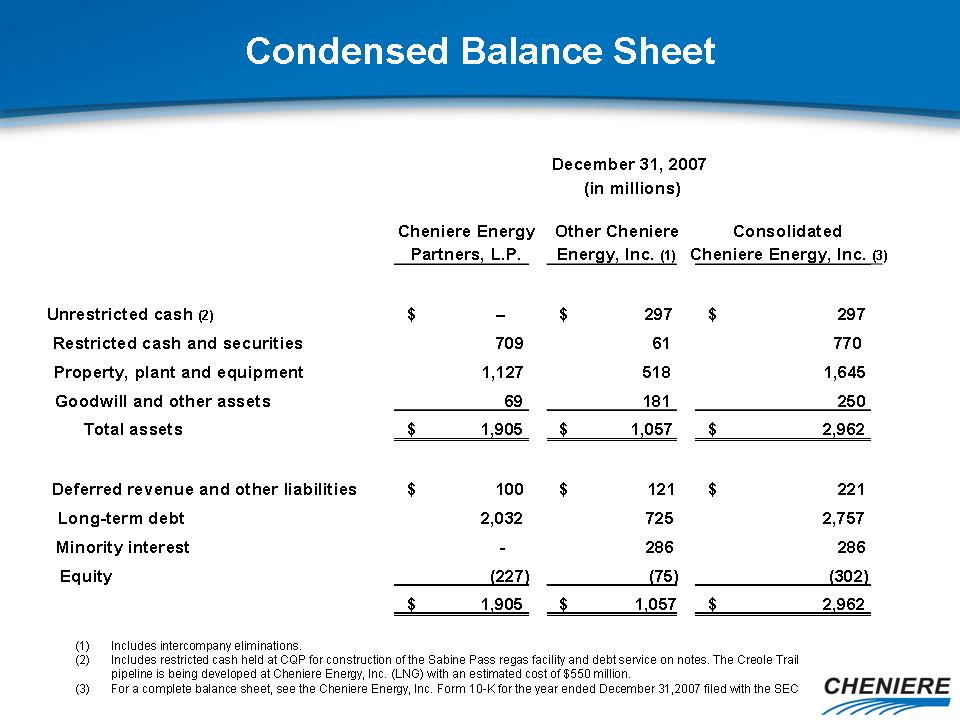
Condensed Balance Sheet Cheniere Energy Other Cheniere Consolidated Partners, L.P. Energy, Inc. (1) Cheniere Energy, Inc. (3) Unrestricted cash (2) - $ - 297 $ 297 $ Restricted cash and securities 709 61 770 Property, plant and equipment 1,127 518 1,645 Goodwill and other assets 69 181 250 Total assets 1,905 $ 1,057 $ 2,962 $ Deferred revenue and other liabilities 100 $ 121 $ 221 $ Long-term debt 2,032 725 2,757 Minority interest - 286 286 Equity (227) (75) (302) 1,905 $ 1,057 $ 2,962 $ Includes intercompany eliminations. Includes restricted cash held at CQP for construction of the Sabine Pass regas facility and debt service on notes. The Creole Trail pipeline is being developed at Cheniere Energy, Inc. (LNG) with an estimated cost of $550 million. For a complete balance sheet, see the Cheniere Energy, Inc. Form 10-K for the year ended December 31,2007 filed with the SEC December 31, 2007 (in millions)
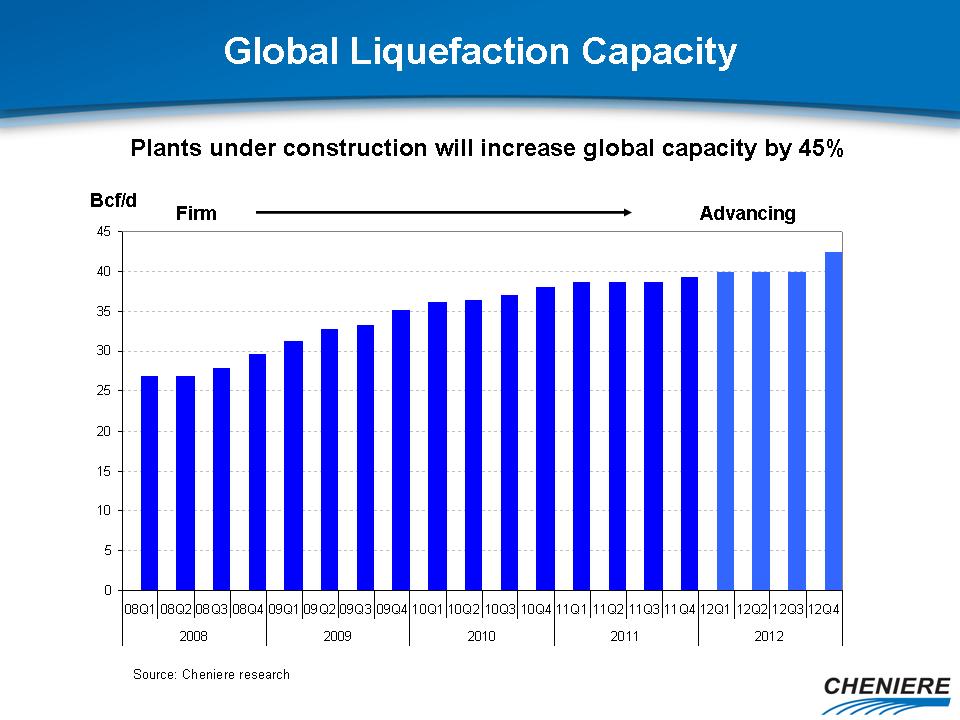
Global Liquefaction Capacity Bcf/d Advancing Firm Plants under construction will increase global capacity by 45% Source: Cheniere research
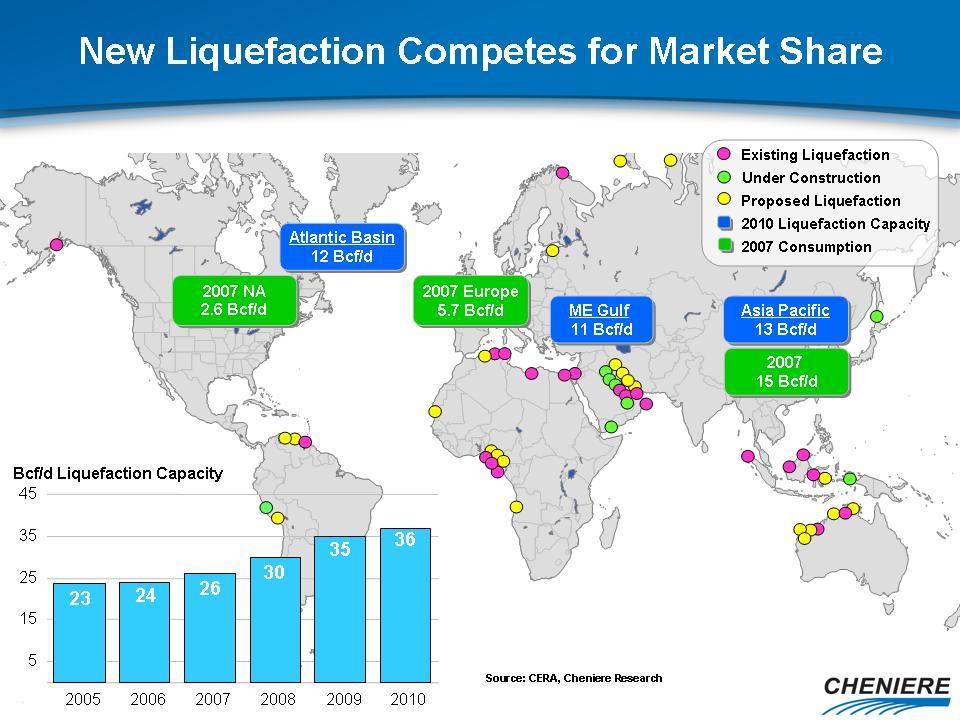
New Liquefaction Competes for Market Share Atlantic Basin 12 Bcf/d ME Gulf 11 Bcf/d Asia Pacific 13 Bcf/d 2007 Europe 5.7 Bcf/d 2007 15 Bcf/d 2007 NA 2.6 Bcf/d (Gp:) 2010 Liquefaction Capacity (Gp:) 2007 Consumption 5 15 25 35 45 2005 2006 2007 2008 2009 2010 36 23 24 26 30 35 Bcf/d Liquefaction Capacity Existing Liquefaction Under Construction Proposed Liquefaction Source: CERA, Cheniere Research
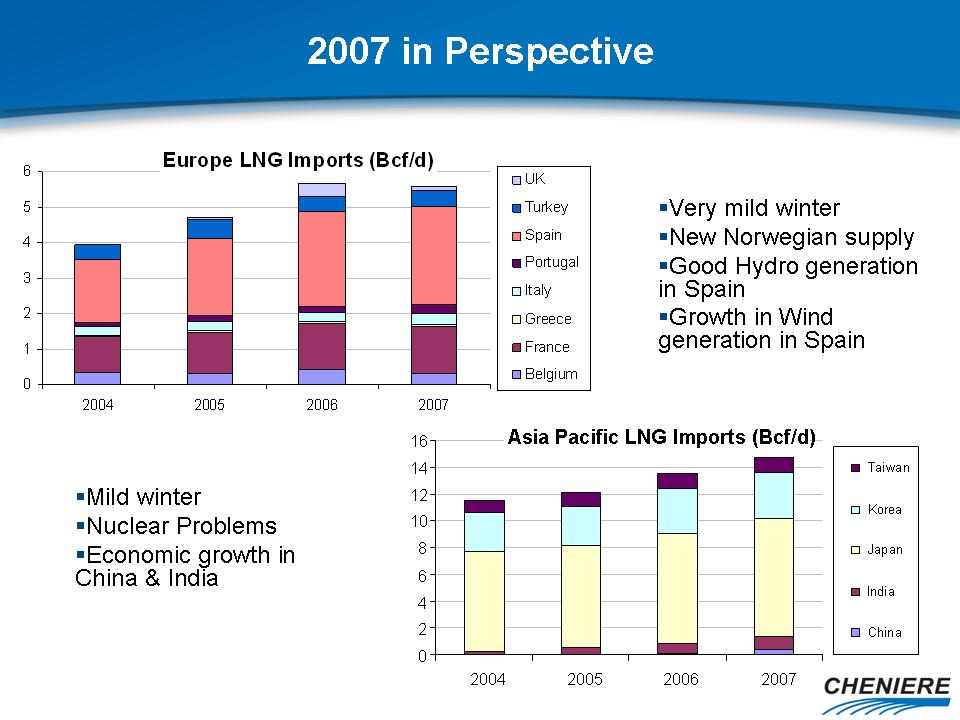
2007 in Perspective Very mild winter New Norwegian supply Good Hydro generation in Spain Growth in Wind generation in Spain Mild winter Nuclear Problems Economic growth in China & India Asia Pacific LNG Imports (Bcf/d) 0 2 4 6 8 10 12 14 16 2004 2005 2006 2007 Taiwan Korea Japan India China
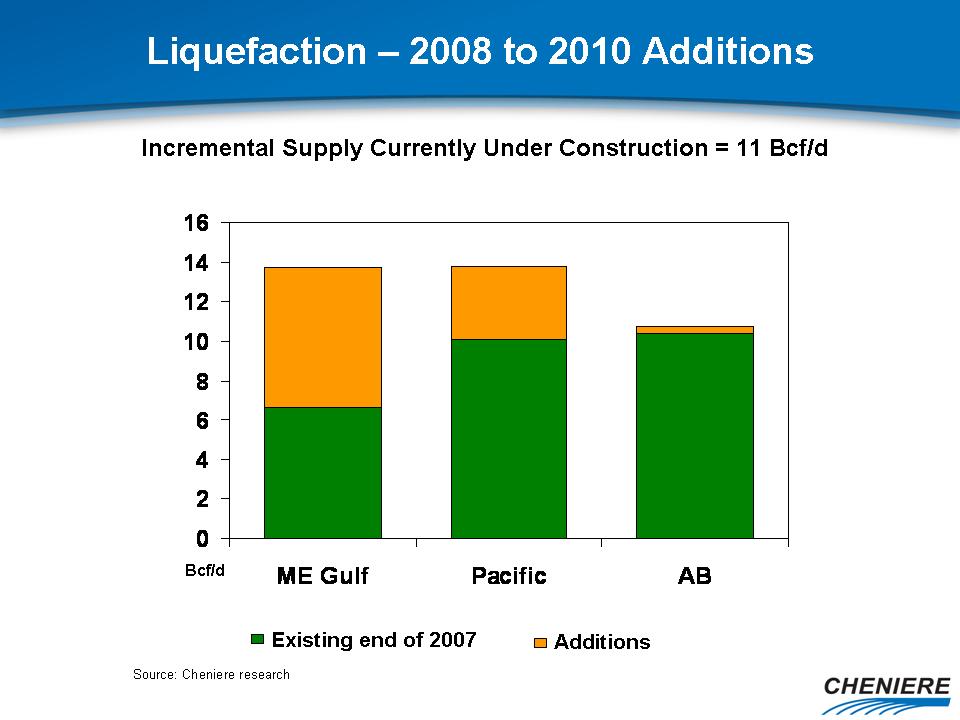
Liquefaction – 2008 to 2010 Additions 5.1 3.9 Incremental Supply Currently Under Construction = 11 Bcf/d Existing end of 2007 Additions Bcf/d Source: Cheniere research
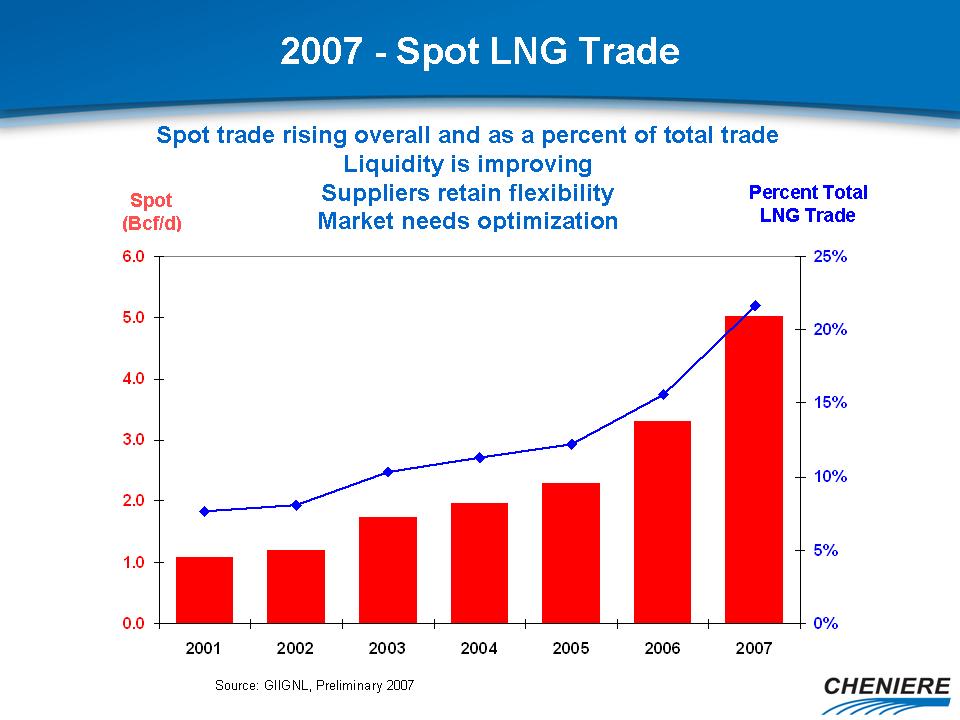
2007 - Spot LNG Trade Percent Total LNG Trade Spot (Bcf/d) Spot trade rising overall and as a percent of total trade Liquidity is improving Suppliers retain flexibility Market needs optimization Source: GIIGNL, Preliminary 2007
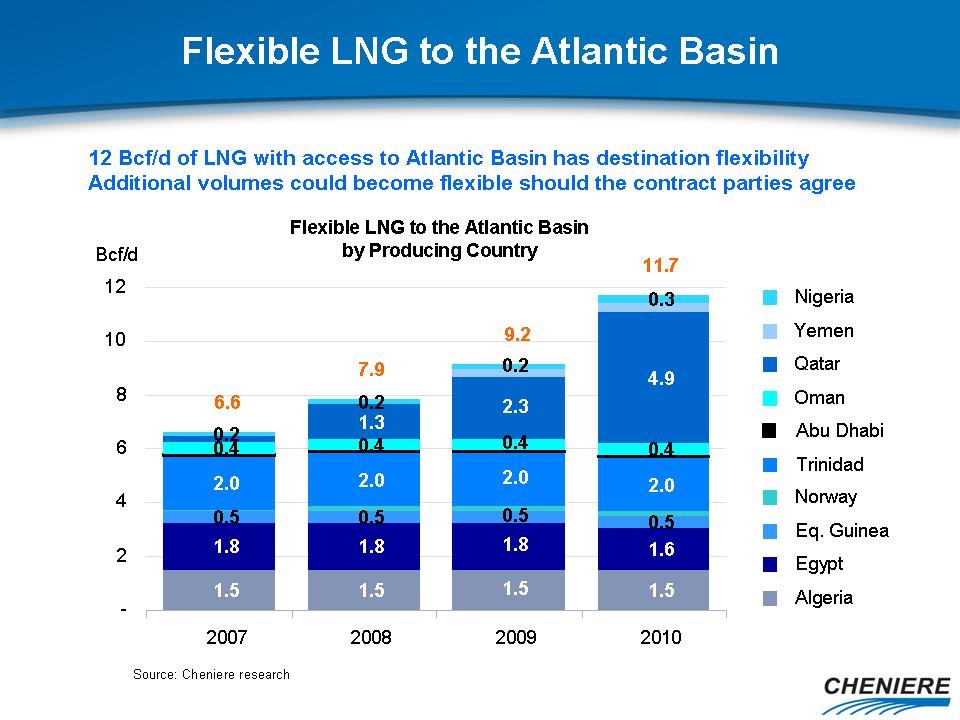
1.5 1.5 1.5 1.5 1.8 1.8 1.8 1.6 0.5 0.5 0.5 0.5 2.0 2.0 2.0 2.0 0.4 0.4 0.4 0.4 1.3 2.3 4.9 0.2 0.2 0.2 0.3 9.2 11.7 7.9 6.6 - 2 4 6 8 10 12 2007 2008 2009 2010 Bcf/d Nigeria Yemen Qatar Oman Abu Dhabi Trinidad Norway Eq. Guinea Egypt Algeria Flexible LNG to the Atlantic Basin Flexible LNG to the Atlantic Basin by Producing Country 12 Bcf/d of LNG with access to Atlantic Basin has destination flexibility Additional volumes could become flexible should the contract parties agree Source: Cheniere research
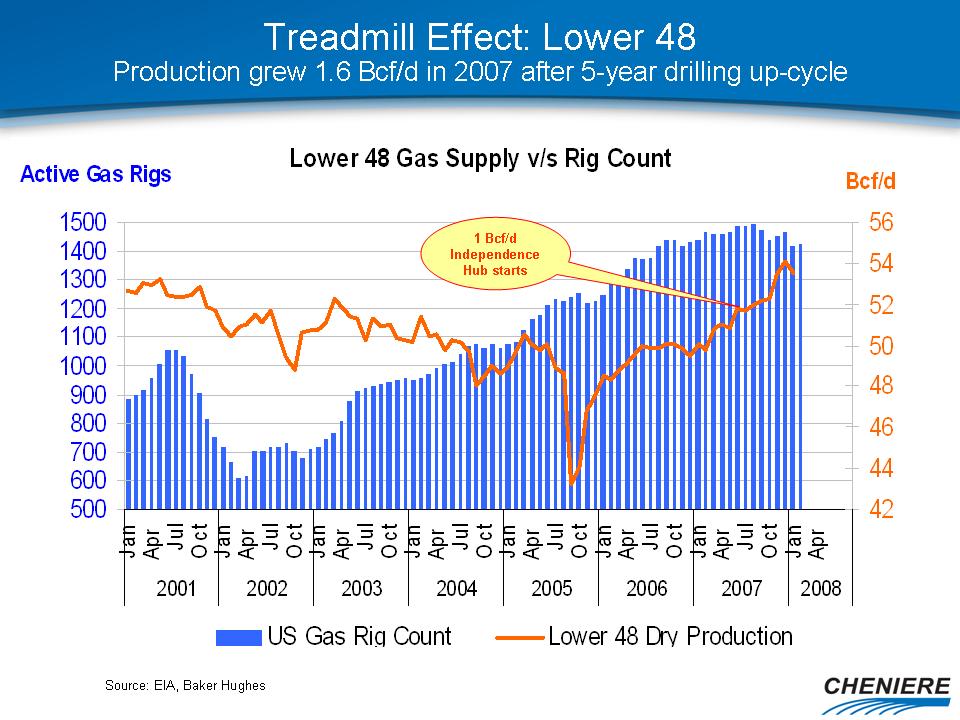
Source: EIA, Baker HughesTreadmill Effect: Lower 48 Production grew 1.6 Bcf/d in 2007 after 5-year drilling up-cycle 1 Bcf/d Independence Hub starts
Source: EIA, Baker Hughe
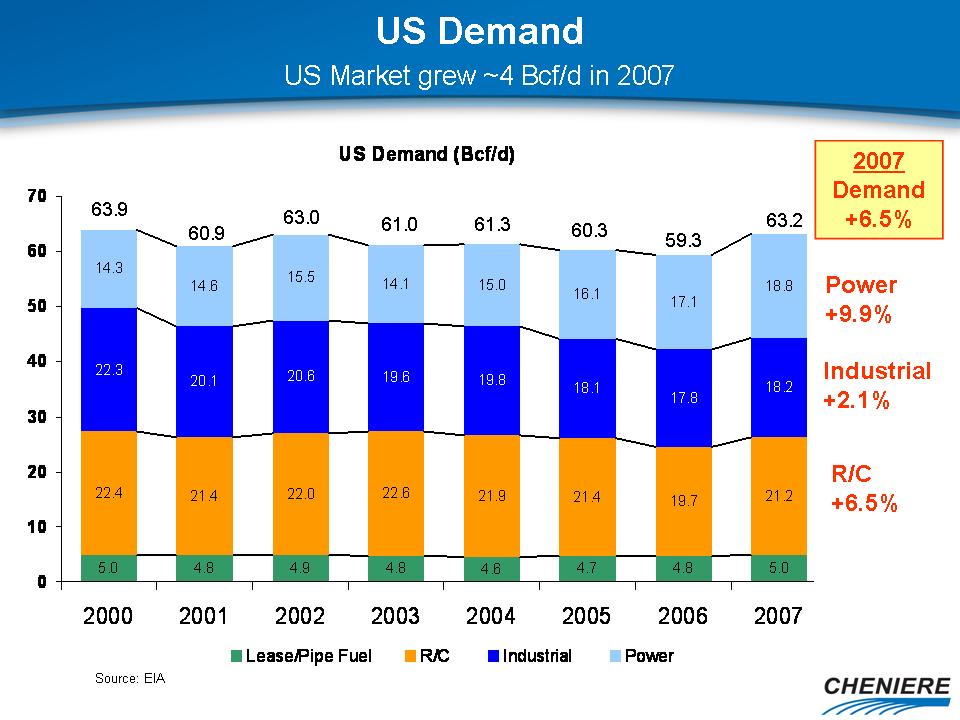
US Demand US Market grew ~4 Bcf/d in 2007 R/C +6.5% Industrial +2.1% Power+9.9% 63.2 59.3 61.3 60.3 61.0 60.9 63.0 63.9 2007 Demand +6.5% Source: EIA
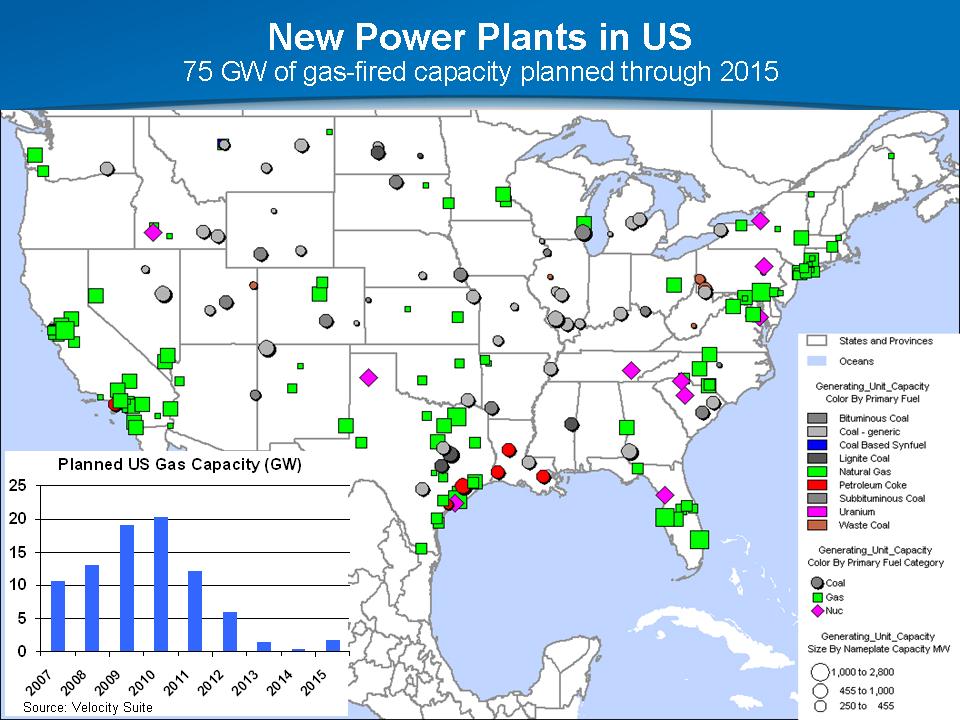
New Power Plants in US 75 GW of gas-fired capacity planned through 2015 Source: Velocity Suite
Conclusion Limitation on world-wide markets ability to absorb additional volumes, especially on a seasonal basis will validate value of spare capacity. Supply/Demand picture in the U.S. will exacerbate the issue and will lead U.S. to respond with price signals to meet power generation demand.