Slide:
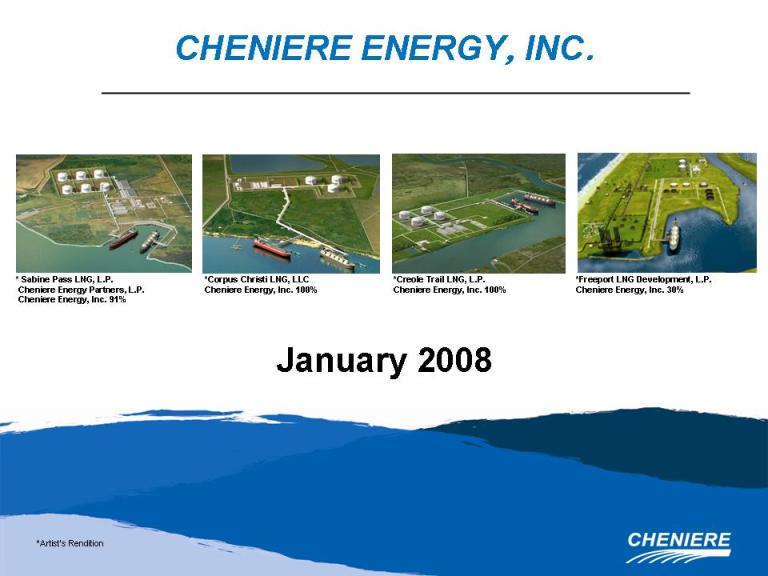
1 Title: January 2008 CHENIERE ENERGY, INC. (Gp:) *Corpus Christi
LNG, LLC Cheniere Energy, Inc. 100% *Artist’s
Rendition (Gp:) *Creole Trail LNG, L.P. Cheniere Energy, Inc.
100% *Freeport LNG Development, L.P. Cheniere
Energy, Inc. 30% * Sabine Pass LNG, L.P. Cheniere
Energy Partners, L.P. Cheniere Energy, Inc. 91%
Slide:
2 Body: This presentation contains certain statements that are, or may be
deemed
to be, “forward-looking statements” within the meaning of Section 27A of the
Securities Act and Section 21E of the Securities Exchange Act of 1934, as
amended, or the Exchange Act. All statements, other than statements
of historical facts, included herein are “forward-looking
statements.” Included among “forward-looking statements” are, among
other things:
statements
that we expect to commence or complete construction of each or any of our
proposed liquefied natural gas, or LNG, receiving
terminals
by certain dates, or at all; statements that we expect to
receive authorization from the Federal Energy Regulatory Commission, or FERC,
to
construct and operate proposed LNG receiving terminals by a certain
date, or at all; statements regarding future levels of domestic
natural gas production and consumption, or the future level of LNG imports
into
North America, or regarding projected future capacity of liquefaction
or regasification, liquifaction utilization or total monthly LNG trade
facilities worldwide, regardless of the source of such
information statements regarding any financing transactions or
arrangements, whether on the part of Cheniere or at the project
level; statements relating to the construction of our proposed
LNG receiving terminals, including statements concerning estimated costs,
and
the engagement of any EPC
contractor; statements regarding any Terminal Use
Agreement, or TUA, or other commercial arrangements presently contracted,
optioned, marketed or potential arrangements to be performed substantially
in
the future, including any cash distributions and revenues anticipated to
be
received; statements regarding the commercial terms and potential
revenues from activities described in this
presentation; statements regarding the commercial terms or
potential revenue from any arrangements which may arise from the marketing
of
uncommitted capacity from any of the terminals, including the
Creole Trail and Corpus Christi terminals which do not currently have
contractual commitments; statements regarding the commercial
terms or potential revenue from any arrangement relating to the proposed
contracting for excess or expansion capacity for the Sabine Pass LNG Terminal
or
the Indexed Purchase Agreement (“IPA”) or LNG spot purchase examples described
in this presentation; statements that our proposed LNG
receiving terminals, when completed, will have certain characteristics,
including amounts of regasification and storage capacities, a number of storage
tanks and docks and pipeline interconnections; statements
regarding Cheniere and Cheniere Marketing forecasts, and any potential revenues
and capital expenditures which may be derived from any of Cheniere business
groups; statements regarding Cheniere Pipeline Company,
and the capital expenditures and potential revenues related to this business
group;
statements regarding
our proposed LNG receiving terminals’ access to existing pipelines, and their
ability to obtain transportation capacity on existing pipelines; statements
regarding the Cheniere Southern Trail Pipeline, and its potential
business opportunities statements regarding possible expansions
of the currently projected size of any of our proposed LNG receiving
terminals; statements regarding the payment by Cheniere Energy
Partners, L.P. of cash distributions; statements regarding our
business strategy, our business plan or any other plans, forecasts, examples,
models, or objectives; any or all of which are subject to
change; statements regarding estimated corporate overhead
expenses; and any other statements that relate to
non-historical information.These forward-looking statements are often identified
by the use of terms and phrases such as “achieve,” “anticipate,” “believe,”
“estimate,” “example,” “expect,” “forecast,” “opportunities,” “plan,”
“potential,” “project,” “propose,” “subject to,” and similar terms and
phrases. Although we believe that the expectations reflected in these
forward-looking statements are reasonable, they do involve assumptions, risks
and uncertainties, and these expectations may prove to be
incorrect. You should not place undue reliance on these
forward-looking statements, which speak only as of the date of this
presentation. Our actual results could differ materially from those
anticipated in these forward-looking statements as a result of a variety
of
factors, including those discussed in “Risk Factors” in the Cheniere Energy,
Inc. Annual Report on Form 10-K for the year ended December 31, 2006, which
are
incorporated by reference into this presentation. All forward-looking
statements attributable to us or persons acting on our behalf are expressly
qualified in their entirety by these ”Risk Factors”. These
forward-looking statements are made as of the date of this presentation,
and we
undertake no obligation to publicly update or revise any forward-looking
statements. Safe Harbor Act
Slide:
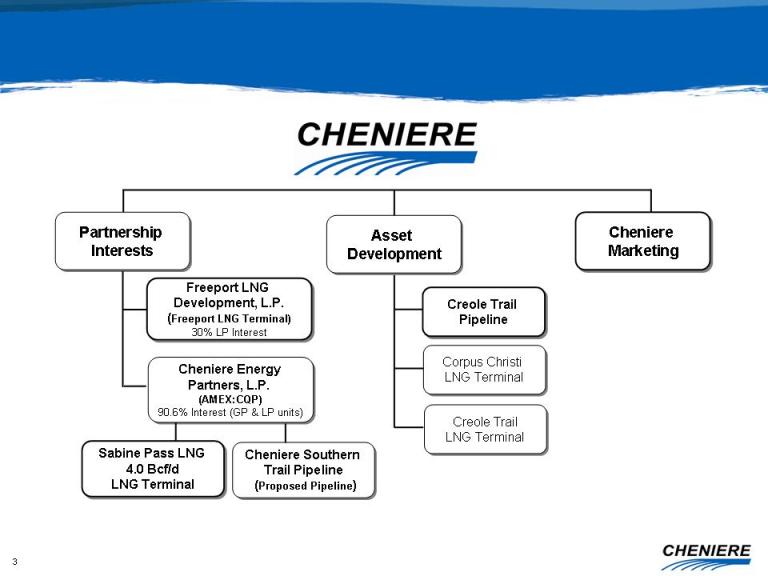
3 Cheniere
Marketing Asset Development Partnership Interests Sabine
Pass LNG 4.0 Bcf/d LNG Terminal Cheniere
Energy Partners, L.P. (AMEX:CQP) 90.6% Interest (GP &
LP units) Creole Trail LNG Terminal Creole
Trail Pipeline Corpus Christi LNG
Terminal Freeport LNG Development, L.P.(Freeport LNG Terminal) 30% LP
Interest Cheniere Southern Trail
Pipeline (Proposed Pipeline)
Slide:
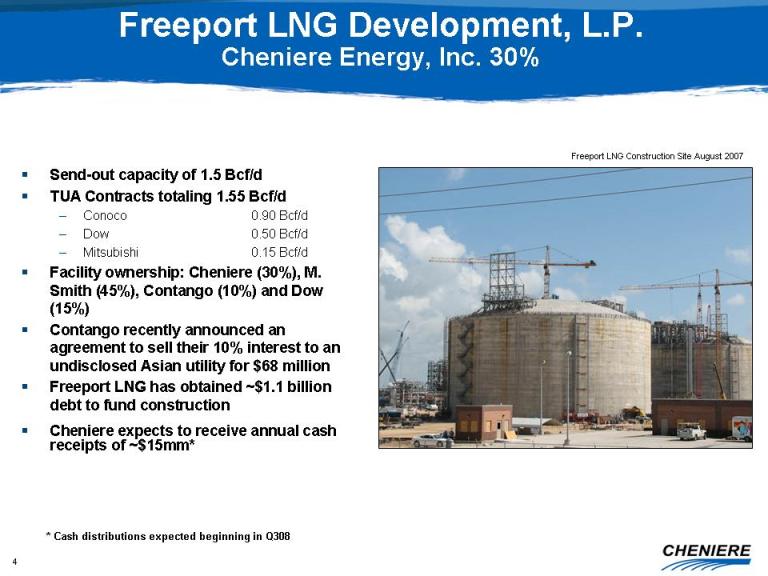
4 Title: Freeport LNG Development, L.P. Cheniere Energy, Inc.
30% Freeport LNG Construction Site August 2007 Body: Send-out
capacity of 1.5 Bcf/d TUA Contracts totaling 1.55 Bcf/d Conoco 0.90
Bcf/d Dow 0.50 Bcf/d Mitsubishi 0.15 Bcf/d Facility
ownership: Cheniere (30%), M. Smith (45%), Contango (10%) and Dow
(15%) Contango recently announced an agreement to sell their 10%
interest to an undisclosed Asian utility for $68 million Freeport LNG has
obtained ~$1.1 billion debt to fund construction Cheniere expects to receive
annual cash receipts of ~$15mm* * Cash distributions expected beginning in
Q308
Slide:
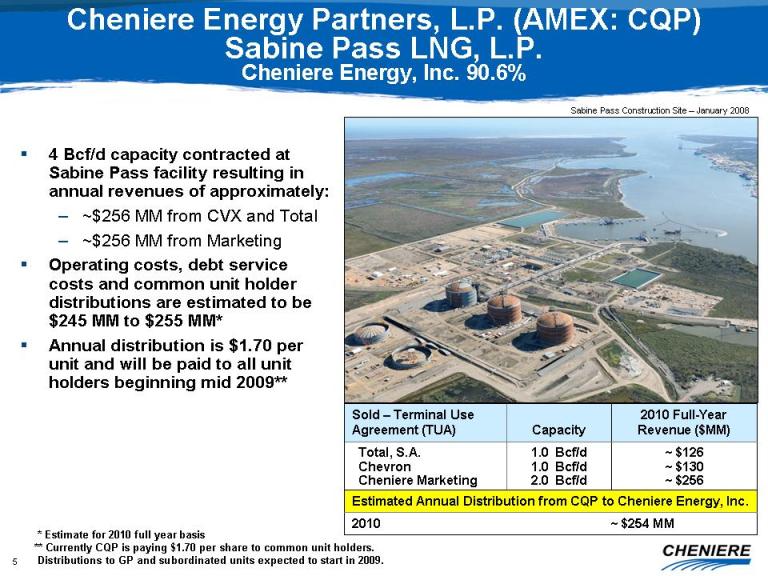
5 Title: Cheniere Energy Partners, L.P. (AMEX: CQP) Sabine Pass LNG, L.P.
Cheniere Energy, Inc. 90.6% Sabine Pass Construction Site – January
2008 Body: 4 Bcf/d capacity contracted at Sabine Pass facility resulting
in
annual revenues of approximately: ~$256 MM from CVX and Total ~$256 MM from
Marketing Operating costs, debt service costs and common unit holder
distributions are estimated to be $245 MM to $255 MM* Annual distribution
is
$1.70 per unit and will be paid to all unit holders beginning mid
2009** * Estimate for 2010 full year basis ** Currently CQP is
paying $1.70 per share to common unit holders. Distributions to GP
and subordinated units expected to start in 2009.
Slide:
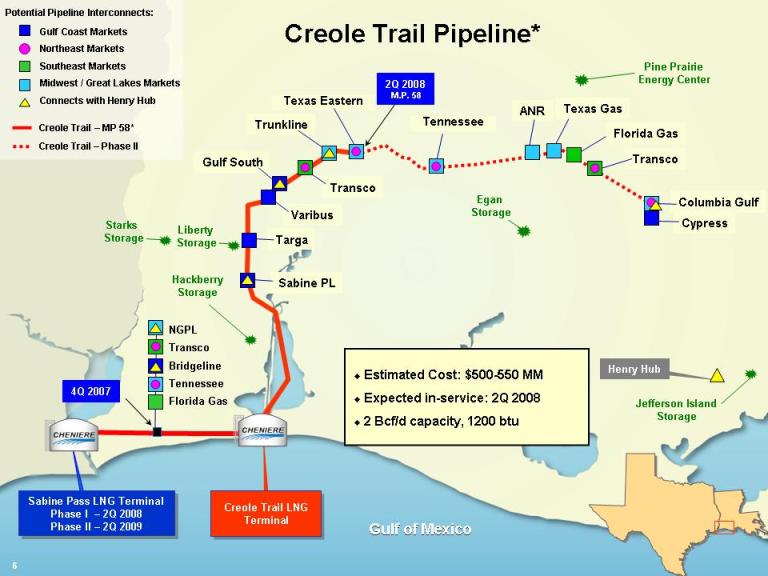
6 Sabine PL Targa Transco Gulf
South Trunkline Jefferson Island Storage Sabine
Pass LNG Terminal Phase I – 2Q 2008 Phase II – 2Q
2009 Creole Trail LNG Terminal Henry
Hub Varibus NGPL Transco Bridgeline Tennessee Florida
Gas Creole Trail Pipeline* Liberty
Storage Starks Storage Hackberry Storage Texas
Eastern Gulf Coast Markets Northeast Markets Southeast Markets
Midwest / Great Lakes Markets Connects with Henry Hub Gulf of
Mexico 4Q 2007 ANR Texas
Gas Transco Florida Gas Columbia
Gulf Cypress Egan Storage Pine
Prairie Energy Center Tennessee 2Q 2008 M.P.
58 Creole Trail – MP 58* Creole Trail – Phase
II 6 Potential Pipeline
Interconnects: Estimated Cost: $500-550
MM Expected in-service: 2Q 2008 2 Bcf/d capacity, 1200
btu
Slide:
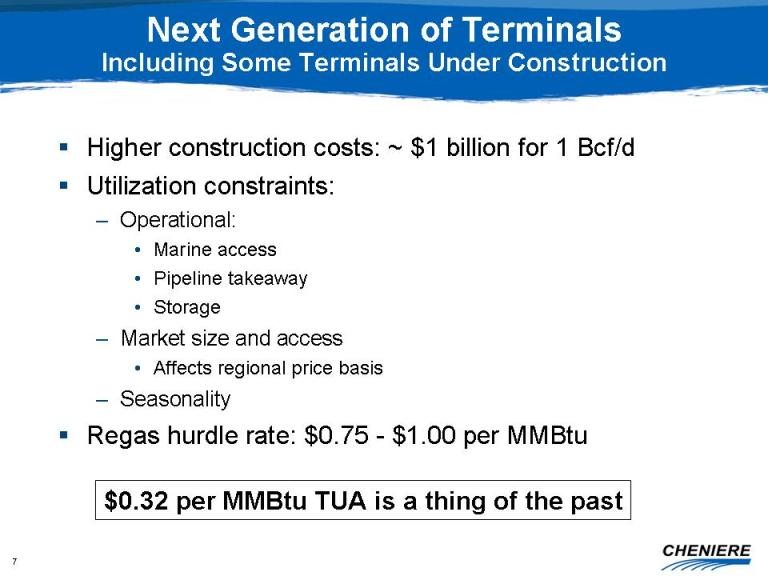
7 Title: Next Generation of Terminals Including Some Terminals Under
Construction Body: Higher construction costs: ~ $1 billion for 1 Bcf/d
Utilization constraints: Operational: Marine access Pipeline takeaway Storage
Market size and access Affects regional price basis Seasonality Regas hurdle
rate: $0.75 - $1.00 per MMBtu $0.32 per MMBtu TUA is a thing of the
past
Slide:
8 Title: Cheniere Energy Partners Growth Projects Body: Fuel Efficiency Projects
at Sabine Pass LNG Maximizes plant fuel efficiency using waste heat recovery
and
ambient air technology Customers charged 2% fuel retainage fee Projects expected
to reduce fuel usage by 50% to 75% Actual savings depends on gas prices and
plant throughput Developed over next few years, expected in-service 2010
– 2011
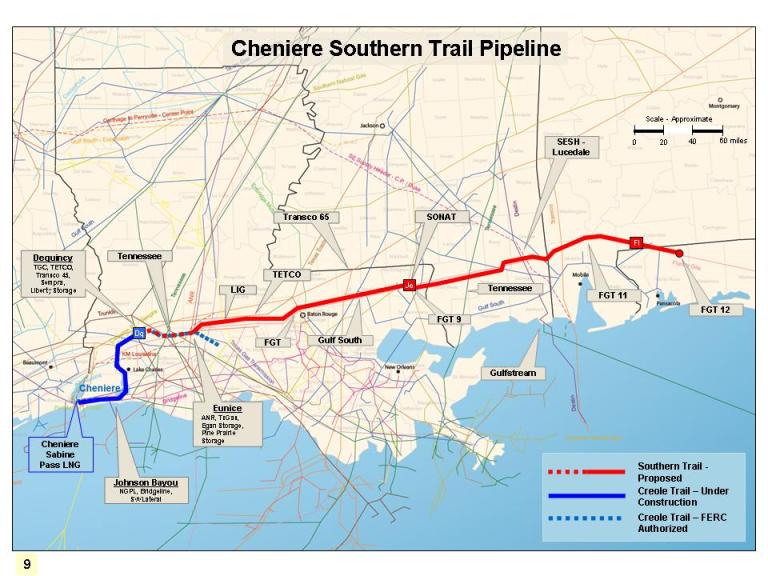
Expected funding from excess cash and financing Cheniere Southern Trail Pipeline
Proposed pipeline extending from Louisiana to Florida
Slide:
9 Dq SESH - Lucedale SONAT Gulf
South FGT 11 Tennessee Dequincy TGC, TETCO,
Transco 45, Sempra, Liberty Storage Cheniere Sabine Pass
LNG Johnson Bayou NGPL, Bridgeline,
SWLateral TETCO FGT Tennessee (Gp:) Scale
- Approximate (Gp:) 0 (Gp:) 40 (Gp:) 60 miles (Gp:) 20 FGT
9 LIG Cheniere Southern Trail
Pipeline Gulfstream Eunice ANR, TxGas, Egan Storage, Pine
Prairie Storage Transco 65 Southern Trail -
Proposed Creole Trail – Under Construction Creole Trail –
FERC Authorized Je Fl FGT
12 9
Slide:
10 Value Drivers Future
Growth in MLP Assets Corpus Christi LNG terminal Creole
Trail LNG terminal Future Acquisitions Cheniere
Marketing Validates value of subordinated units Intrinsic
value of Marketing operations
Slide:
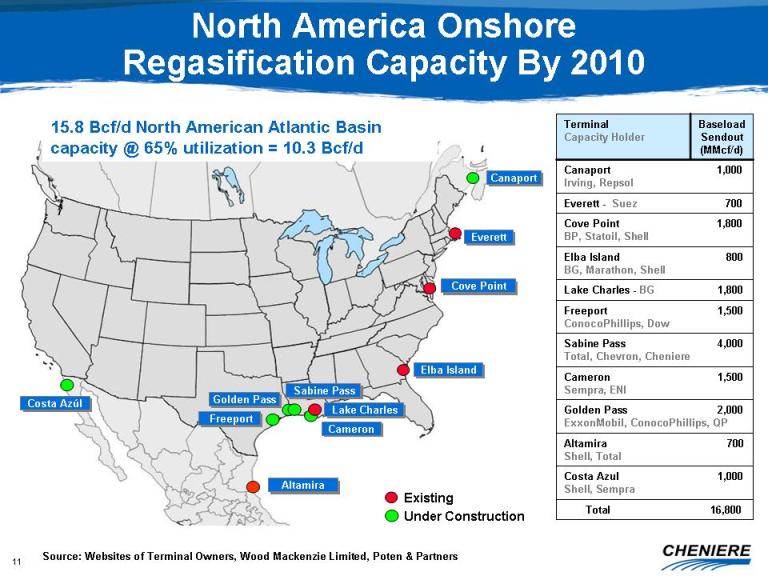
11 Everett Cove Point Elba
Island Lake Charles Sabine
Pass Freeport Golden
Pass Cameron Costa
Azúl Canaport Existing Under
Construction Altamira Source: Websites of Terminal Owners,
Wood Mackenzie Limited, Poten & Partners Title: North America Onshore
Regasification Capacity By 2010 15.8 Bcf/d North American Atlantic
Basin capacity @ 65% utilization = 10.3 Bcf/d
Slide:
12 LNG Fundamentals Value of Marketing
Slide:
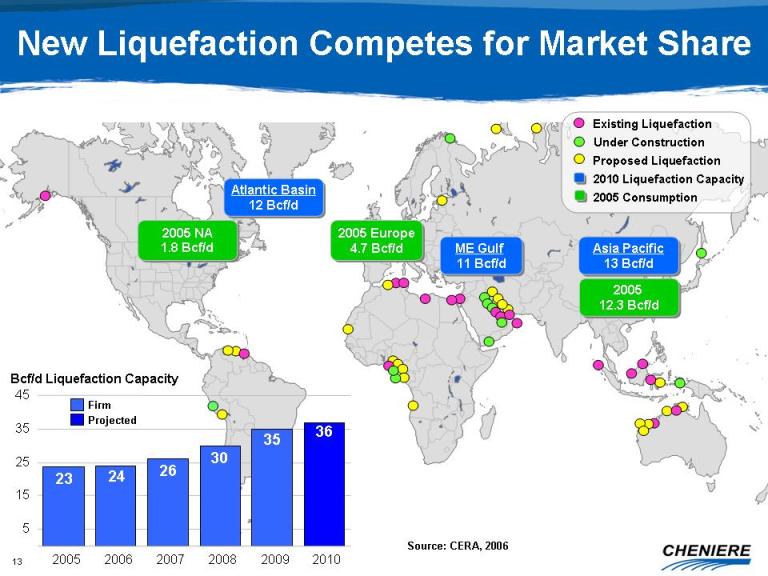
13 Title: New Liquefaction Competes for Market Share Source: CERA,
2006 Atlantic Basin 12 Bcf/d ME Gulf 11
Bcf/d Asia Pacific 13 Bcf/d 2005 Europe 4.7
Bcf/d 2005 12.3 Bcf/d 2005 NA 1.8 Bcf/d (Gp:)
2010 Liquefaction Capacity (Gp:) 2005
Consumption 5 15 25 35 45 36 23 24 26 30 35 Bcf/d
Liquefaction Capacity Firm Existing
Liquefaction Under Construction Proposed
Liquefaction Projected 2005 2006 2007 2008 2009 2010
Slide:
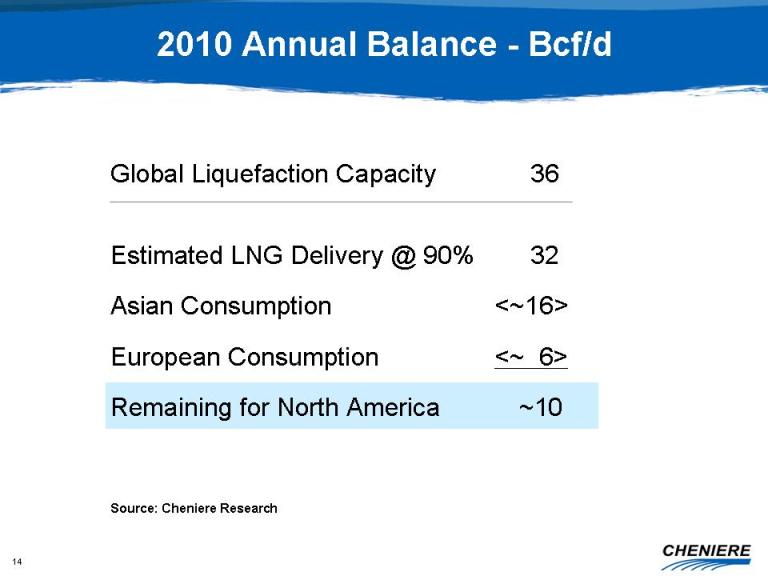
14 Title: 2010 Annual Balance - Bcf/d Global Liquefaction
Capacity 36 Estimated LNG Delivery @
90% 32 Asian
Consumption <~16> European
Consumption <~ 6> Remaining for North
America ~10 Source: Cheniere
Research
Slide:
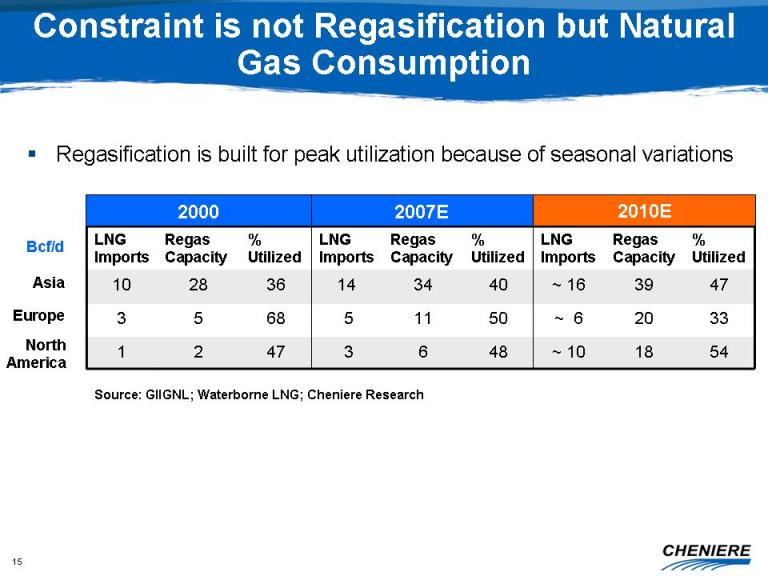
15
Title: Constraint is not Regasification but Natural Gas
Consumption Source: GIIGNL; Waterborne LNG; Cheniere
Research Regasification is built for peak utilization because
of seasonal
variations Bcf/d Asia Europe North
America
Slide:
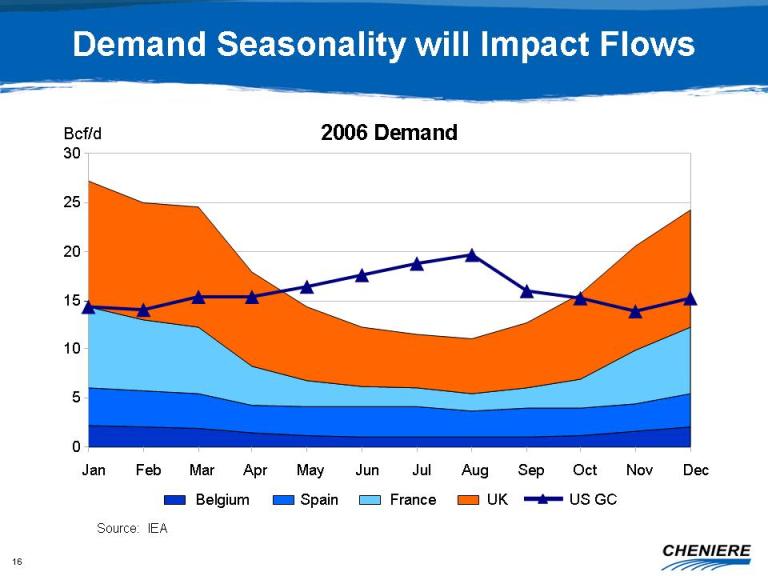
16
Title: Demand Seasonality will Impact
Flows Source: IEA 2006
Demand 0 5 10 15 20 25 30 Jan Feb Mar Apr May Jun Jul Aug Sep Oct Nov Dec Belgium Spain France UK US
GC Bcf/d
Slide:
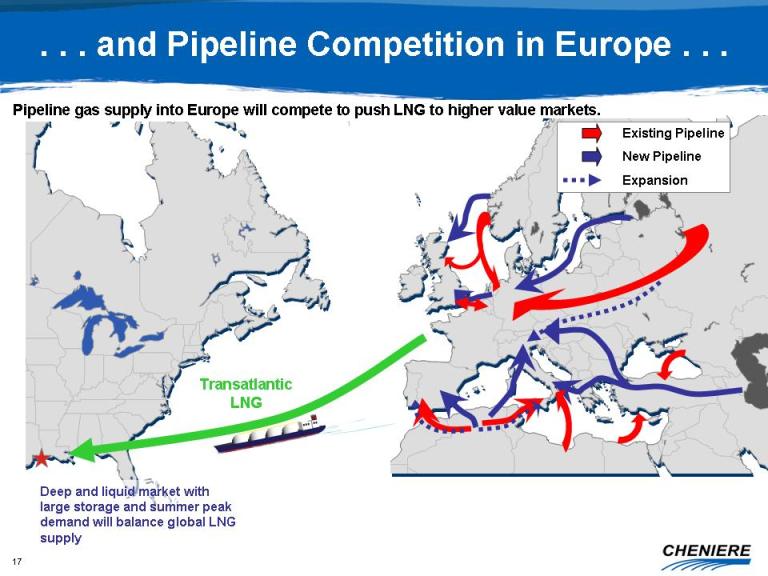
17
Title: . . . and Pipeline Competition in Europe . .
. Transatlantic LNG Deep and liquid market with
large storage and summer peak demand will balance global LNG
supply Pipeline gas supply into Europe will compete to push LNG to
higher value markets. (Gp:) New Pipeline (Gp:) Existing Pipeline (Gp:)
Expansion
Slide:
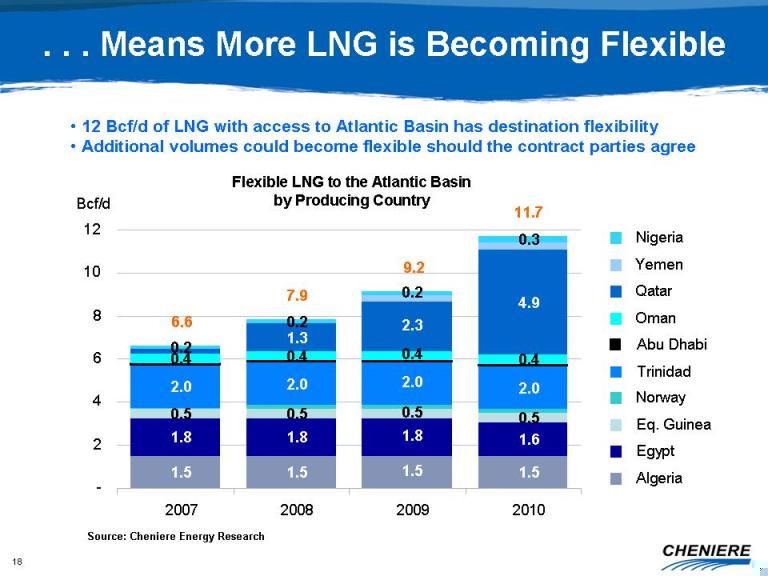
18 1.5 1.5 1.5 1.5 1.8 1.8 1.8 1.6 0.5 0.5 0.5 0.5 2.0 2.0 2.0 2.0 0.4 0.4 0.4 0.4 1.3 2.3 4.9 0.2 0.2 0.2 0.3 9.2 11.7 7.9 6.6 - 2 4 6 8 10 12 2007 2008 2009 2010 Bcf/d Nigeria Yemen Qatar Oman Abu
Dhabi Trinidad Norway Eq.
Guinea Egypt Algeria Title: . . . Means More LNG is
Becoming Flexible Flexible LNG to the Atlantic
Basin by Producing Country 12 Bcf/d of LNG
with access to Atlantic Basin has destination flexibility Additional
volumes could become flexible should the contract parties
agree Source: Cheniere Energy Research
Slide:
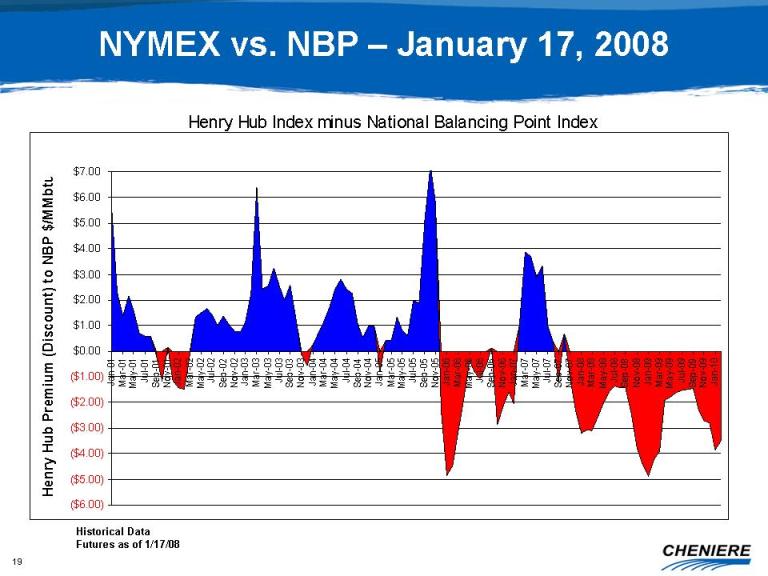
19
Title: NYMEX vs. NBP – January 17, 2008 Historical Data Futures as of
1/17/08
Slide:
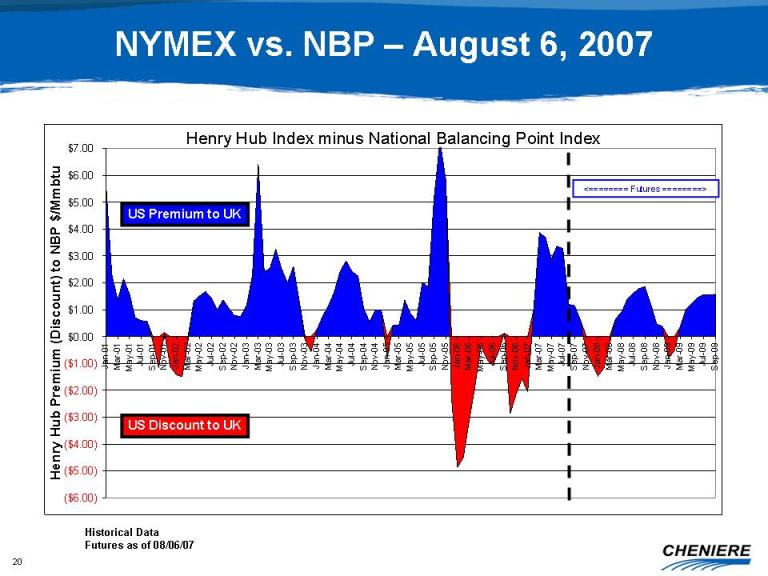
20
Title: NYMEX vs. NBP – August 6, 2007 Historical Data Futures as of
08/06/07
Slide:
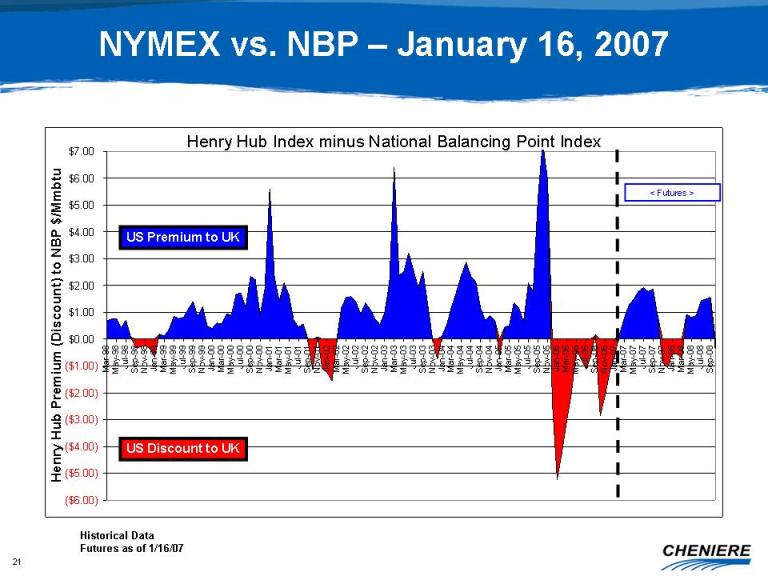
21
Title: NYMEX vs. NBP – January 16, 2007 Historical Data Futures as of
1/16/07
Slide:
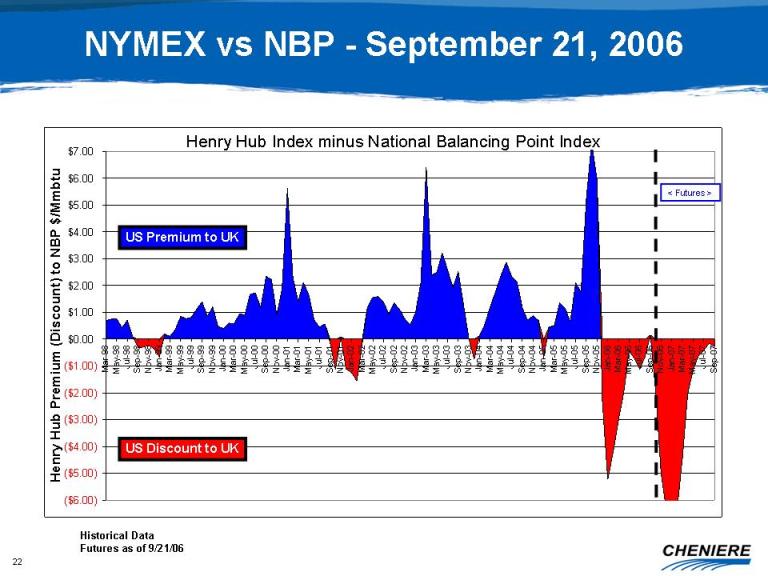
22
Title: NYMEX vs NBP - September 21, 2006 Historical Data Futures as
of 9/21/06
Slide:
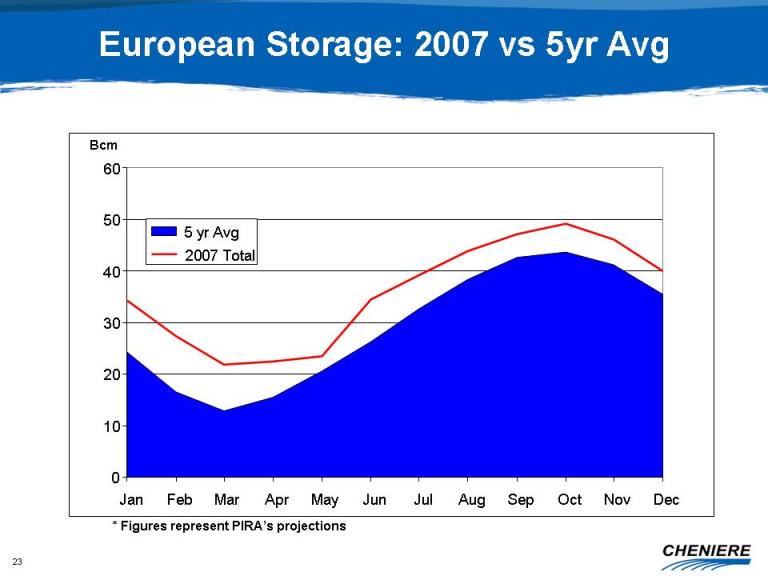
23
Title: European Storage: 2007 vs 5yr Avg * Figures represent PIRA’s
projections 0 10 20 30 40 50 60 Jan Feb Mar Apr May Jun Jul Aug Sep Oct Nov Dec Bcm 5
yr Avg 2007 Total
Slide:
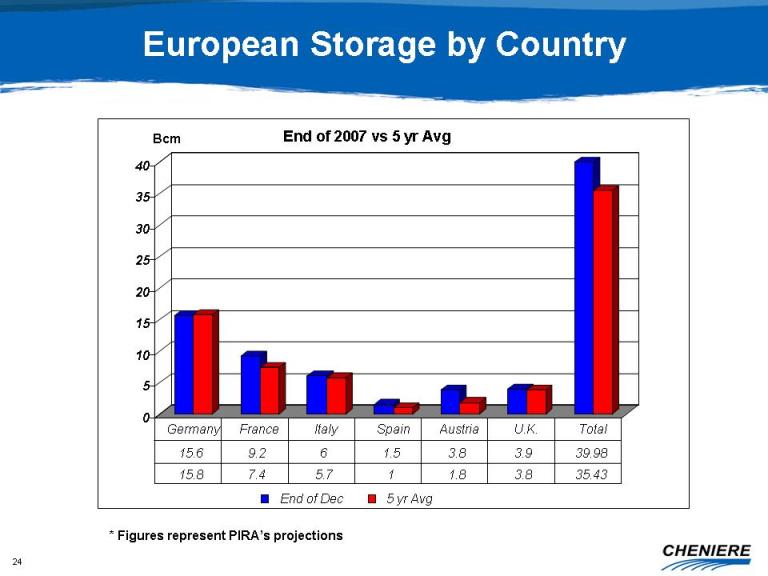
24
Title: European Storage by Country * Figures represent PIRA’s
projections 0 5 10 15 20 25 30 35 40 Bcm End
of 2007 vs 5 yr Avg End of
Dec 15.6 9.2 6 1.5 3.8 3.9 39.98 5
yr
Avg 15.8 7.4 5.7 1 1.8 3.8 35.43 Germany France Italy Spain Austria U.K. Total
Slide:
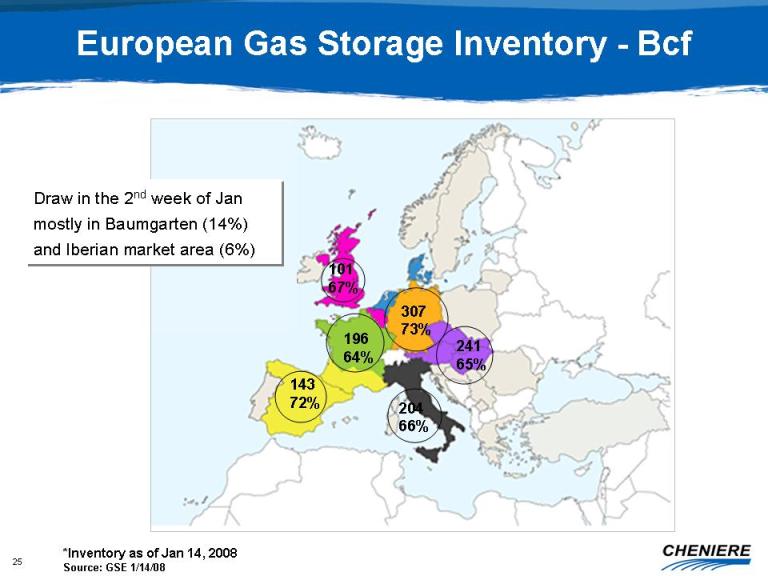
25 307 73% 143 72% 196 64% 101
67% 204 66% 241 65% Draw in the 2nd week of Jan
mostly in Baumgarten (14%) and Iberian market area (6%) Title: European Gas
Storage Inventory - Bcf *Inventory as of Jan 14, 2008 Source: GSE
1/14/08
Slide:
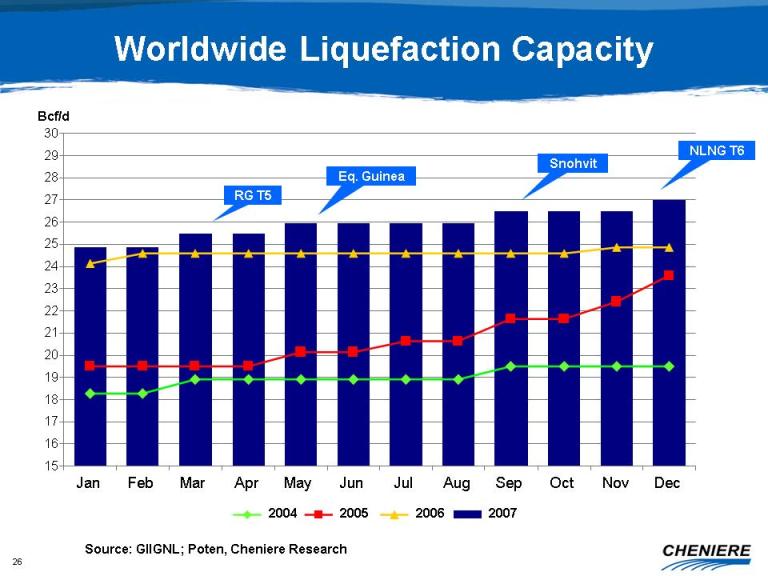
26
Title: Worldwide Liquefaction Capacity Source: GIIGNL; Poten,
Cheniere
Research 15 16 17 18 19 20 21 22 23 24 25 26 27 28 29 30 Jan Feb Mar Apr May Jun Jul Aug Sep Oct Nov Dec 2007 2004 2005 2006 NLNG
T6 Snohvit RG T5 Eq.
Guinea Bcf/d
Slide:
27
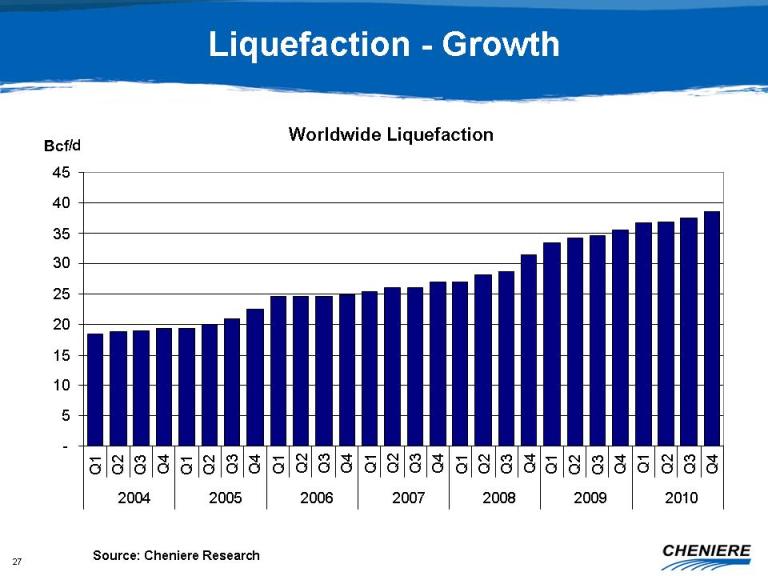
Title: Liquefaction - Growth (Gp:) Worldwide
Liquefaction (Gp:) - (Gp:) 5 (Gp:) 10 (Gp:) 15 (Gp:) 20 (Gp:) 25
(Gp:) 30 (Gp:) 35 (Gp:) 40 (Gp:) 45 (Gp:) Q1 (Gp:) Q2 (Gp:) Q3 (Gp:) Q4 (Gp:)
Q1
(Gp:) Q2 (Gp:) Q3 (Gp:) Q4 (Gp:) Q1 (Gp:) Q2 (Gp:) Q3 (Gp:) Q4 (Gp:) Q1 (Gp:)
Q2
(Gp:) Q3 (Gp:) Q4 (Gp:) Q1 (Gp:) Q2 (Gp:) Q3 (Gp:) Q4 (Gp:) Q1 (Gp:) Q2 (Gp:)
Q3
(Gp:) Q4 (Gp:) Q1 (Gp:) Q2 (Gp:) Q3 (Gp:) Q4 (Gp:) 2004 (Gp:) 2005 (Gp:)
2006
(Gp:) 2007 (Gp:) 2008 (Gp:) 2009 (Gp:) 2010 (Gp:) Bcf/d Source:
Cheniere Research
Slide:
28
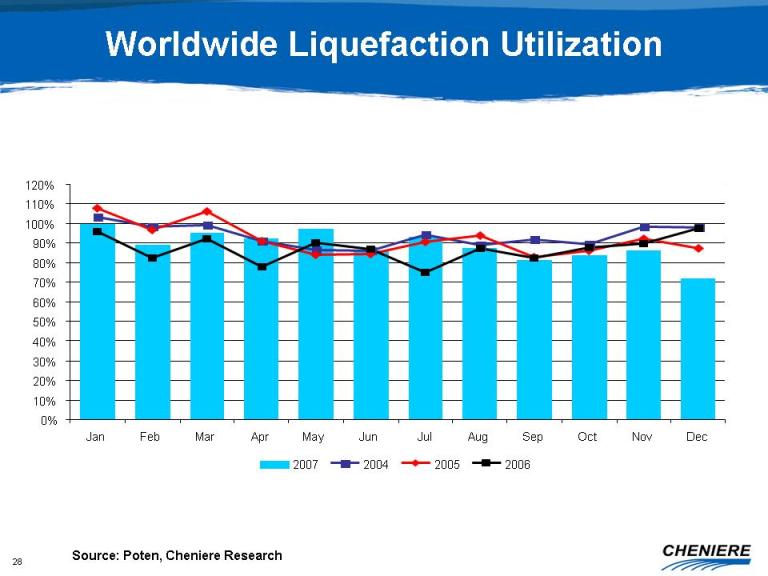
Title: Worldwide Liquefaction Utilization Source: Poten, Cheniere
Research (Gp:) 0% (Gp:) 10% (Gp:) 20% (Gp:) 30% (Gp:) 40% (Gp:) 50%
(Gp:) 60% (Gp:) 70% (Gp:) 80% (Gp:) 90% (Gp:) 100% (Gp:) 110% (Gp:) 120%
(Gp:)
Jan (Gp:) Feb (Gp:) Mar (Gp:) Apr (Gp:) May (Gp:) Jun (Gp:) Jul (Gp:) Aug
(Gp:)
Sep (Gp:) Oct (Gp:) Nov (Gp:) Dec (Gp:) 2007 (Gp:) 2004 (Gp:) 2005 (Gp:)
2006
Slide:
29
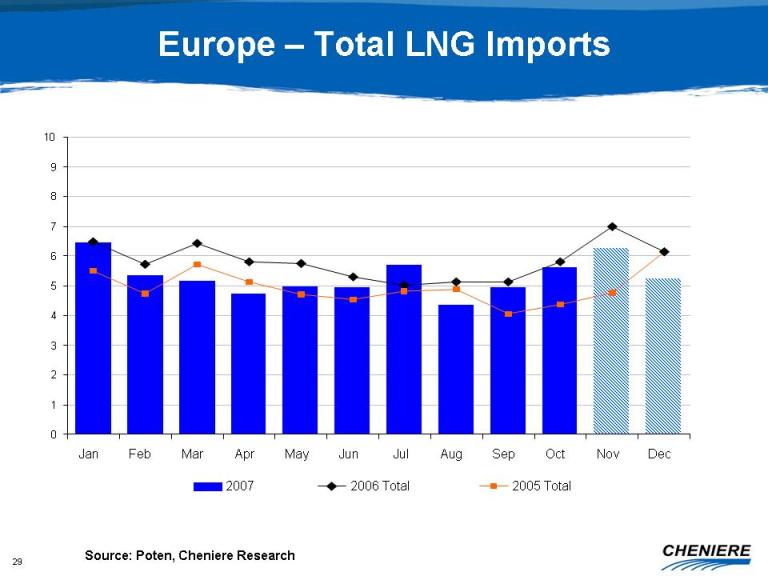
Title: Europe – Total LNG Imports Source: Poten, Cheniere
Research (Gp:) 0 (Gp:) 1 (Gp:) 2 (Gp:) 3 (Gp:) 4 (Gp:) 5 (Gp:) 6
(Gp:) 7 (Gp:) 8 (Gp:) 9 (Gp:) 10
(Gp:) Jan (Gp:) Feb (Gp:) Mar (Gp:) Apr (Gp:) May (Gp:) Jun (Gp:) Jul (Gp:) Aug (Gp:) Sep (Gp:) Oct (Gp:) Nov (Gp:) Dec (Gp:)
2007 (Gp:) 2006 Total (Gp:) 2005 Total
Slide:
30
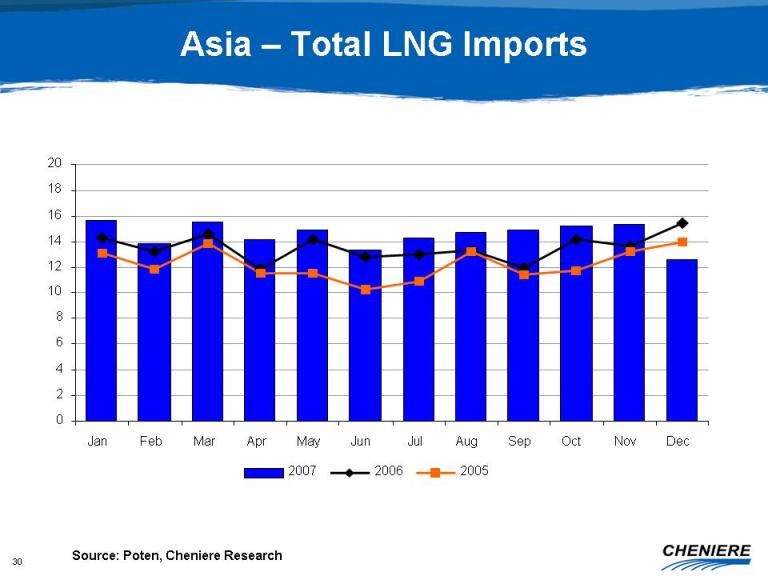
Title: Asia – Total LNG Imports Source: Poten, Cheniere
Research (Gp:) 0 (Gp:) 2 (Gp:) 4 (Gp:) 6 (Gp:) 8 (Gp:) 10 (Gp:) 12
(Gp:) 14 (Gp:) 16 (Gp:) 18 (Gp:) 20 (Gp:) Jan (Gp:)
Feb (Gp:) Mar (Gp:) Apr (Gp:)
May (Gp:) Jun (Gp:) Jul (Gp:)
Aug (Gp:) Sep (Gp:) Oct (Gp:)
Nov (Gp:) Dec (Gp:) 2007 (Gp:) 2006 (Gp:) 2005
Slide:
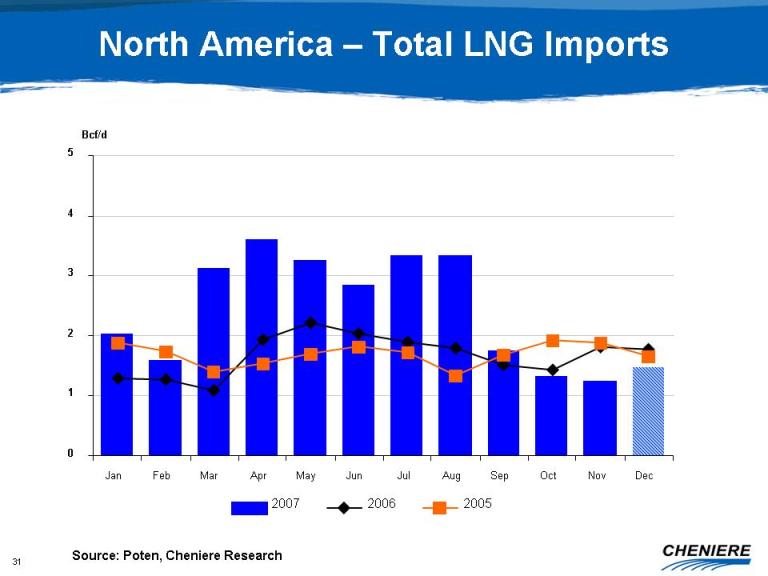
31
Title: North America – Total LNG Imports Source: Poten, Cheniere
Research (Gp:) 0 (Gp:) 1 (Gp:) 2 (Gp:) 3 (Gp:) 4 (Gp:) 5 (Gp:) Jan
(Gp:) Feb (Gp:) Mar (Gp:) Apr (Gp:) May (Gp:) Jun (Gp:) Jul (Gp:) Aug (Gp:)
Sep
(Gp:) Oct (Gp:) Nov (Gp:) Dec (Gp:) Bcf/d (Gp:) 2007 (Gp:) 2006 (Gp:)
2005
Slide:
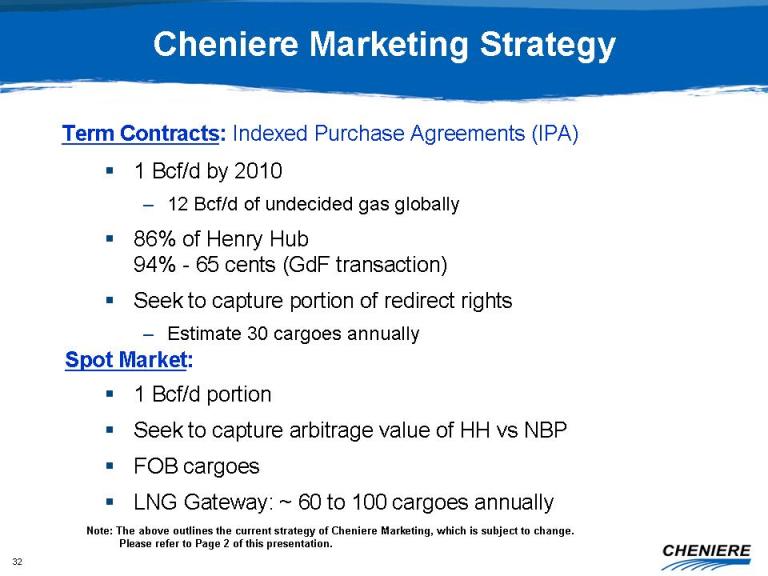
32 1 Bcf/d by 2010 12 Bcf/d of undecided gas globally 86% of Henry
Hub
94%
- 65
cents (GdF transaction) Seek to capture portion of redirect
rights Estimate 30 cargoes annually
Title:
Cheniere Marketing Strategy Term Contracts: Indexed Purchase
Agreements (IPA) Spot Market: 1 Bcf/d portion Seek to
capture arbitrage value of HH vs NBP FOB cargoes LNG Gateway: ~ 60 to 100
cargoes annually Note: The above outlines the current strategy
of Cheniere Marketing, which is subject to
change. Please
refer to Page 2 of this presentation.
Slide:
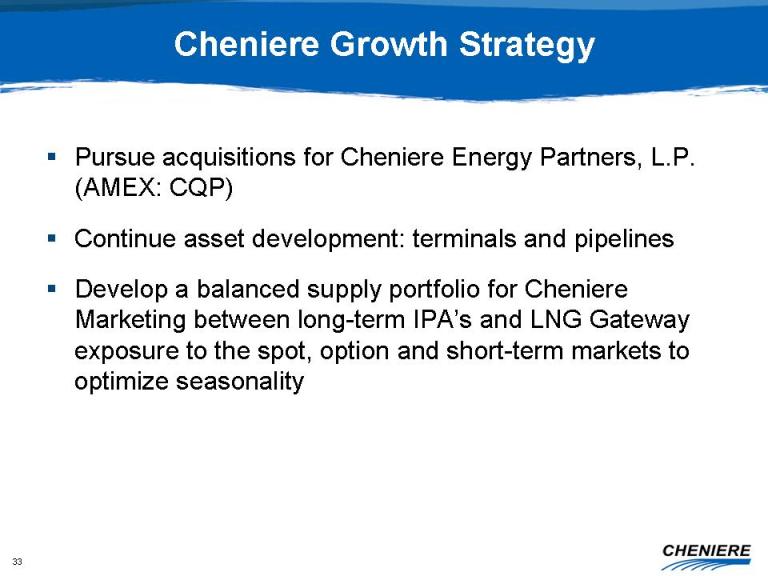
33
Title: Cheniere Growth Strategy Body: Pursue acquisitions for Cheniere Energy
Partners, L.P. (AMEX: CQP) Continue asset development: terminals and pipelines
Develop a balanced supply portfolio for Cheniere Marketing between long-term
IPA’s and LNG Gateway exposure to the spot, option and short-term markets to
optimize seasonality
Slide:
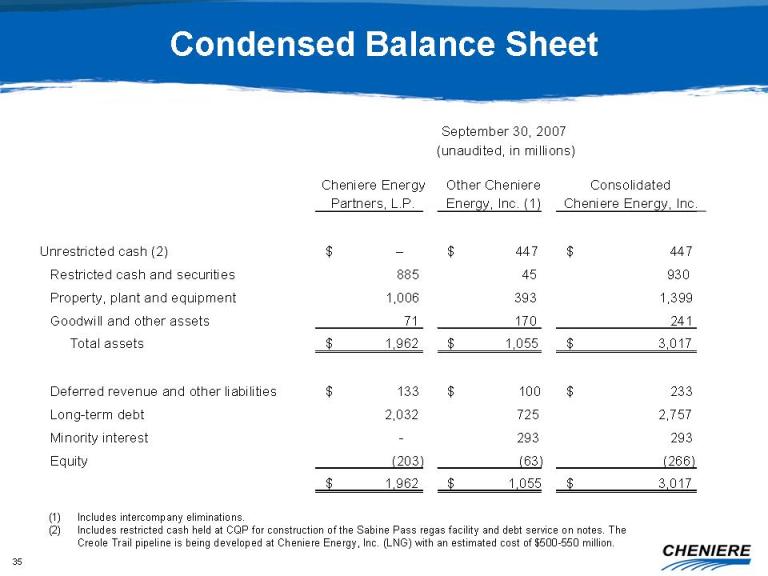
35
Title: Condensed Balance Sheet Cheniere Energy Other
Cheniere Consolidated Partners, L.P. Energy,
Inc. (1) Cheniere Energy, Inc. Unrestricted cash
(2) - $ - 447 $ 447 $
Restricted cash and
securities 885 45 930 Property,
plant and
equipment 1,006 393 1,399 Goodwill
and other
assets 71 170 241 Total
assets 1,962 $ 1,055 $ 3,017 $ Deferred
revenue and other
liabilities 133 $ 100 $ 233 $ Long-term
debt 2,032 725 2,757 Minority
interest - 293 293 Equity (203) (63) (266) 1,962 $ 1,055 $ 3,017 $ Includes
intercompany eliminations. Includes restricted cash held at CQP for construction
of the Sabine Pass regas facility and debt service on notes. The Creole Trail
pipeline is being developed at Cheniere Energy, Inc. (LNG) with an estimated
cost of $500-550 million. September 30, 2007 (unaudited,
in millions)