Exhibit
99.1
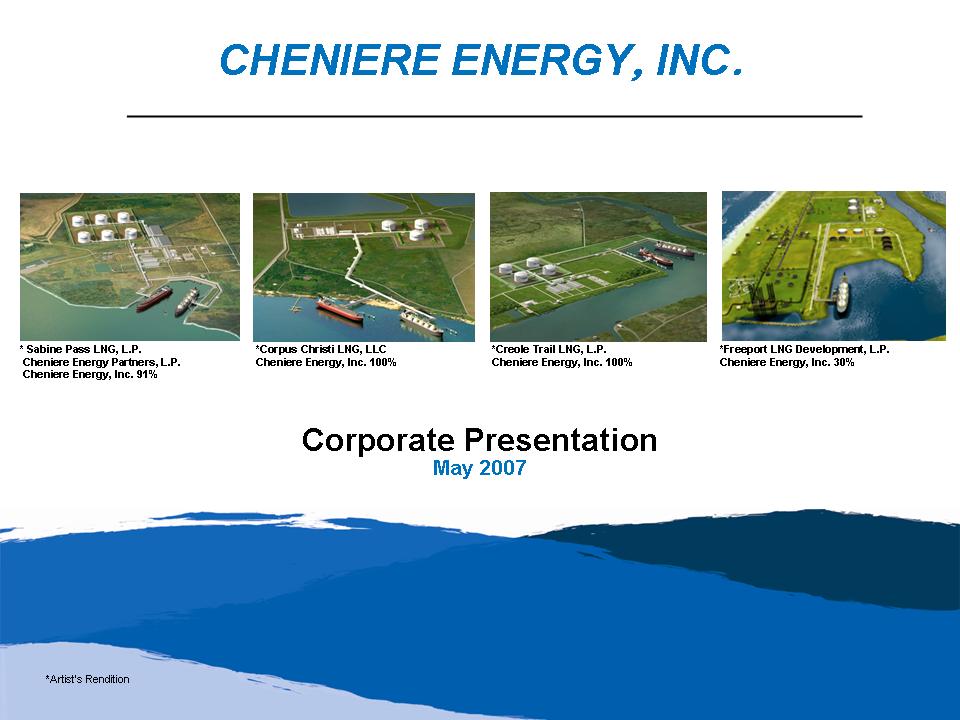
Corporate
Presentation May 2007 CHENIERE ENERGY ,INC . *Corpus Christi LNG, LLC Cheniere
Energy, Inc. 100% *Artist’s Rendition *Creole Trail LNG, L.P. Cheniere Energy,
Inc. 100% *Freeport LNG Development, L.P. Cheniere Energy, Inc. 30% * Sabine
Pass LNG, L.P. Cheniere Energy Partners, L.P. Cheniere Energy, Inc.
91%
This
presentation contains certain statements that are, or may be deemed to be,
“forward-looking statements” within the meaning of Section 27A of the Securities
Act and Section 21E of the Securities Exchange Act of 1934, as amended, or
the
Exchange Act. All statements, other than statements of historical facts,
included herein are “forwardlooking statements.” Included among “forward-looking
statements” are, among other things: ?? statements that we expect to commence or
complete construction of each or any of our proposed liquefied natural gas,
or
LNG, receiving terminals by certain dates, or at all; ?? statements that
we
expect to receive authorization from the Federal Energy Regulatory Commission,
or FERC, to construct and operate proposed LNG receiving terminals by a certain
date, or at all; ?? statements regarding future levels of domestic natural
gas
production and consumption, or the future level of LNG imports into North
America, or regarding projected future capacity of liquefaction or
regasification facilities worldwide regardless of the source of such
information; ?? statements regarding any financing transactions or arrangements,
whether on the part of Cheniere or at the project level; ?? statements relating
to the construction of our proposed LNG receiving terminals, including
statements concerning estimated costs, and the engagement of any EPC contractor;
?? statements regarding any Terminal Use Agreement, or TUA, or other commercial
arrangements presently contracted, optioned, marketed or potential arrangements
to be performed substantially in the future, including any cash distributions
and revenues anticipated to be received; statements regarding the commercial
terms and potential revenues from activities described in this presentation;
??
statements regarding the commercial terms or potential revenue from any
arrangements which may arise from the marketing of uncommitted capacity from
any
of the terminals, including the Creole Trail and Corpus Christi terminals
which
do not currently have contractual commitments; ?? statements regarding the
commercial terms or potential revenue from any arrangement relating to the
proposed contracting for excess or expansion capacity for the Sabine Pass
LNG
Terminal or the Indexed Purchase Agreement (“IPA”) or LNG spot purchase examples
described in this presentation; ?? statements that our proposed LNG receiving
terminals, when completed, will have certain characteristics, including amounts
of regasification and storage capacities, a number of storage tanks and docks
and pipeline interconnections; ?? statements regarding Cheniere and Cheniere
Marketing forecasts, and any potential revenues and capital expenditures
which
may be derived from any of Cheniere business groups; ?? statements regarding
Cheniere Pipeline Company, and the capital expenditures and potential revenues
related to this business group; statements regarding our proposed LNG receiving
terminals’ access to existing pipelines, and their ability to obtain
transportation capacity on existing pipelines; ?? statements regarding possible
expansions of the currently projected size of any of our proposed LNG receiving
terminals; ?? statements regarding the payment by Cheniere Energy Partners,
L.P.
of cash distributions; ?? statements regarding our business strategy, our
business plan or any other plans, forecasts, examples, models, forecasts
or
objectives; any or all of which are subject to change; ?? statements regarding
estimated corporate overhead expenses; and ?? any other statements that relate
to non-historical information. These forward-looking statements are often
identified by the use of terms and phrases such as “achieve,” “anticipate,”
“believe,” “estimate,” “example,” “expect,” “forecast,” “opportunities,” “plan,”
“potential,” “project,” “propose,” “subject to,” and similar terms and phrases.
Although we believe that the expectations reflected in these forwardlooking
statements are reasonable, they do involve assumptions, risks and uncertainties,
and these expectations may prove to be incorrect. You should not place undue
reliance on these forward-looking statements, which speak only as of the
date of
this presentation. Our actual results could differ materially from those
anticipated in these forward-looking statements as a result of a variety
of
factors, including those discussed in “Risk Factors” in the Cheniere Energy,
Inc. Annual Report on Form 10-K for the year ended December 31, 2006, which
are
incorporated by reference into this presentation. All forward-looking statements
attributable to us or persons acting on our behalf are expressly qualified
in
their entirety by these ”Risk Factors”. These forward-looking statements are
made as of the date of this presentation, and we undertake no obligation
to
publicly update or revise any forward-looking statements. Safe Harbor Act
3
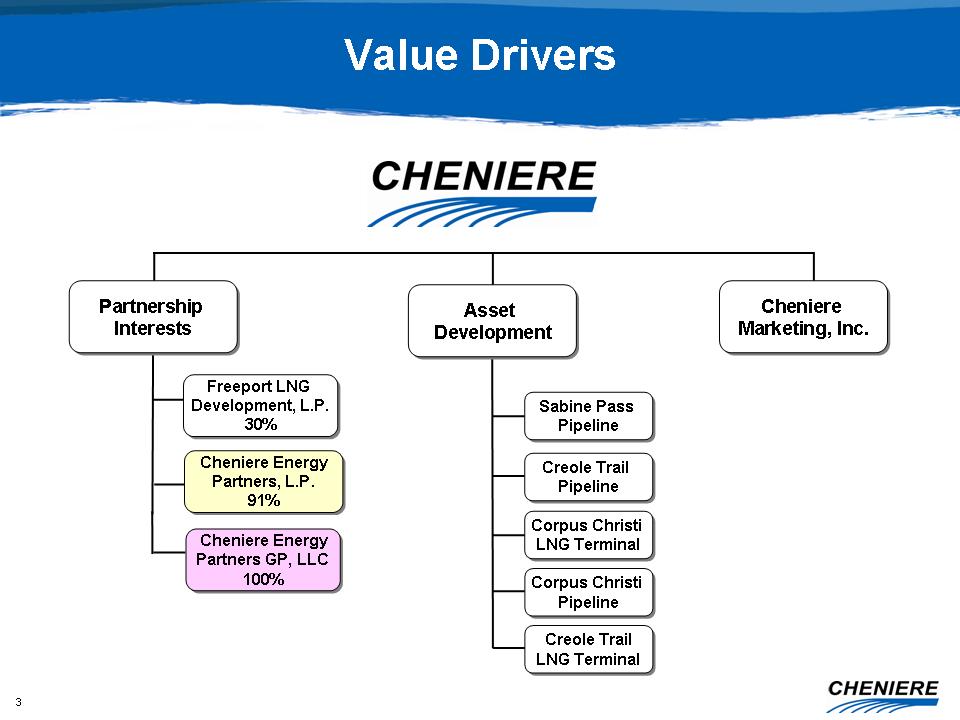
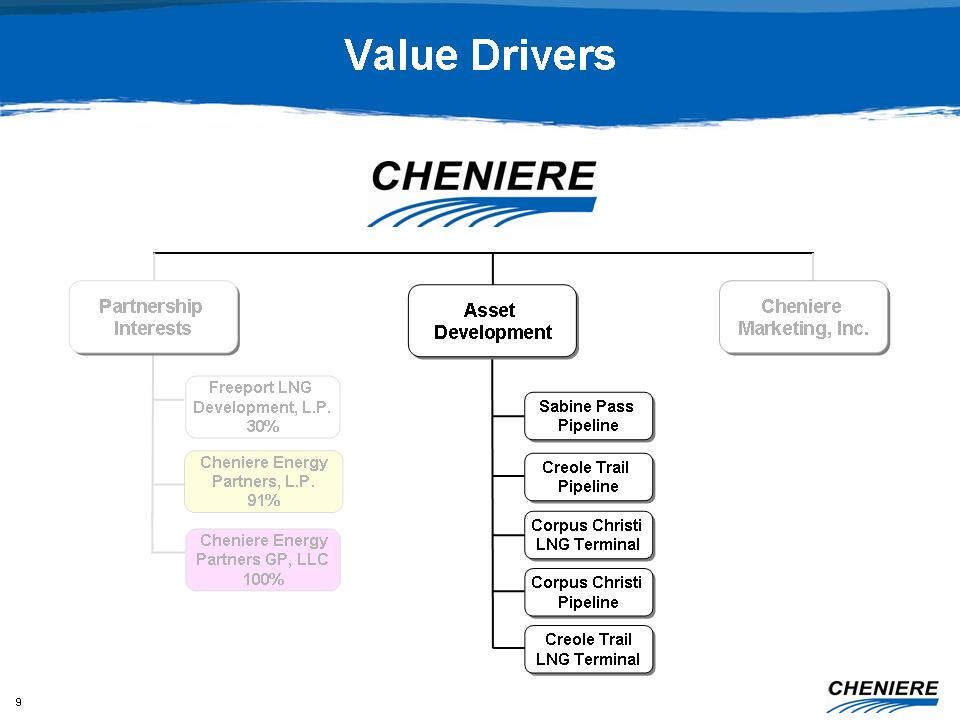
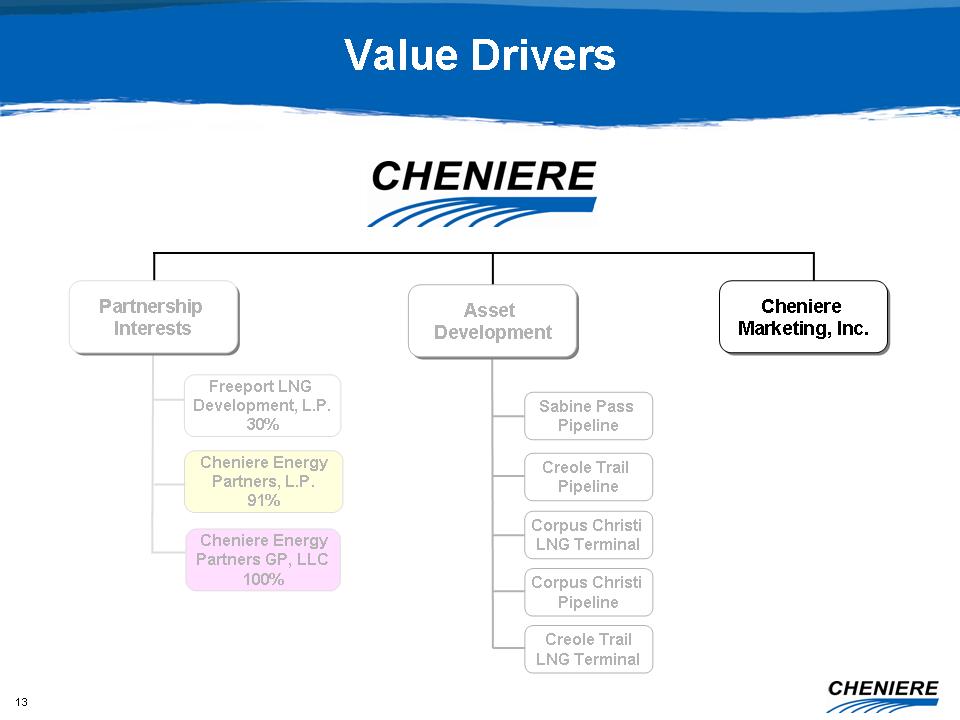
Value Drivers Cheniere Marketing, Inc. Cheniere Marketing, Inc. Corpus Christi
Pipeline Corpus Christi Pipeline Creole Trail LNG Terminal Creole Trail LNG
Terminal Sabine Pass Pipeline Sabine Pass Pipeline Creole Trail Pipeline
Creole
Trail Pipeline Corpus Christi LNG Terminal Corpus Christi LNG Terminal Asset
Development Asset Development Partnership Interests Partnership Interests
Cheniere Energy Partners GP, LLC 100% Cheniere Energy Partners GP, LLC 100%
Cheniere Energy Partners, L.P. 91% Cheniere Energy Partners, L.P. 91% Freeport
LNG Development, L.P. 30% Freeport LNG Development, L.P. 30%
4
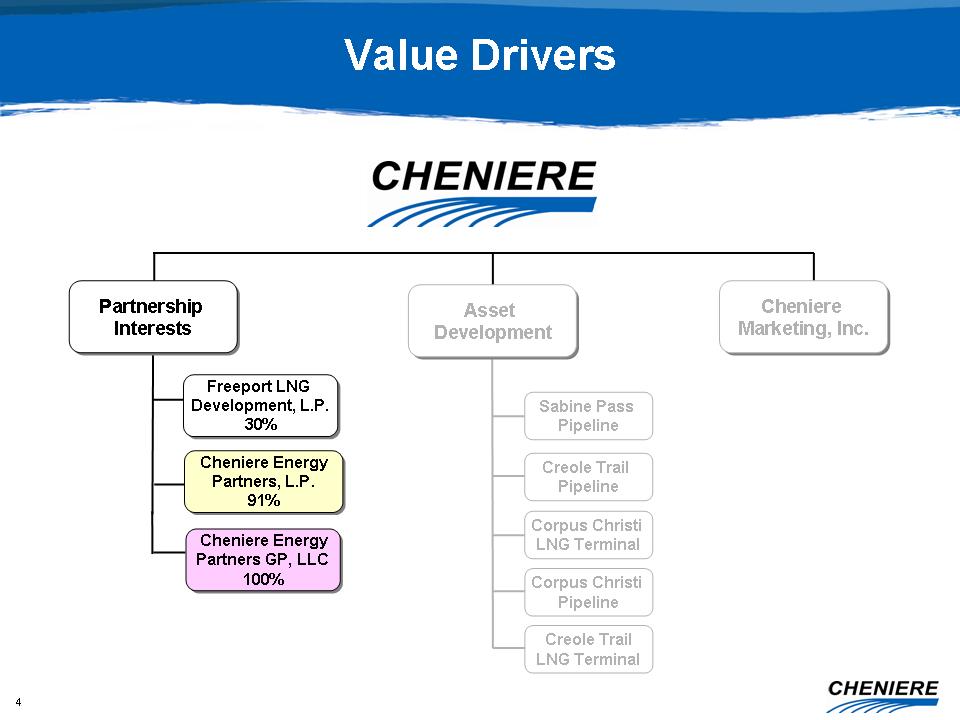
Value Drivers Corpus Christi Pipeline Creole Trail LNG Terminal Sabine Pass
Pipeline Creole Trail Pipeline Corpus Christi LNG Terminal Asset Development
Asset Development Cheniere Marketing, Inc. Cheniere Marketing, Inc. Partnership
Interests Partnership Interests Cheniere Energy Partners GP, LLC 100% Cheniere
Energy Partners GP, LLC 100% Cheniere Energy Partners, L.P. 91% Cheniere
Energy
Partners, L.P. 91% Freeport LNG Development, L.P. 30% Freeport LNG Development,
L.P. 30%
5
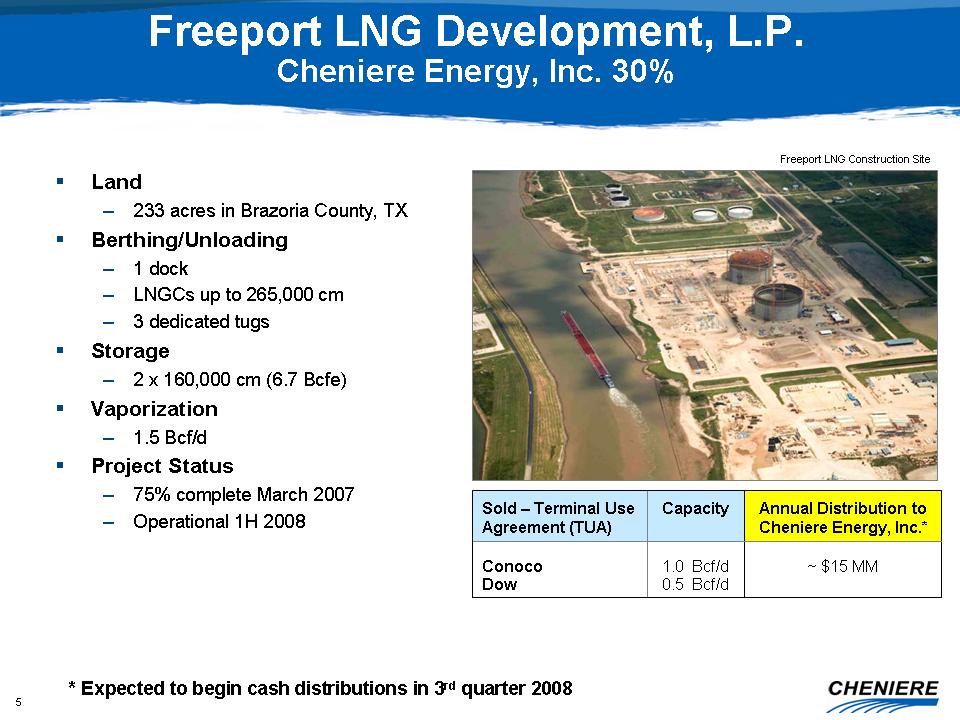
Freeport LNG Development, L.P. Cheniere Energy, Inc. 30% ?? Land – 233 acres in
Brazoria County, TX ?? Berthing/Unloading – 1 dock – LNGCs up to 265,000 cm – 3
dedicated tugs ?? Storage – 2 x 160,000 cm (6.7 Bcfe) ?? Vaporization – 1.5
Bcf/d ?? Project Status – 75% complete March 2007 – Operational 1H 2008 Freeport
LNG Construction Site 1.0 Bcf/d 0.5 Bcf/d Capacity ~ $15 MM Conoco Dow Annual
Distribution to Cheniere Energy, Inc.* Sold – Terminal Use Agreement (TUA) *
Expected to begin cash distributions in 3rd quarter 2008
6
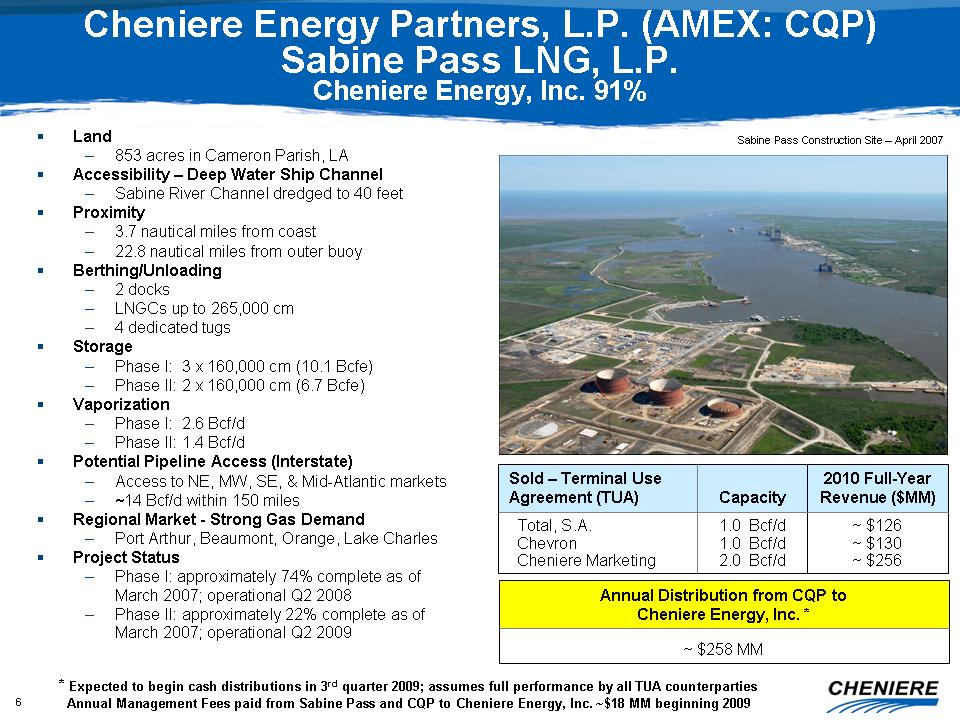
Cheniere Energy Partners, L.P. (AMEX: CQP) Sabine Pass LNG, L.P. Cheniere
Energy, Inc. 91% ?? Land – 853 acres in Cameron Parish, LA ?? Accessibility –
Deep Water Ship Channel – Sabine River Channel dredged to 40 feet ?? Proximity –
3.7 nautical miles from coast – 22.8 nautical miles from outer buoy ??
Berthing/Unloading – 2 docks – LNGCs up to 265,000 cm – 4 dedicated tugs ??
Storage – Phase I: 3 x 160,000 cm (10.1 Bcfe) – Phase II: 2 x 160,000 cm (6.7
Bcfe) ?? Vaporization – Phase I: 2.6 Bcf/d – Phase II: 1.4 Bcf/d ?? Potential
Pipeline Access (Interstate) – Access to NE, MW, SE, & Mid-Atlantic markets
– ~14 Bcf/d within 150 miles ?? Regional Market - Strong Gas Demand – Port
Arthur, Beaumont, Orange, Lake Charles ?? Project Status – Phase I:
approximately 74% complete as of March 2007; operational Q2 2008 – Phase II:
approximately 22% complete as of March 2007; operational Q2 2009 Sabine Pass
Construction Site – April 2007 1.0 Bcf/d 1.0 Bcf/d 2.0 Bcf/d Capacity ~ $126 ~
$130 ~ $256 Total, S.A. Chevron Cheniere Marketing 2010 Full-Year Revenue
($MM)
Sold – Terminal Use Agreement (TUA) ~ $258 MM Annual Distribution from CQP to
Cheniere Energy, Inc. * * Expected to begin cash distributions in 3rd quarter
2009; assumes full performance by all TUA counterparties Annual Management
Fees
paid from Sabine Pass and CQP to Cheniere Energy, Inc. ~$18 MM beginning
2009
7
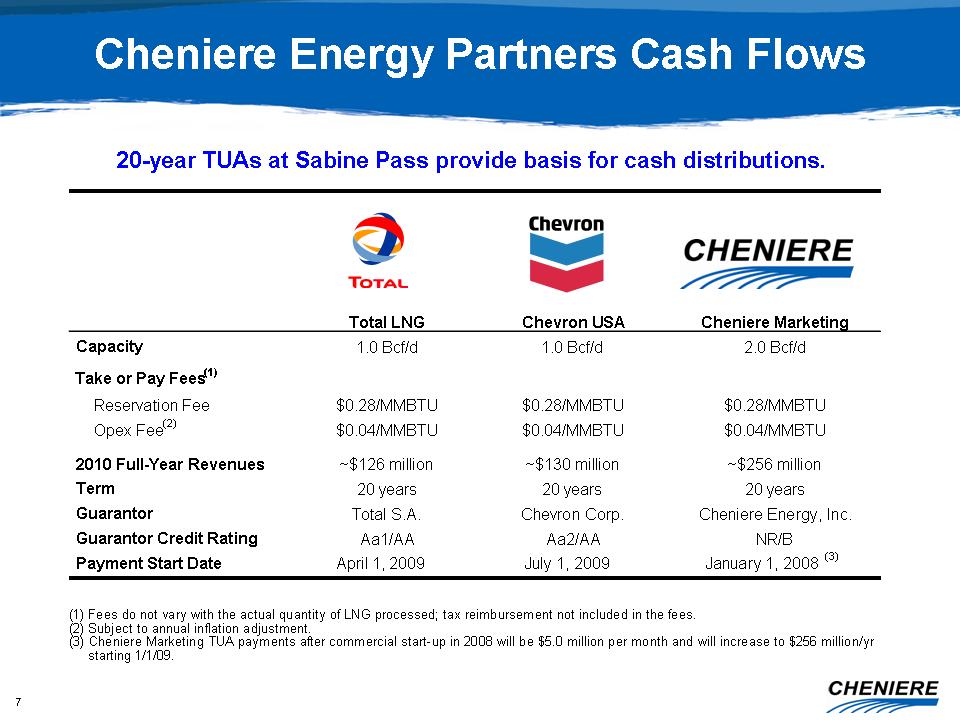
Cheniere Energy Partners Cash Flows (1) Fees do not vary with the actual
quantity of LNG processed; tax reimbursement not included in the fees. (2)
Subject to annual inflation adjustment. (3) Cheniere Marketing TUA payments
after commercial start-up in 2008 will be $5.0 million per month and will
increase to $256 million/yr starting 1/1/09. 20-year TUAs at Sabine Pass
provide
basis for cash distributions. Total LNG Chevron USA Cheniere Marketing Capacity
1.0 Bcf/d 1.0 Bcf/d 2.0 Bcf/d Take or Pay Fees(1) Reservation Fee $0.28/MMBTU
$0.28/MMBTU $0.28/MMBTU Opex Fee(2) $0.04/MMBTU $0.04/MMBTU $0.04/MMBTU 2010
Full-Year Revenues ~$126 million ~$130 million ~$256 million Term 20 years
20
years 20 years Guarantor Total S.A. Chevron Corp. Cheniere Energy, Inc.
Guarantor Credit Rating Aa1/AA Aa2/AA NR/B Payment Start Date April 1, 2009
July
1, 2009 January 1, 2008 (3)
8
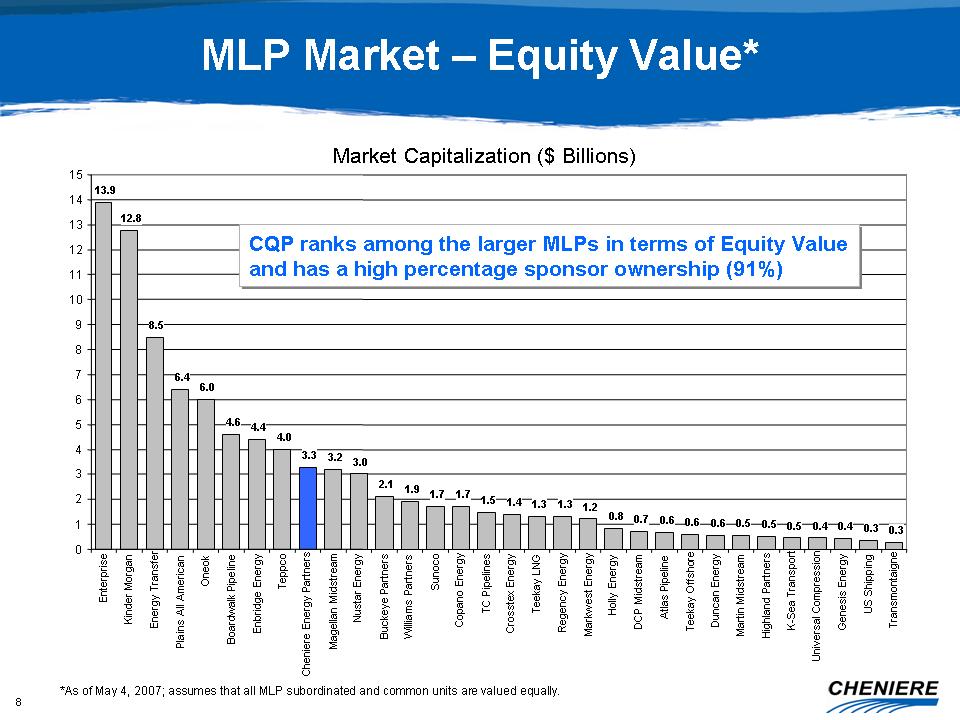
Market Capitalization ($ Billions) MLP Market – Equity Value* *As of May 4,
2007; assumes that all MLP subordinated and common units are valued equally.
13.9 12.8 8.5 6.4 6.0 4.6 4.4 4.0 3.3 3.2 3.0 2.1 1.9 1.7 1.7 1.5 1.4 1.3
1.3
1.2 0.8 0.7 0.6 0.6 0.6 0.5 0.5 0.5 0.4 0.4 0.3 0.3 0 1 2 3 4 5 6 7 8 9 10
11 12
13 14 15 Enterprise Kinder Morgan Energy Transfer Plains All American Oneok
Boardwalk Pipeline Enbridge Energy Teppco Cheniere Energy Partners Magellan
Midstream Nustar Energy Buckeye Partners Williams Partners Sunoco Copano
Energy
TC Pipelines Crosstex Energy Teekay LNG Regency Energy Markwest Energy Holly
Energy DCP Midstream Atlas Pipeline Teekay Offshore Duncan Energy Martin
Midstream Highland Partners K-Sea Transport Universal Compression Genesis
Energy
US Shipping Transmontaigne CQP ranks among the larger MLPs in terms of Equity
Value and has a high percentage sponsor ownership (91%) CQP ranks among the
larger MLPs in terms of Equity Value and has a high percentage sponsor ownership
(91%)
9
Value Drivers Cheniere Marketing, Inc. Cheniere Marketing, Inc. Corpus Christi
Pipeline Corpus Christi Pipeline Creole Trail LNG Terminal Creole Trail LNG
Terminal Sabine Pass Pipeline Sabine Pass Pipeline Creole Trail Pipeline
Creole
Trail Pipeline Corpus Christi LNG Terminal Corpus Christi LNG Terminal Asset
Development Asset Development Partnership Interests Partnership Interests
Cheniere Energy Partners GP, LLC 100% Cheniere Energy Partners, L.P. 91%
Freeport LNG Development, L.P. 30%
10
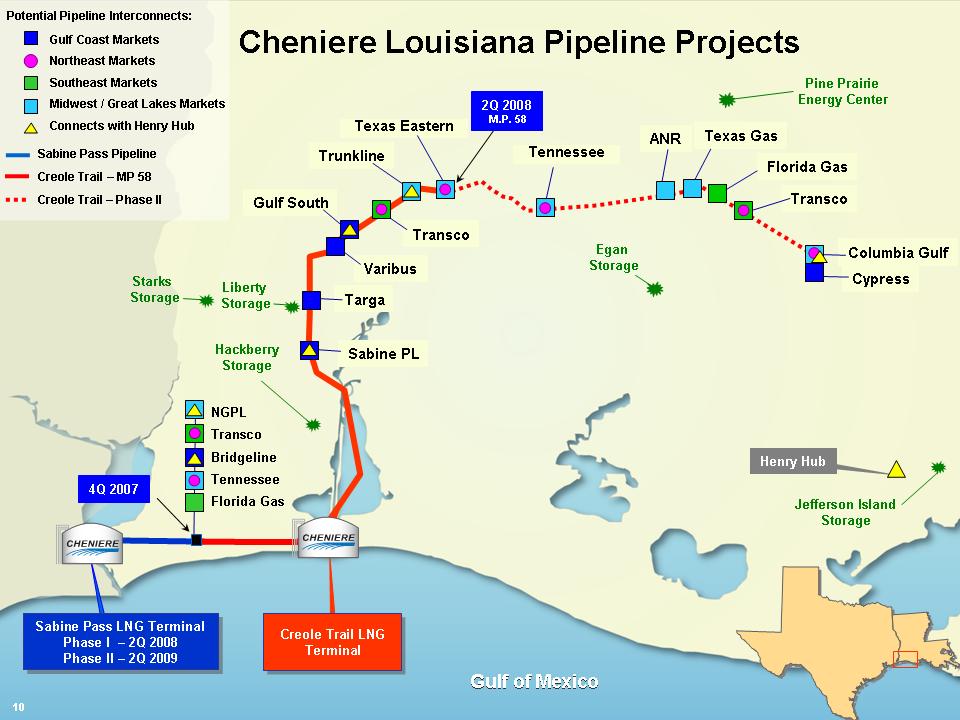
Sabine PL Targa Transco Gulf South Trunkline Jefferson Island Storage Sabine
Pass LNG Terminal Phase I – 2Q 2008 Phase II – 2Q 2009 Sabine Pass LNG Terminal
Phase I – 2Q 2008 Phase II – 2Q 2009 Creole Trail LNG Terminal Creole Trail LNG
Terminal Henry Hub Varibus NGPL Transco Bridgeline Tennessee Florida Gas
Cheniere Louisiana Pipeline Projects Liberty Storage Starks Storage Hackberry
Storage Texas Eastern Gulf Coast Markets Northeast Markets Southeast Markets
Midwest / Great Lakes Markets Connects with Henry Hub Gulf of Mexico Gulf
of
Mexico 4Q 2007 ANR Texas Gas Transco Florida Gas Columbia Gulf Cypress Egan
Storage Pine Prairie Energy Center Tennessee 2Q 2008 M.P. 58 Sabine Pass
Pipeline Creole Trail – MP 58 Creole Trail – Phase II 10 Potential Pipeline
Interconnects:
11
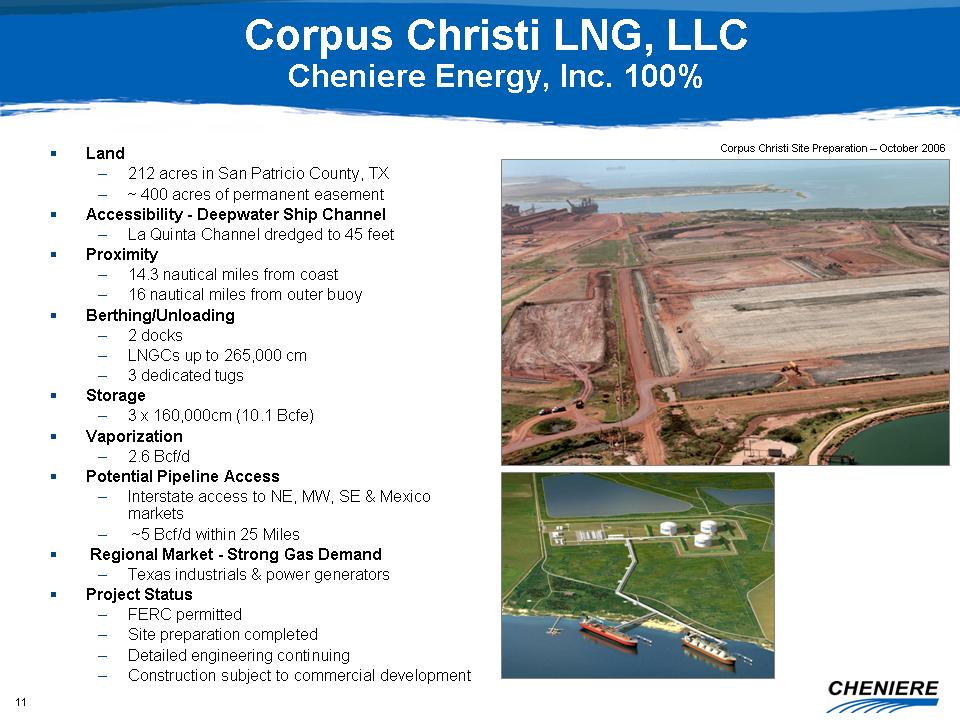
Corpus Christi LNG, LLC Cheniere Energy, Inc. 100% ?? Land – 212 acres in San
Patricio County, TX – ~ 400 acres of permanent easement ?? Accessibility -
Deepwater Ship Channel – La Quinta Channel dredged to 45 feet ?? Proximity –
14.3 nautical miles from coast – 16 nautical miles from outer buoy ??
Berthing/Unloading – 2 docks – LNGCs up to 265,000 cm – 3 dedicated tugs ??
Storage – 3 x 160,000cm (10.1 Bcfe) ?? Vaporization – 2.6 Bcf/d ?? Potential
Pipeline Access – Interstate access to NE, MW, SE & Mexico markets – ~5
Bcf/d within 25 Miles ?? Regional Market - Strong Gas Demand – Texas industrials
& power generators ?? Project Status – FERC permitted – Site preparation
completed – Detailed engineering continuing – Construction subject to commercial
development Corpus Christi Site Preparation – October 2006
12
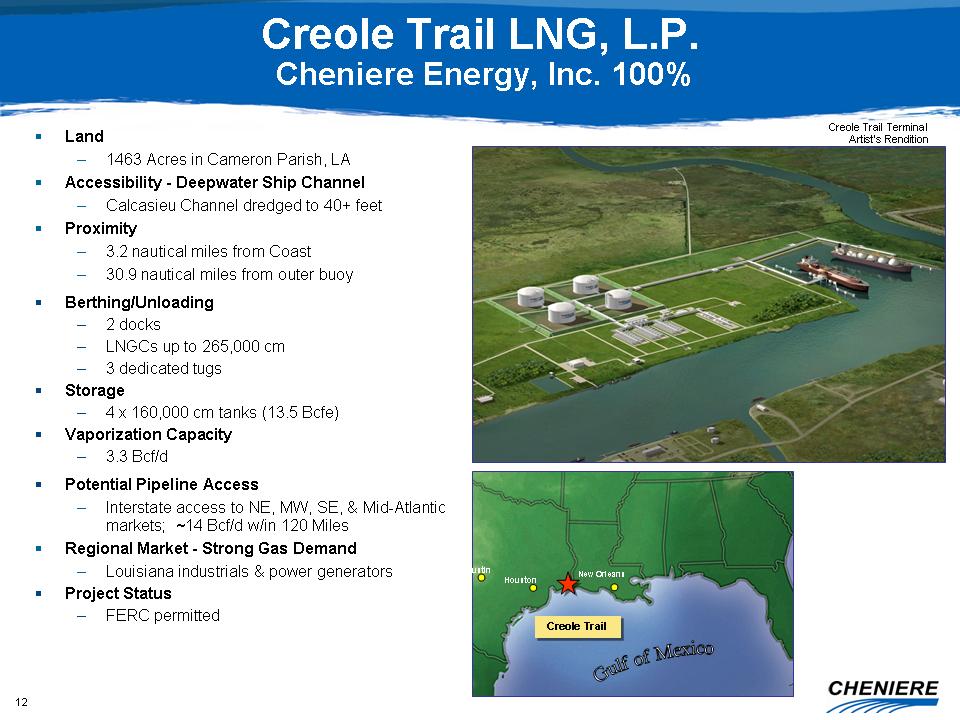
Creole Trail LNG, L.P. Cheniere Energy, Inc. 100% ?? Land – 1463 Acres in
Cameron Parish, LA ?? Accessibility - Deepwater Ship Channel – Calcasieu Channel
dredged to 40+ feet ?? Proximity – 3.2 nautical miles from Coast – 30.9 nautical
miles from outer buoy ?? Berthing/Unloading – 2 docks – LNGCs up to 265,000 cm –
3 dedicated tugs ?? Storage – 4 x 160,000 cm tanks (13.5 Bcfe) ?? Vaporization
Capacity – 3.3 Bcf/d ?? Potential Pipeline Access – Interstate access to NE, MW,
SE, & Mid-Atlantic markets; ~14 Bcf/d w/in 120 Miles ?? Regional Market -
Strong Gas Demand – Louisiana industrials & power generators ?? Project
Status – FERC permitted Creole Trail Terminal Artist’s Rendition Creole Trail
Creole Trail Austin Houston New Orleans
13
Value Drivers Cheniere Marketing, Inc. Cheniere Marketing, Inc. Corpus Christi
Pipeline Creole Trail LNG Terminal Sabine Pass Pipeline Creole Trail Pipeline
Corpus Christi LNG Terminal Asset Development Asset Development Partnership
Interests Partnership Interests Cheniere Energy Partners GP, LLC 100% Cheniere
Energy Partners, L.P. 91% Freeport LNG Development, L.P. 30%
14
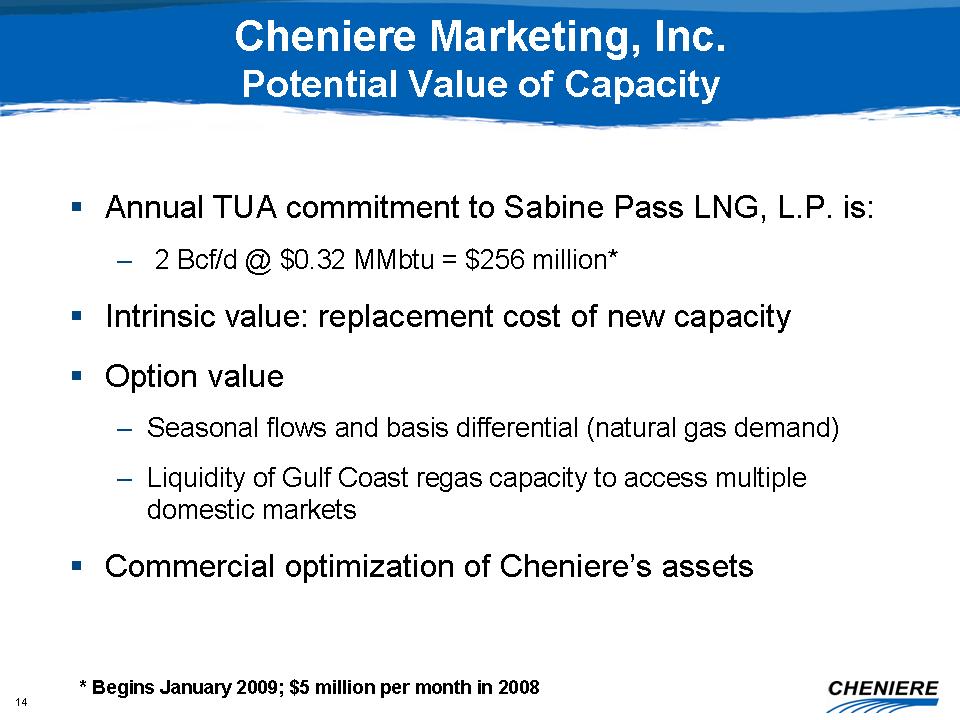
Cheniere Marketing, Inc. Potential Value of Capacity ?? Annual TUA commitment
to
Sabine Pass LNG, L.P. is: – 2 Bcf/d @ $0.32 MMbtu = $256 million* ?? Intrinsic
value: replacement cost of new capacity ?? Option value – Seasonal flows and
basis differential (natural gas demand) – Liquidity of Gulf Coast regas capacity
to access multiple domestic markets ?? Commercial optimization of Cheniere’s
assets * Begins January 2009; $5 million per month in 2008
15
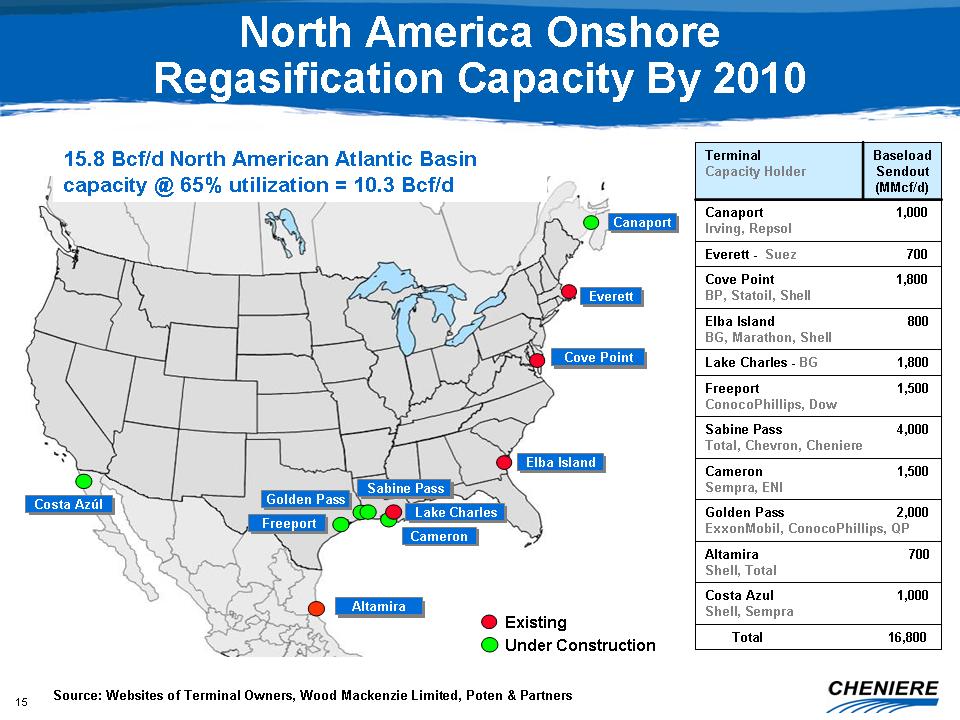
Everett Everett Cove Point Cove Point Elba Island Elba Island Lake Charles
Lake
Charles Sabine Pass Sabine Pass Freeport Freeport Golden Pass Golden Pass
Cameron Cameron Costa Azúl Costa Azúl Canaport Canaport Existing Under
Construction Altamira Altamira Source: Websites of Terminal Owners, Wood
Mackenzie Limited, Poten & Partners Altamira 700 Shell, Total Costa Azul
1,000 Shell, Sempra Canaport 1,000 Irving, Repsol Total 16,800 Golden Pass
2,000
ExxonMobil, ConocoPhillips, QP Cameron 1,500 Sempra, ENI Sabine Pass 4,000
Total, Chevron, Cheniere Freeport 1,500 ConocoPhillips, Dow Lake Charles
- BG
1,800 Elba Island 800 BG, Marathon, Shell Cove Point 1,800 BP, Statoil, Shell
Everett - Suez 700 Baseload Sendout (MMcf/d) Terminal Capacity Holder North
America Onshore Regasification Capacity By 2010 15.8 Bcf/d North American
Atlantic Basin capacity @ 65% utilization = 10.3 Bcf/d
16
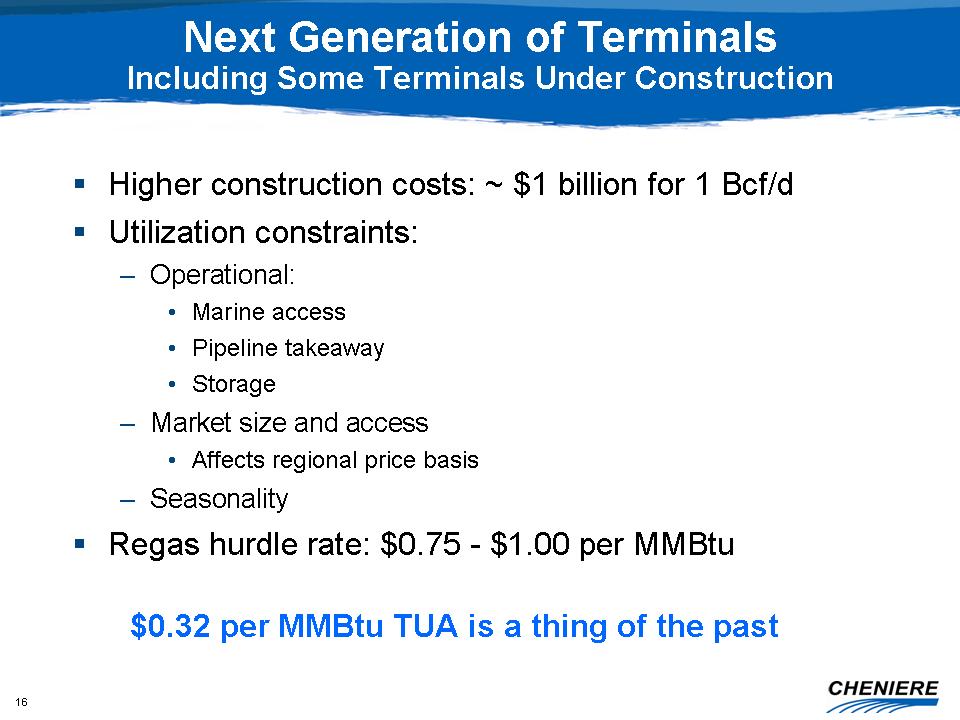
Next Generation of Terminals Including Some Terminals Under Construction
??
Higher construction costs: ~ $1 billion for 1 Bcf/d ?? Utilization constraints:
– Operational: • Marine access • Pipeline takeaway • Storage – Market size and
access • Affects regional price basis – Seasonality ?? Regas hurdle rate: $0.75
- $1.00 per MMBtu $0.32 per MMBtu TUA is a thing of the past
17
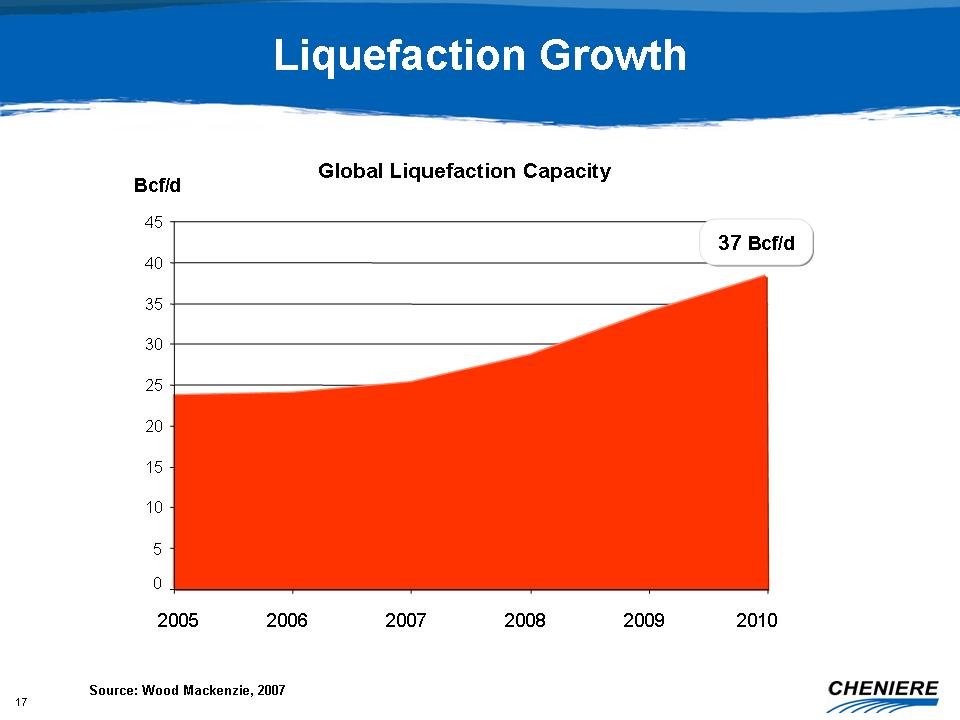
Liquefaction Growth Source: Wood Mackenzie, 2007 Global Liquefaction Capacity
0
5 10 15 20 25 30 35 40 45 2005 2006 2007 2008 2009 2010 Bcf/d 37 Bcf/d 37
Bcf/d
18 12
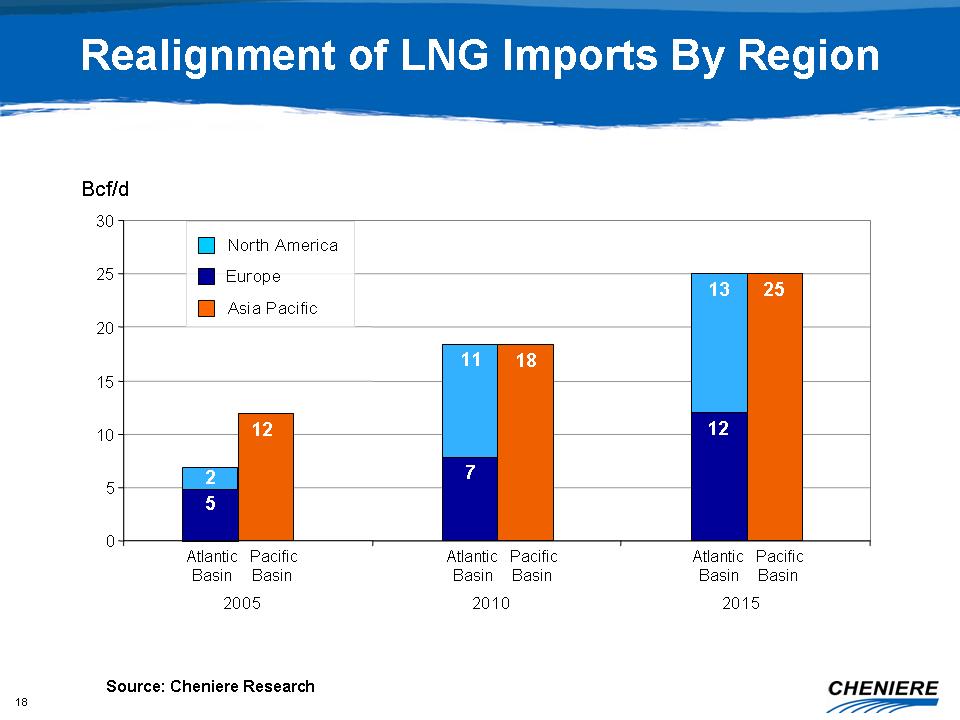
18
25 5 7 12 2 11 13 0 5 10 15 20 25 30 2005 2010 2015 Source: Cheniere Research
Realignment of LNG Imports By Region Bcf/d North America Europe Asia Pacific
Atlantic Basin Pacific Basin Atlantic Basin Pacific Basin Atlantic Basin
Pacific
Basin
19
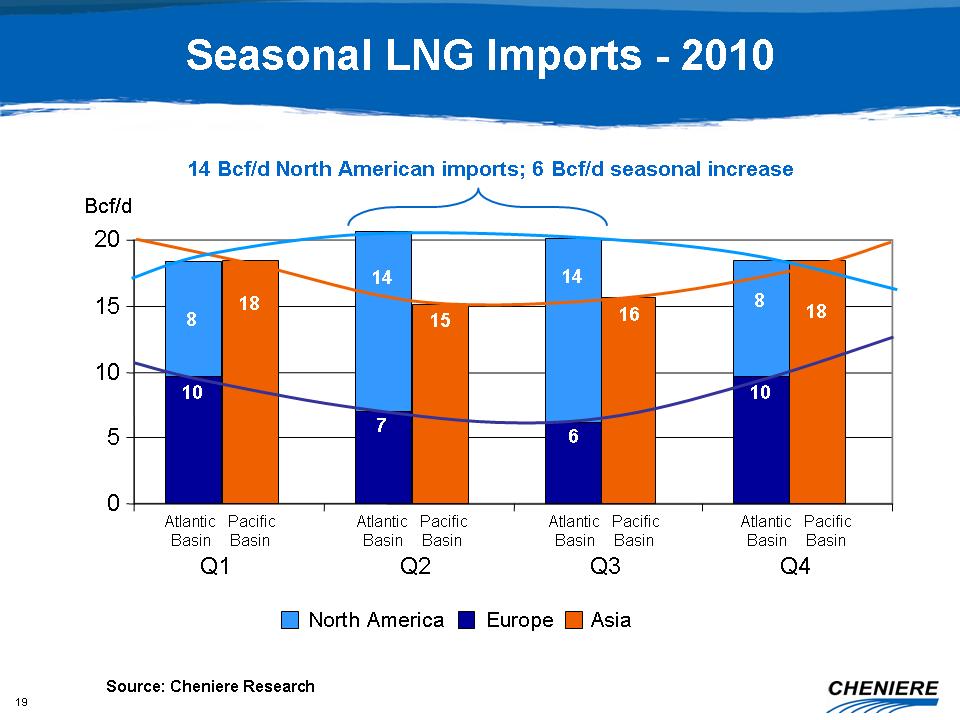
Seasonal LNG Imports - 2010 15 16 18 0 5 10 15 20 Atlantic Basin Q2 Q3 Q4
Bcf/d
North America Europe Asia 10 8 7 14 6 14 10 8 Pacific Basin Atlantic Basin
Pacific Basin Atlantic Basin Pacific Basin Atlantic Basin Pacific Basin Q1
18
Source: Cheniere Research 14 Bcf/d North American imports; 6 Bcf/d seasonal
increase
20
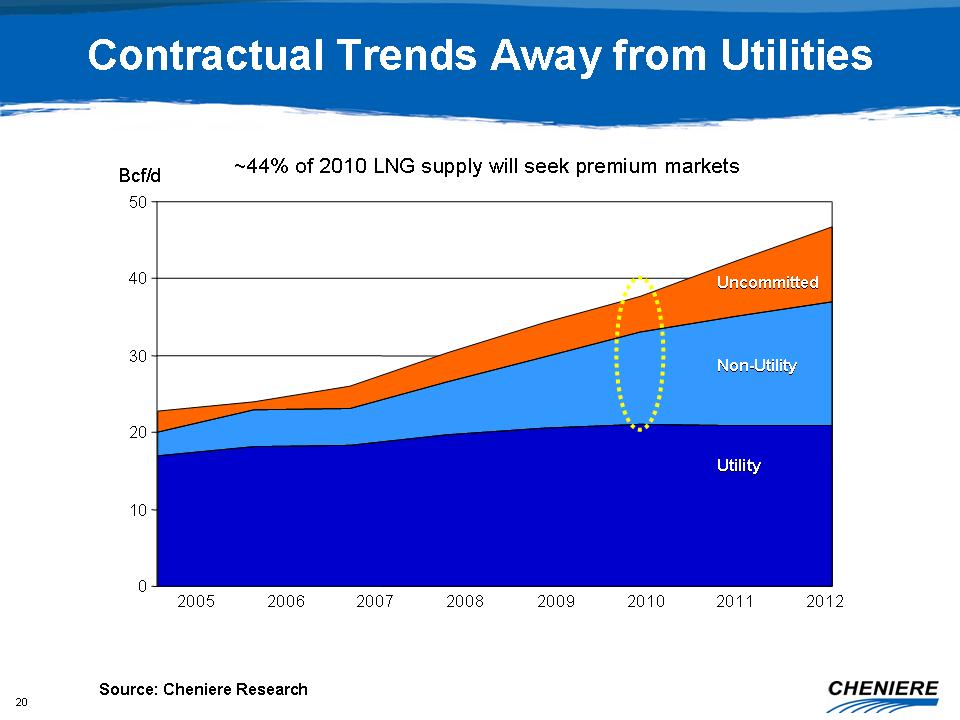
Contractual Trends Away from Utilities 0 10 20 30 40 50 Bcf/d 2005 2006 2007
2008 2009 2010 2011 2012 Non-Utility Non-Utility Uncommitted Uncommitted
Utility
Utility ~44% of 2010 LNG supply will seek premium markets Source: Cheniere
Research
21
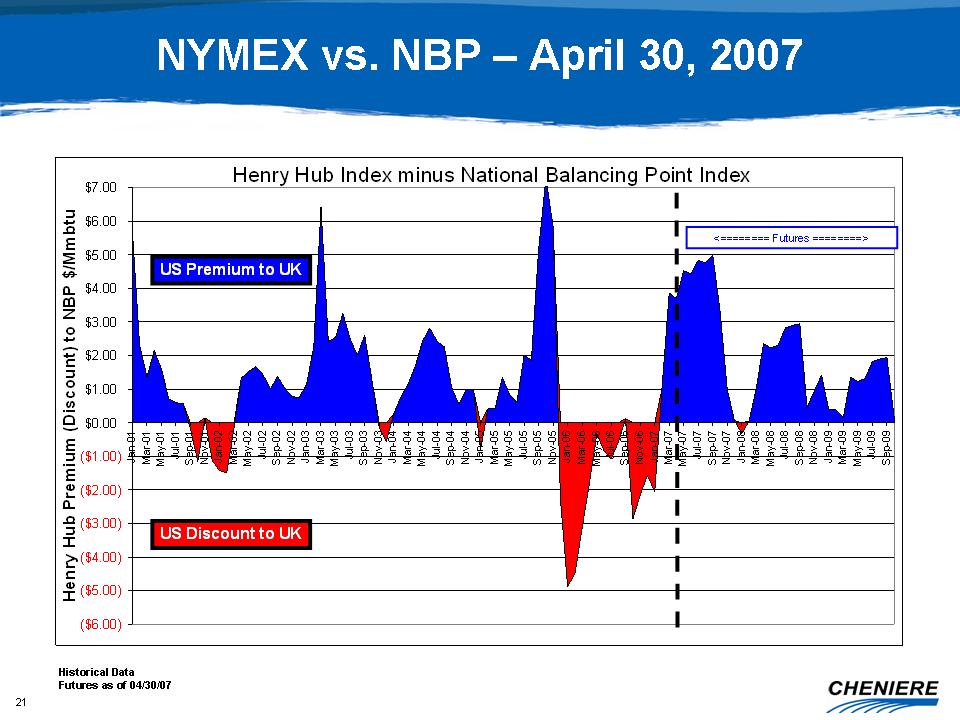
NYMEX vs. NBP – April 30, 2007 Historical Data Futures as of 04/30/07 Henry Hub
Index minus National Balancing Point Index ($6.00) ($5.00) ($4.00) ($3.00)
($2.00) ($1.00) $0.00 $1.00 $2.00 $3.00 $4.00 $5.00 $6.00 $7.00 Jan-01 Mar-01
May-01 Jul-01 Sep-01 Nov-01 Jan-02 Mar-02 May-02 Jul-02 Sep-02 Nov-02 Jan-03
Mar-03 May-03 Jul-03 Sep-03 Nov-03 Jan-04 Mar-04 May-04 Jul-04 Sep-04 Nov-04
Jan-05 Mar-05 May-05 Jul-05 Sep-05 Nov-05 Jan-06 Mar-06 May-06 Jul-06 Sep-06
Nov-06 Jan-07 Mar-07 May-07 Jul-07 Sep-07 Nov-07 Jan-08 Mar-08 May-08 Jul-08
Sep-08 Nov-08 Jan-09 Mar-09 May-09 Jul-09 Sep-09 Henry Hub Premium (Discount)
to
NBP $/Mmbtu <======== Futures ========> US Premium to UK US Discount to UK
22
Cheniere Marketing Goal ?? Exceed Cheniere’s opportunity cost for the capacity
held by Cheniere Marketing by: – Capturing the intrinsic value of cross-Atlantic
spreads – Capturing a portion of the option value associated with being in the
world’s most liquid market
23
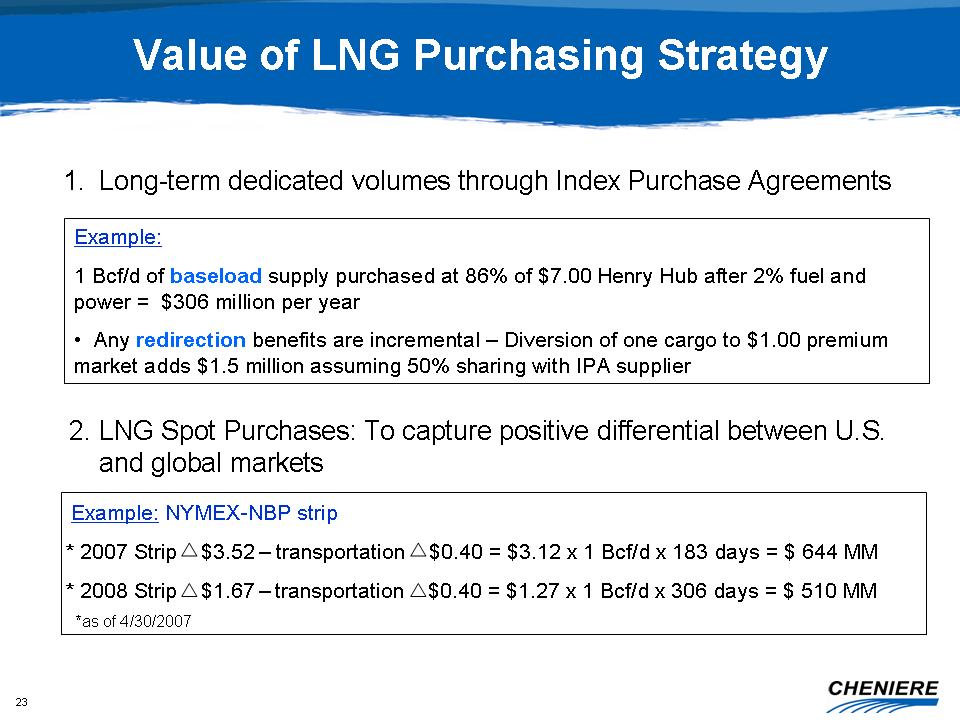
Value of LNG Purchasing Strategy Example: 1 Bcf/d of baseload supply purchased
at 86% of $7.00 Henry Hub after 2% fuel and power = $306 million per year
• Any
redirection benefits are incremental – Diversion of one cargo to $1.00 premium
market adds $1.5 million assuming 50% sharing with IPA supplier 1. Long-term
dedicated volumes through Index Purchase Agreements 2. LNG Spot Purchases:
To
capture positive differential between U.S. and global markets Example: NYMEX-NBP
strip * 2007 Strip $3.52 – transportation $0.40 = $3.12 x 1 Bcf/d x 183 days = $
644 MM * 2008 Strip $1.67 – transportation $0.40 = $1.27 x 1 Bcf/d x 306 days =
$ 510 MM *as of 4/30/2007
2007
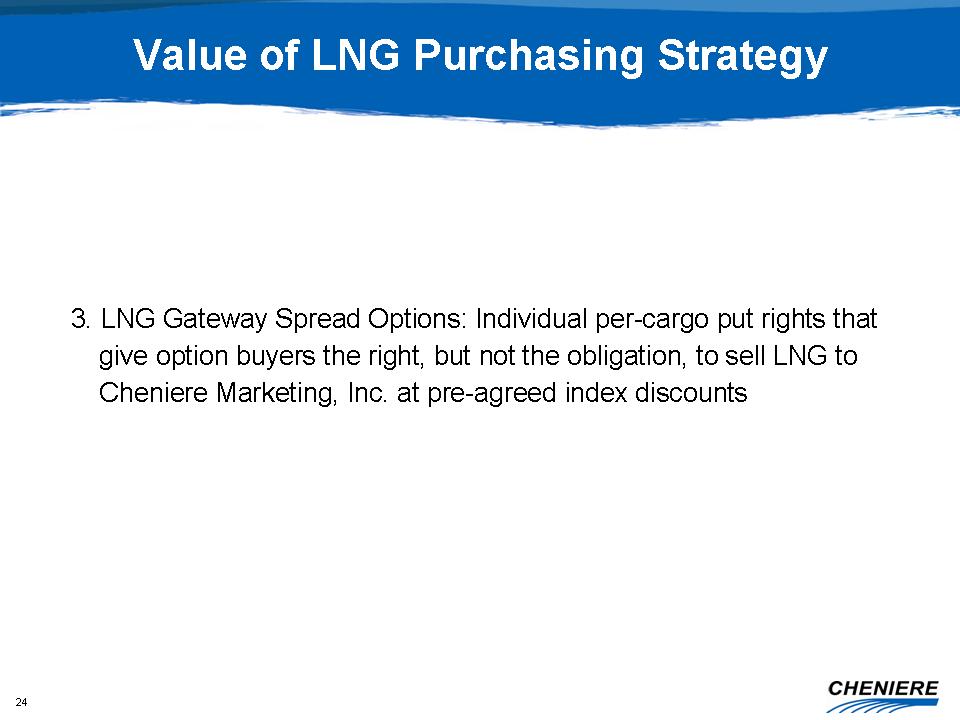
24 Value of LNG Purchasing Strategy 3. LNG Gateway Spread Options: Individual
per-cargo put rights that give option buyers the right, but not the obligation,
to sell LNG to Cheniere Marketing, Inc. at pre-agreed index discounts
25
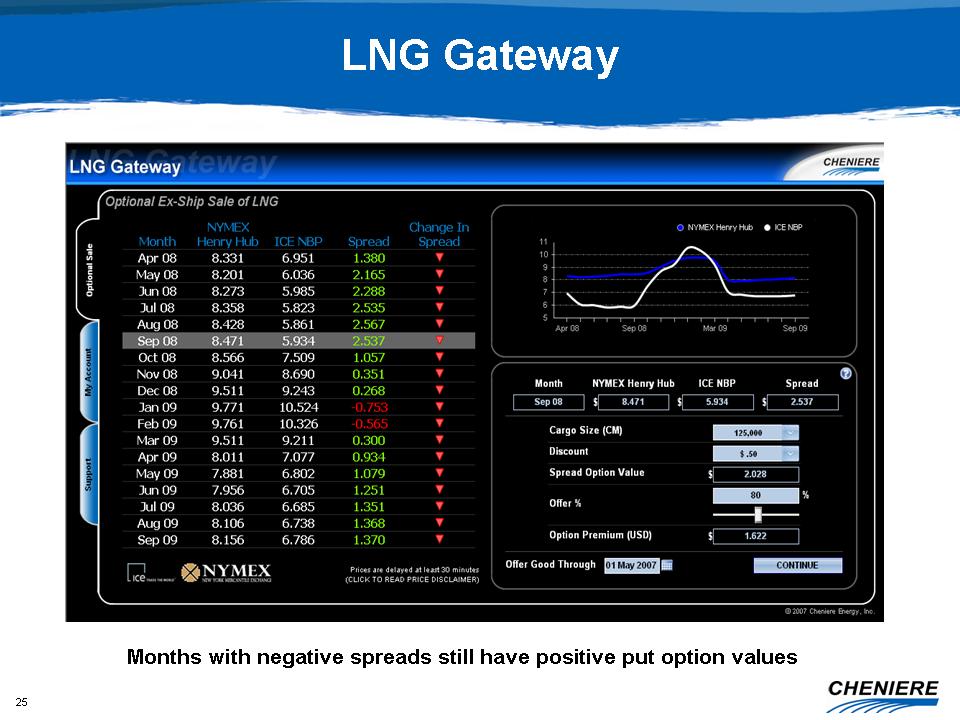
LNG Gateway Months with negative spreads still have positive put option values
Support My Account Optional Sale Month NYMEX Henry Hub Ice NBP Spread Change
in
Spread Apr 08 8.331 6.951 1.380 May 08 8.201 6.036 2.165 Jun 08 8.273 5.985
2.88
Jul 08 8.358 5.823 2.535 Aug 08 8.428 5.861 2.567 Sept 08 8.471 5.934 2.537
Oct
08 8.566 7.509 1.057 Nov 08 9.041 8.690 0.351 Dec 08 9.511 9.243 0.268 Jan
09
9.7711 10.524 -0.743 Feb 09 9.761 10.326 -0.565 Mar 09 9.511 9.211 0.300
Apr 09
8.011 7.077 0.934 May 09 7.881 6.802 1.079 Jun 09 7.956 6.705 1.251 Jul 09
8.036
6.685 1.351 Aug 09 8.106 6.738 1.368 Sep 09 8.156 6.786 1.370 Prices are
delayed
at least 30 minutes (click to read price disclaimer)
26
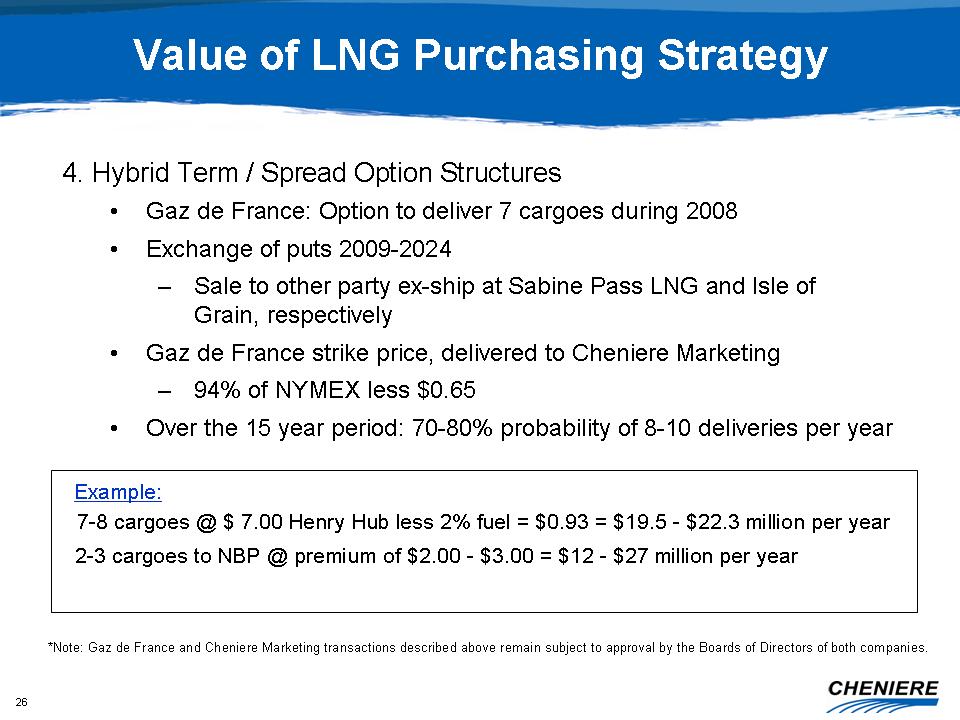
Value of LNG Purchasing Strategy 4. Hybrid Term / Spread Option Structures
• Gaz
de France: Option to deliver 7 cargoes during 2008 • Exchange of puts 2009-2024
– Sale to other party ex-ship at Sabine Pass LNG and Isle of Grain, respectively
• Gaz de France strike price, delivered to Cheniere Marketing – 94% of NYMEX
less $0.65 • Over the 15 year period: 70-80% probability of 8-10 deliveries per
year Example: 7-8 cargoes @ $ 7.00 Henry Hub less 2% fuel = $0.93 = $19.5
-
$22.3 million per year 2-3 cargoes to NBP @ premium of $2.00 - $3.00 = $12
- $27
million per year *Note: Gaz de France and Cheniere Marketing transactions
described above remain subject to approval by the Boards of Directors of
both
companies.
27
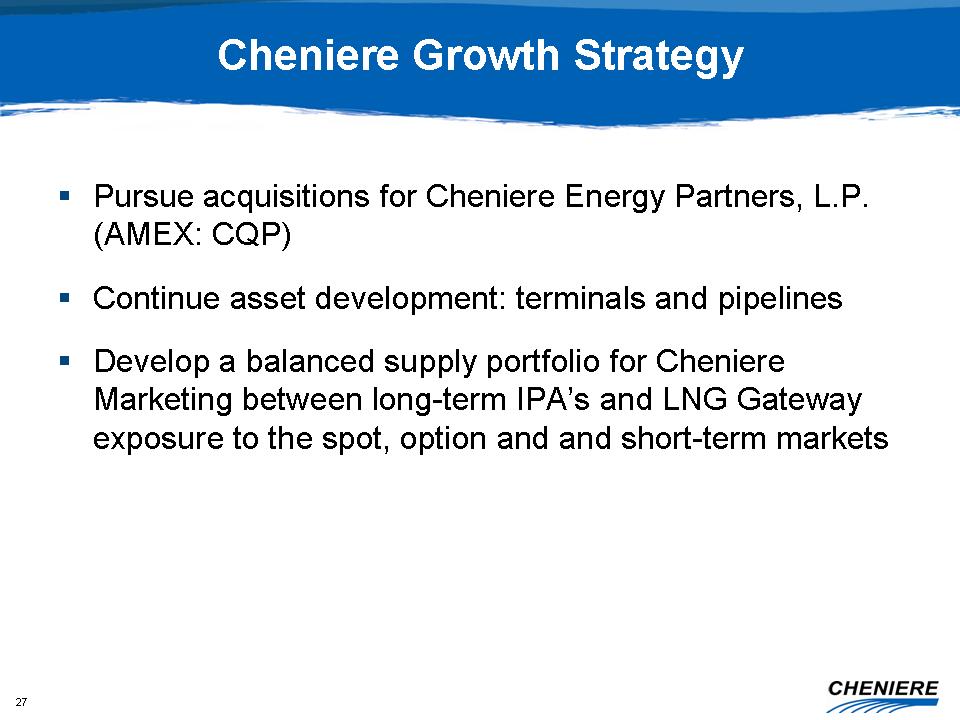
Cheniere Growth Strategy ?? Pursue acquisitions for Cheniere Energy Partners,
L.P. (AMEX: CQP) ?? Continue asset development: terminals and pipelines ??
Develop a balanced supply portfolio for Cheniere Marketing between long-term
IPA’s and LNG Gateway exposure to the spot, option and and short-term markets
28
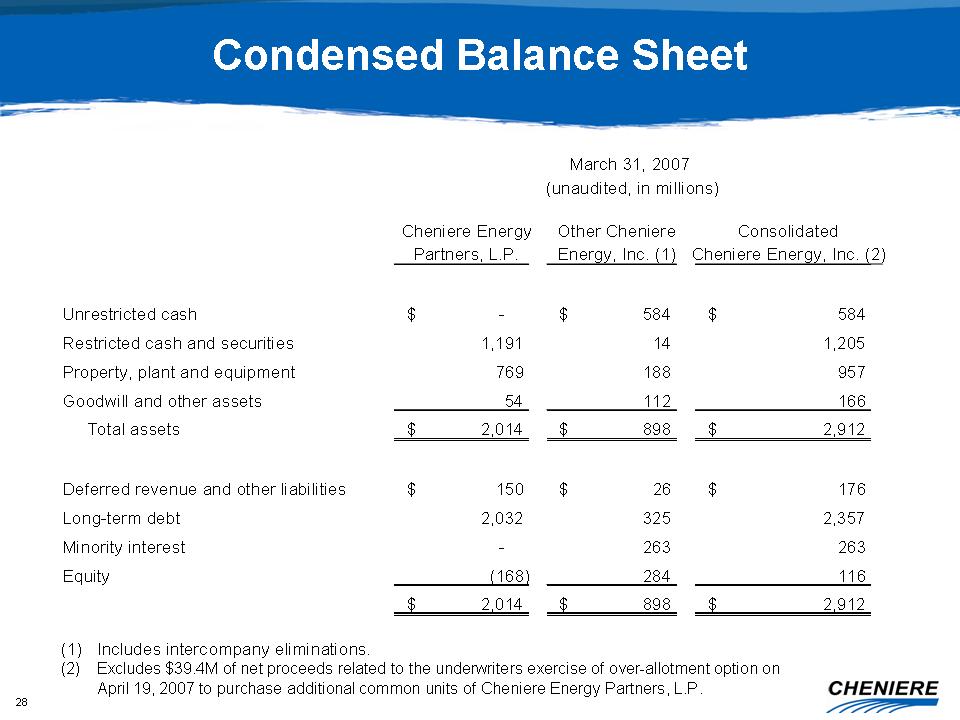
Condensed Balance Sheet Cheniere Energy Other Cheniere Consolidated Partners,
L.P. Energy, Inc. (1) Cheniere Energy, Inc. (2) Unrestricted cash - $ 584
$ 584
$ Restricted cash and securities 1,191 14 1,205 Property, plant and equipment
769 188 957 Goodwill and other assets 54 112 166 Total assets 2,014 $ 898
$
2,912 $ Deferred revenue and other liabilities 150 $ 26 $ 176 $ Long-term
debt
2,032 325 2,357 Minority interest - 263 263 Equity (168) 284 116 2,014 $
898 $
2,912 $ (1) Includes intercompany eliminations. (2) Excludes $39.4M of net
proceeds related to the underwriters exercise of over-allotment option on
April
19, 2007 to purchase additional common units of Cheniere Energy Partners,
L.P.
March 31, 2007 (unaudited, in millions)