Exhibit
99.1
CHENIERE
ENERGY ,INC . Corporate Presentation January 2007
This
presentation contains certain statements that are, or may be deemed to be,
“forward-looking statements” within the meaning of Section 27A of the Securities
Act and Section 21E of the Securities Exchange Act of 1934, as amended, or
the
Exchange Act. All statements, other than statements of historical facts,
included herein are “forward-looking statements.” Included among
“forward-looking statements” are, among other things: ⑀⍽ statements that we
expect to commence or complete construction of each or any of our proposed
liquefied natural gas, or LNG, receiving terminals by certain dates, or at
all;
⑀⍽ statements that we expect to receive Draft Environmental Impact Statements
or
Final Environmental Impact Statements from the Federal Energy Regulatory
Commission, or FERC, by certain dates, or at all, or that we expect to receive
an order from FERC authorizing us to construct and operate proposed LNG
receiving terminals by a certain date, or at all; ⑀⍽ statements regarding future
levels of domestic natural gas production and consumption, or the future
level
of LNG imports into North America, or regarding projected future capacity
of
liquefaction or regasification facilities worldwide regardless of the source
of
such information; ⑀⍽ statements regarding any financing transactions or
arrangements, whether on the part of Cheniere or at the project level; ⑀⍽
statements relating to the construction of our proposed LNG receiving terminals,
including statements concerning estimated costs, and the engagement of any
EPC
contractor; ⑀⍽ statements regarding any Terminal Use Agreement, or TUA, or other
commercial arrangements presently contracted, optioned, marketed or potential
arrangements to be performed substantially in the future, including any cash
distributions and revenues anticipated to be received; statements regarding
the
commercial terms and potential revenues from Targeted Long-Term Agreements
described in this presentation; ⑀⍽ statements regarding the commercial terms or
potential revenue from any arrangements which may arise from the marketing
of
uncommitted capacity from any of the terminals, including the Creole Trail
and
Corpus Christi terminals which do not currently have contractual commitments;
⑀⍽
statements regarding the commercial terms or potential revenue from any
arrangement relating to the proposed contracting for excess or expansion
capacity for the Sabine Pass LNG Terminal or the Indexed Purchase Agreement
(“IPA’s”) Examples described in this presentation; ⑀⍽ statements that our
proposed LNG receiving terminals, when completed, will have certain
characteristics, including amounts of regasification and storage capacities,
a
number of storage tanks and docks and pipeline interconnections; ⑀⍽ statements
regarding Cheniere and Cheniere Marketing forecasts, and any potential revenues
and capital expenditures which may be derived from either of Cheniere Energy’s
business groups; ⑀⍽ statements regarding Cheniere Pipeline Company, and the
capital expenditures and potential revenues related to this business group;
statements regarding our proposed LNG receiving terminals’ access to existing
pipelines, and their ability to obtain transportation capacity on existing
pipelines; ⑀⍽ statements regarding possible expansions of the currently
projected size of any of our proposed LNG receiving terminals; ⑀⍽ statements
regarding our business strategy, our business plan or any other plans,
forecasts, examples, models, forecasts or objectives; ⑀⍽ statements regarding
estimated corporate overhead expenses; and ⑀⍽ any other statements that relate
to non-historical information. These forward-looking statements are often
identified by the use of terms and phrases such as “achieve,” “anticipate,”
“believe,” “estimate,” “example,” “expect,” “forecast,” “opportunities,” “plan,”
“potential,” “project,” “propose,” “subject to,” and similar terms and phrases.
Although we believe that the expectations reflected in these forward-looking
statements are reasonable, they do involve assumptions, risks and uncertainties,
and these expectations may prove to be incorrect. You should not place undue
reliance on these forward-looking statements, which speak only as of the
date of
this presentation. Our actual results could differ materially from those
anticipated in these forward-looking statements as a result of a variety
of
factors, including those discussed in “Risk Factor
s”
in the Cheniere Energy, Inc. Annual Report on Form 10-K for the year ended
December 31, 2005, which are incorporated by reference into this presentation.
All forward-looking statements attributable to us or persons acting on our
behalf are expressly qualified in their entirety by these ”Risk Factors”. These
forward-looking statements are made as of the date of this presentation,
and we
undertake no obligation to publicly update or revise any forward-looking
statements.
⑀⍽
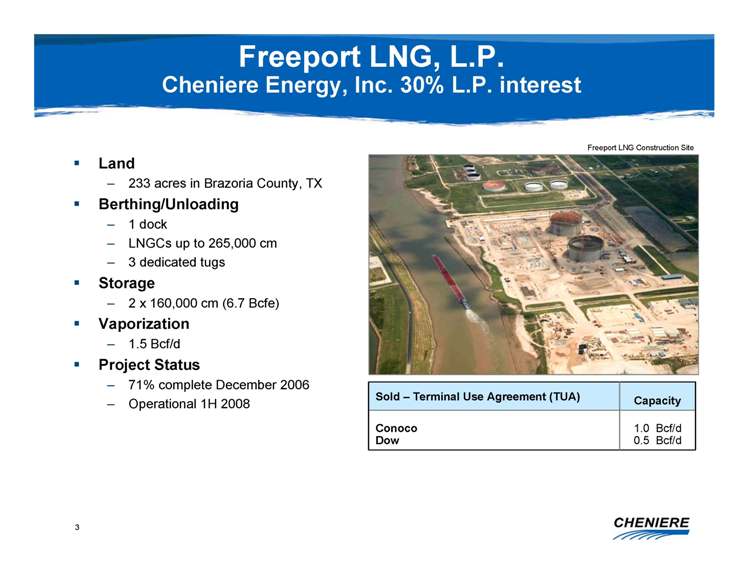
Land - 233 acres in Brazoria County, TX ⑀⍽ Berthing/Unloading - 1 dock - LNGCs
up to 265,000 cm - 3 dedicated tugs ⑀⍽ Storage - 2 x 160,000 cm (6.7 Bcfe) ⑀⍽
Vaporization - 1.5 Bcf/d ⑀⍽ Project Status - 71% complete December 2006 -
Operational 1H 2008 Sold - Terminal Use Agreement (TUA) 1.0 Bcf/d 0.5 Bcf/d
Conoco Dow Capacity
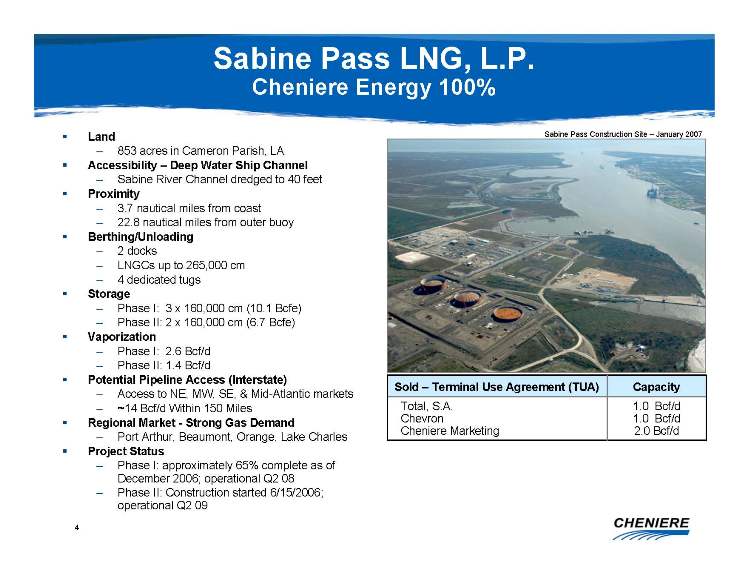
Sabine
Pass LNG, L.P. Cheniere Energy 100% ⑀⍽ Land - 853 acres in Cameron Parish, LA ⑀⍽
Accessibility - Deep Water Ship Channel - Sabine River Channel dredged to
40
feet ⑀⍽ Proximity - 3.7 nautical miles from coast - 22.8 nautical miles from
outer buoy ⑀⍽ Berthing/Unloading - 2 docks - LNGCs up to 265,000 cm - 4
dedicated tugs ⑀⍽ Storage - Phase I: 3 x 160,000 cm (10.1 Bcfe) - Phase II: 2 x
160,000 cm (6.7 Bcfe) ⑀⍽ Vaporization - Phase I: 2.
6
Bcf/d - Phase II: 1.4 Bcf/d ⑀⍽ Potential Pipeline Access (Interstate) - Access
to NE, MW, SE, & Mid-Atlantic markets - ~14 Bcf/d Within 150 Miles ⑀⍽
Regional Market - Strong Gas Demand - Port Arthur, Beaumont, Orange, Lake
Charles ⑀⍽ Project Status - Phase I: approximately 65% complete as of December
2006; operational Q2 08 - Phase II: Construction started 6/15/2006; operational
Q2 09 Sold - Terminal Use Agreement (TUA) 1.0 Bcf/d 1.0 Bcf/d 2.0 Bcf/d Total,
S.A. Chevron Cheniere Marketing Capacity
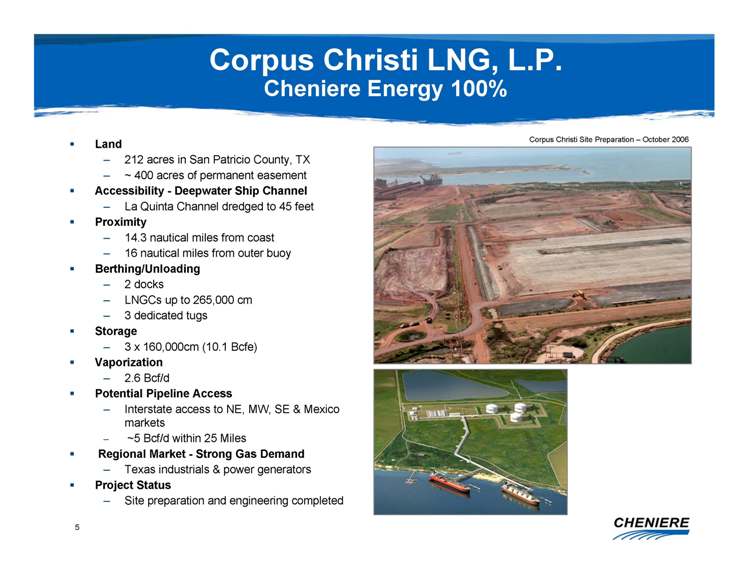
Corpus
Christi LNG, L.P. Cheniere Energy 100% ⑀⍽ Land - 212 acres in San Patricio
County, TX - ~ 400 acres of permanent easement ⑀⍽ Accessibility - Deepwater Ship
Channel - La Quinta Channel dredged to 45 feet ⑀⍽ Proximity - 14.3 nautical
miles from coast - 16 nautical miles from outer buoy ⑀⍽ Berthing/Unloading - 2
docks - LNGCs up to 265,000 cm - 3 dedicated tugs ⑀⍽ Storage - 3 x 160,000cm
(10.1 Bcfe) ⑀⍽ Vaporization - 2.6 Bcf/d ⑀⍽ Potential Pipeline Access -
Interstate access to NE, MW, SE & Mexico markets - ~5 Bcf/d within 25 Miles
⑀⍽ Regional Market - Strong Gas Demand - Texas industrials & power
generators ⑀⍽ Project Status - Site preparation and engineering
completed
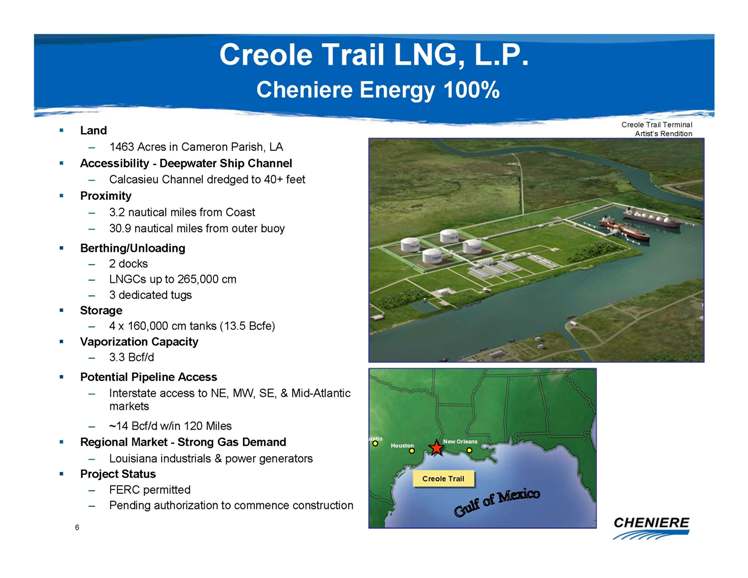
Creole
Trail LNG, L.P. Cheniere Energy 100% ⑀⍽ Land - 1463 Acres in Cameron Parish, LA
⑀⍽ Accessibility - Deepwater Ship Channel - Calcasieu Channel dredged to 40+
feet ⑀⍽ Proximity - 3.2 nautical miles from Coast - 30.9 nautical miles from
outer buoy ⑀⍽ Berthing/Unloading - 2 docks - LNGCs up to 265,000 cm - 3
dedicated tugs ⑀⍽ Storage - 4 x 160,000 cm tanks (13.5 Bcfe) ⑀⍽ Vaporization
Capacity - 3.3 Bcf/d ⑀⍽ Potential Pipeline Access - Interstate access to NE, MW,
SE, & Mid-Atlantic markets - ~14 Bcf/d w/in 120 Miles ⑀⍽ Regional Market -
Strong Gas Demand - Louisiana industrials & power generators ⑀⍽ Project
Status - FERC permitted - Pending auth
orization
to commence construction Creole Trail Terminal Artist’s Rendition Creole Trail
Creole Trail Austin Houston New Orleans
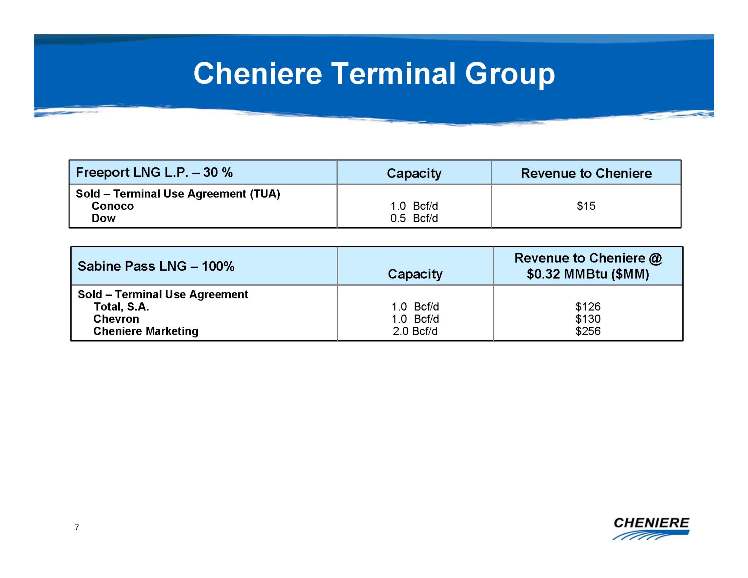
Cheniere
Terminal Group $126 $130 $256 1.0 Bcf/d 1.0 Bcf/d 2.0 Bcf/d Sold - Terminal
Use
Agreement Total, S.A. Chevron Cheniere Marketing Revenue to Cheniere @ $0.32
MMBtu ($MM) Capacity Sabine Pass LNG - 100% $15 1.0 Bcf/d 0.5 Bcf/d Sold
-
Terminal Use Agreement (TUA) Conoco Dow Revenue to Cheniere Capacity Freeport
LNG L.P. - 30 %
Cheniere
Marketing Potential Value of Capacity ⑀⍽ Availability of LNG ⑀⍽ Seasonal flows
and basis differential (natural gas de
mand)
⑀⍽ Availability of regas capacity close to market demand
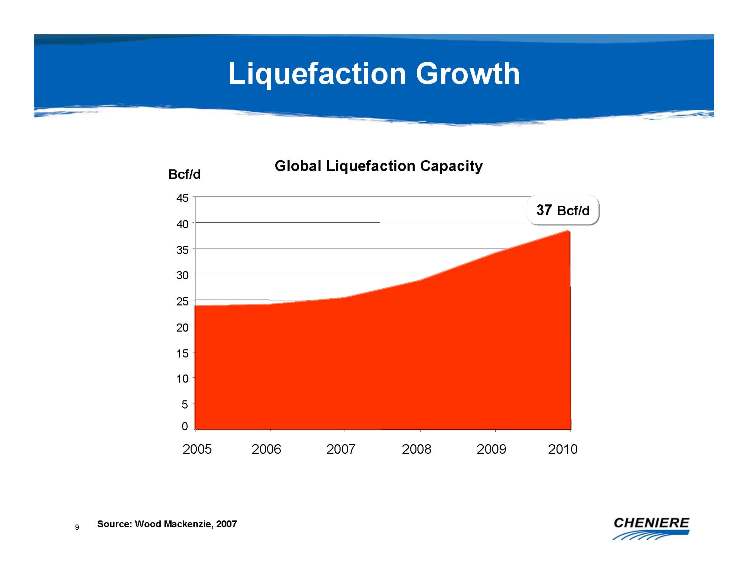
Liquefaction
Growth Source: Wood Mackenzie, 2007 Global Liquefaction Capacity 0 5 10 15
20 25
30 35 40 45 2005 2006 2007 2008 2009 2010 Bcf/d 37 Bcf/d 37 Bcf/d
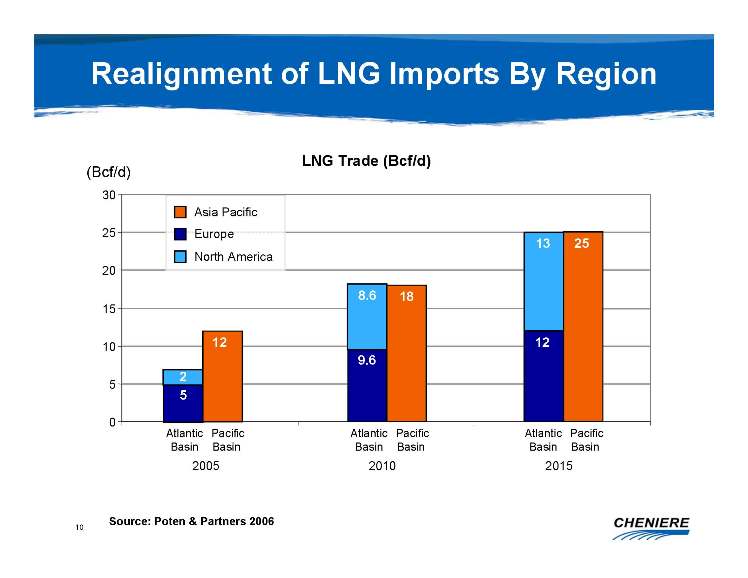
Realignment
of LNG Imports By Region LNG Trade (Bcf/d) (Bcf/d) Asia Pacific Europe North
America 0
5
10 15 20 25 30 Atlantic Basin Pacific Basin 2005 Atlantic Basin Pacific Basin
2010 Atlantic Basin Pacific Basin 2015
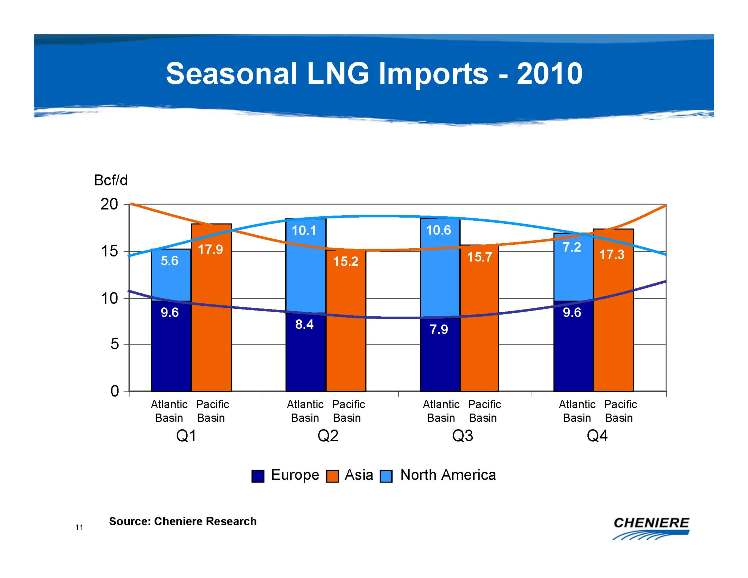
Seasonal
LNG Imports - 2010 15.2 15.7 17.3 0 5 10 15 20 Atlantic Basin Q2 Q3 Q4 Bcf/d
Europe Asia North America 9.6 5.6 8.4 10.1 7.9 10.
6
9.6 7.2 Pacific Basin Atlantic Basin Pacific Basin Atlantic Basin Pacific
Basin
Atlantic Basin Pacific Basin Q1 17.9 Source: Cheniere Research
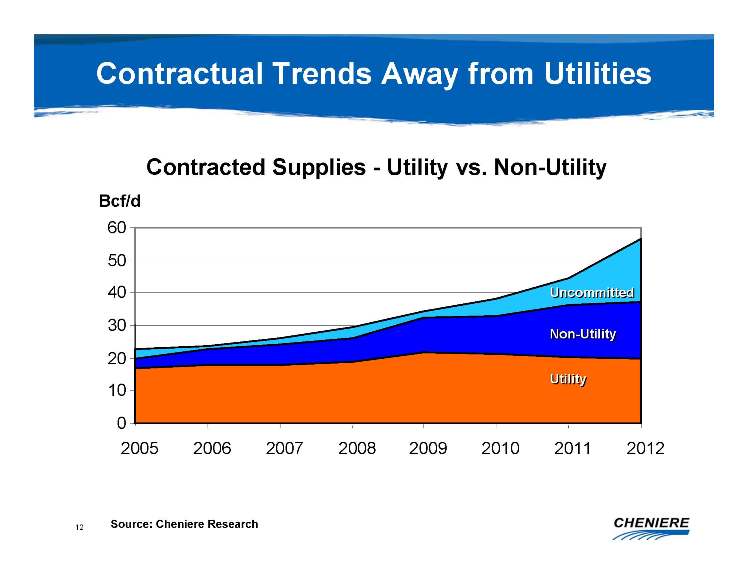
Contractual
Trends Away Contractual from Utilities Source: Cheniere Research
Contracted Supplies - Utility vs. Non
-Utility
0 10 20 30 40 50 60 2005 2006 2007 2008 2009 2010 2011 2012 Bcf/d Non-Utility
Non-Utility Uncommitted Uncommitted Utility Utility
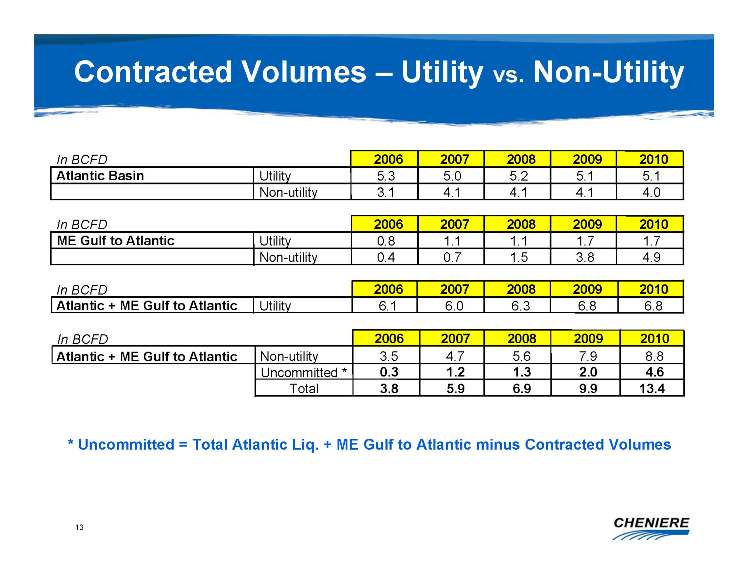
Contracted
Volumes - Utility vs. Non-Utility * Uncommitted = Total Atlantic Liq. + ME
Gulf
to Atlantic minus Contracted Volumes In BCFD 2006 2007 2008 2009 2010 Atlantic
Basin Utility 5.3 5.0 5.2 5.1 5.1 Non-utility 3.1 4.1 4.1 4.1 4.0 In BCFD
2006
2007 2008 2009 2010 ME Gulf to Atlantic Utility 0.8 1.1 1.1 1.7 1.7 Non-utility
0.4 0.7 1.5 3.8 4.9 In BCFD 2006 2007 2008 2009 2010 Atlantic + ME Gulf to
Atlantic Utility 6.1 6.0 6.3 6.8 6.8 In BCFD 2006 2007 2008 2009 2010
Non-utility 3.5 4.7 5.6 7.9 8.8 Uncommitted * 0.3 1.2 1.3 2.0 4.6 Total Atlantic
+ ME Gulf to Atlantic 3.8 5.9 6.9 9.9 13.4
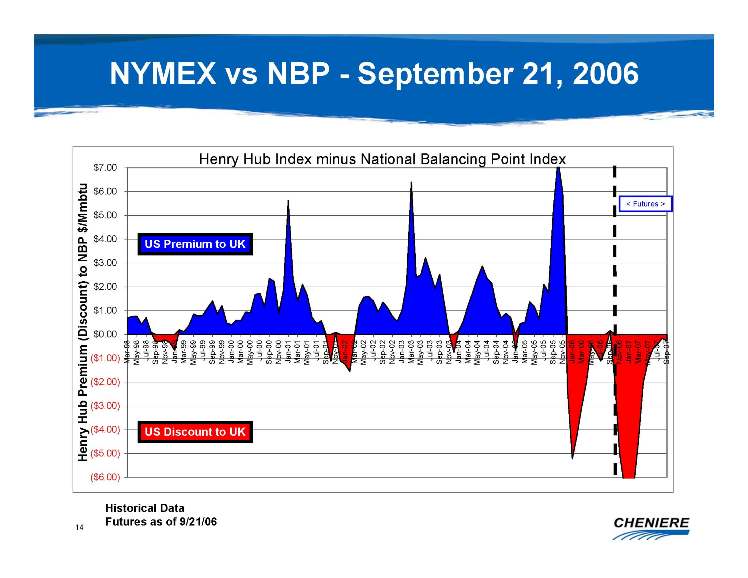
NYMEX
vs NBP - September 21, 2006 Henry Hub Index minus National Balancing Point
Index
($6.00) ($5.00) ($4.00) ($3.00) ($2.00) ($1.00) $0.00 $1.00 $2.00 $3.00 $4.00
$5.00 $6.00 $7.00 Mar-98 May-98 Jul-98 Sep-98 Nov-98 Jan-99 Mar-99 May-99
Jul-99
Sep-99 Nov-99 Jan-00 Mar-00 May-00 Jul-00 Sep-00 Nov-00 Jan-01 Mar-01 May-01
Jul-01 Sep-01 Nov-01 Jan-02 Mar-02 May-02 Jul-02 Sep-02 Nov-02 Jan-03 Mar-03
May-03 Jul-03 Sep-03 Nov-03 Jan-04 Mar-04 May-04 Jul-04 Sep-04 Nov-04 Jan-05
Mar-05 May-05 Jul-05 Sep-05 Nov-05 Jan-06 Mar-06 May-06 Jul-06 Sep-06 Nov-06
Jan-07 Mar-07 May-07 Jul-07 Sep-07 Henry Hub Premium (Discount) to NBP $/Mmbtu
< Futures > US Premium to UK US Discount to UK Historic
al
Data Futures as of 9/21/06
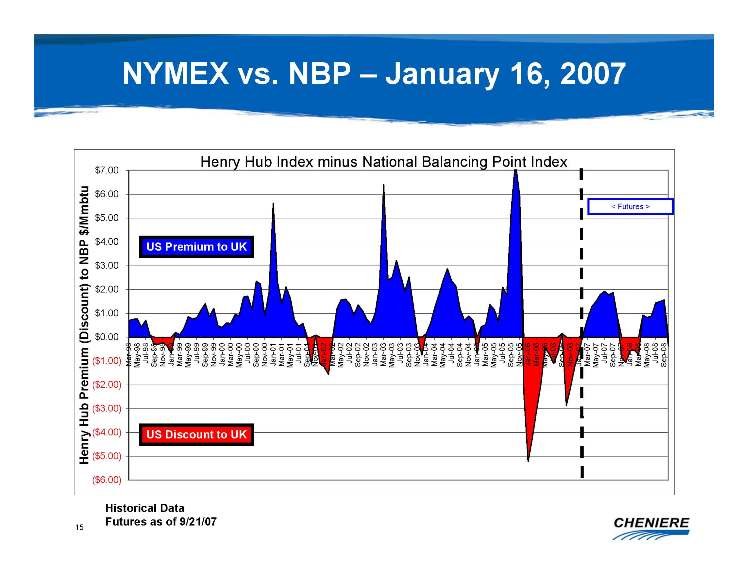
NYMEX
vs. NBP - January 16, 2007 Henry Hub Index minus National Balancing Point
Index
($6.00) ($5.00) ($4.00) ($3.00) ($2.00) ($1.00) $0.00 $1.00 $2.00 $3.00 $4.00
$5.00 $6.00 $7.00 Mar-98 May-98 Jul-98 Sep-98 Nov-98 Jan-99 Mar-99 May-99
Jul-99
Sep-99 Nov-99 Jan-00 Mar-00 May-00 Jul-00 Sep-00 Nov-00 Jan-01 Mar-01 May-01
Jul-01 Sep-01 Nov-01 Jan-02 Mar-02 May-02 Jul-02 Sep-02 Nov-02 Jan-03 Mar-03
May-03 Jul-03 Sep-03 Nov-03 Jan-04 Mar-04 May-04 Jul-04 Sep-04 Nov-04 Jan-05
Mar-05 May-05 Jul-05 Sep-05 Nov-05 Jan-06 Mar-06 May-06 Jul-06 Sep-06 Nov-06
Jan-07 Mar-07 May-07 Jul-07 Sep-07 Nov-07 Jan-08 Mar-08 May-08 Jul-08 Sep-08
Henry Hub Premium (Discount) to NBP $
/Mmbtu
< Futures > US Premium to UK Historical Data Futures as of 9/21/07
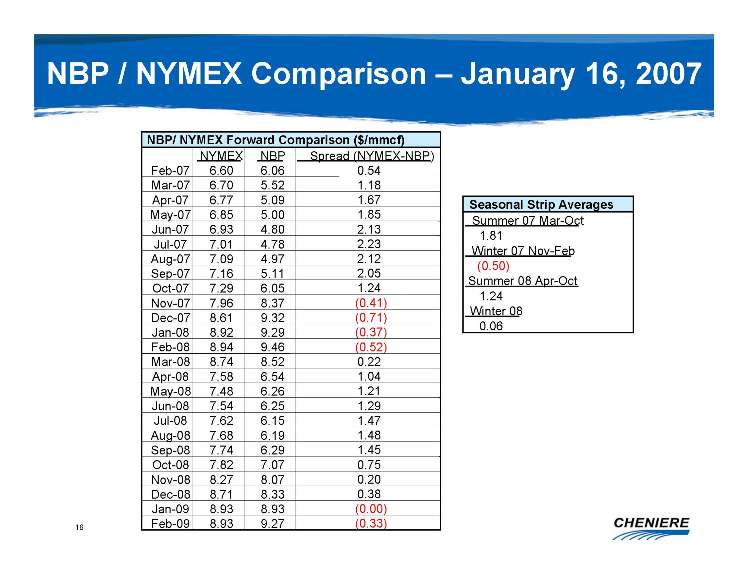
NBP
/ NYMEX Comparison - January 16, 2007 Seasonal Strip Averages Summer 07 Mar-Oct
1.81 Winter 07 Nov-Feb (0.50) Summer 08 Apr-Oct 1.24 Winter 08 0.06 NBP/
NYMEX
Forward Comparison ($/mmcf) NYMEX NBP Spread (NYMEX-NBP) Feb-07 6.60 6.06
Mar-07
6.70 5.52 Apr-07 6.77 5.09 May-07 6.85 5.00 Jun-07 6.93 4.80 Jul-07 7.01
4.78
Aug-07 7.09 4.97 Sep-07 7.16 5.11 Oct-07 7.29 6.05 Nov-07 7.96 8.37 Dec-07
8.61
9.32 Jan-08 8.92 9.29 Feb-08 8.94 9.46 Mar-08 8.74 8.52 Apr-08 7.58 6.54
May-08
7.48 6.26 Jun-08 7.54 6.25 Jul-08 7.62 6.15 Aug-08 7.68 6.19 Sep-08 7.74
6.29
Oct-08 7.82 7.07 Nov-08 8.27 8.07 Dec-08 8.71 8.33 Jan-09 8.93 8.93 Feb-09
8.9
3
9.27 (0.00) (0.33) 1.45 0.75 0.20 0.38 1.21 1.29 1.47 1.48 (0.37) (0.52)
0.22
1.04 2.05 1.24 (0.41) (0.71) 1.85 2.13 2.23 2.12 0.54 1.18 1.67
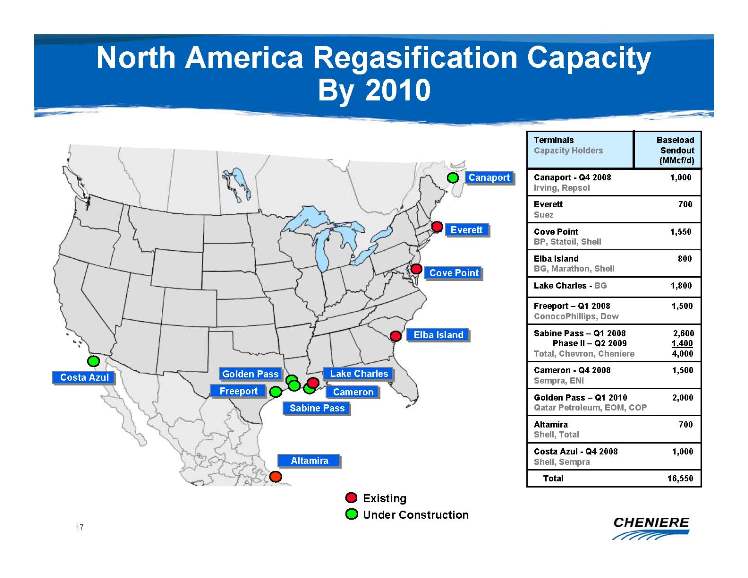
North
America Regasification Capacity By 2010 Altamira 700 Shell, Total Costa Azul
-
Q4 2008 1,000 Shell, Sempra Canaport - Q4 2008 1,000 Irving, Repsol Total
16,550
Golden Pass - Q1 2010 2,000 Qatar Petroleum, EOM, COP Cameron - Q4 2008 1,500
Sempra, ENI Sabine Pass - Q1 2008 2,600 Phase II - Q2 2009 1,400 Total, Chevron,
Cheniere 4,000 Freeport - Q1 2008 1,500 ConocoPhillips, Dow Lake Charles
- BG
1,800 Elba Island 800 BG, Marathon, She
ll
Cove Point 1,550 BP, Statoil, Shell Everett 700 Sue Existing Under Construction
Retained
Capacity ⑀⍽ Merchant activities are necessary to deal with seasonality ⑀⍽ Gulf
Coast is “backstop” for merchant activities ⑀⍽ Can accommodate lar
ge
quantities of baseload capacity
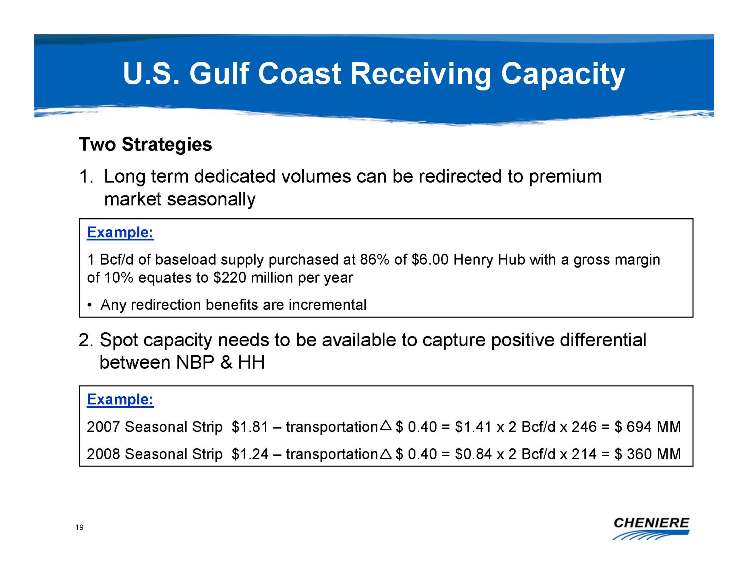
U.S.
Gulf Coast Receiving Capacity Example: 1 Bcf/d of baseload supply purchased
at
86% of $6.00 Henry Hub with a gross margin of 10% equates to $220 million
per
year • Any redirection benefits are incremental Two Strategies 1. Long term
dedicated volumes can be redirected to premium market seasonally 2. Spot
capacity needs to be available to capture positive differential between NBP
& HH Example: 2007
Seasonal
Strip $1.81 - transportation $ 0.40 = $1.41 x 2 Bcf/d x 246 = $ 694 MM 2008
Seasonal Strip $1.24 - transportation $ 0.40 = $0.84 x 2 Bcf/d x 214 = $
360 MM
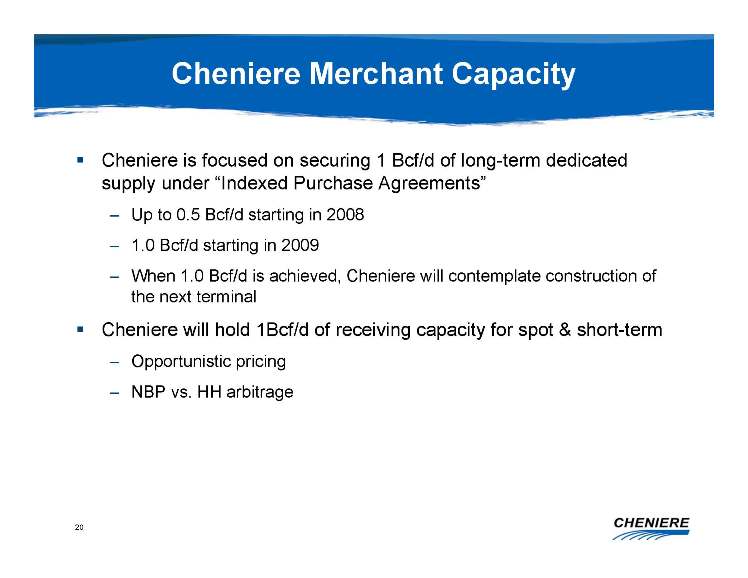
Cheniere
Merchant Capacity ⑀⍽ Cheniere is focused on securing 1 Bcf/d of long-term
dedicated supply under “Indexed Purchase Agreements” - Up to 0.5 Bcf/d starting
in 2008 - 1.0 Bcf/d starting in 2009 - When 1.0 Bcf/d is achieved, Cheniere
will
contemplate construction of the next terminal ⑀⍽ Cheniere will hold 1Bcf/d of
receiving capacity for spot & short-term - Opportunistic pricing - NBP vs.
HH arbitrage
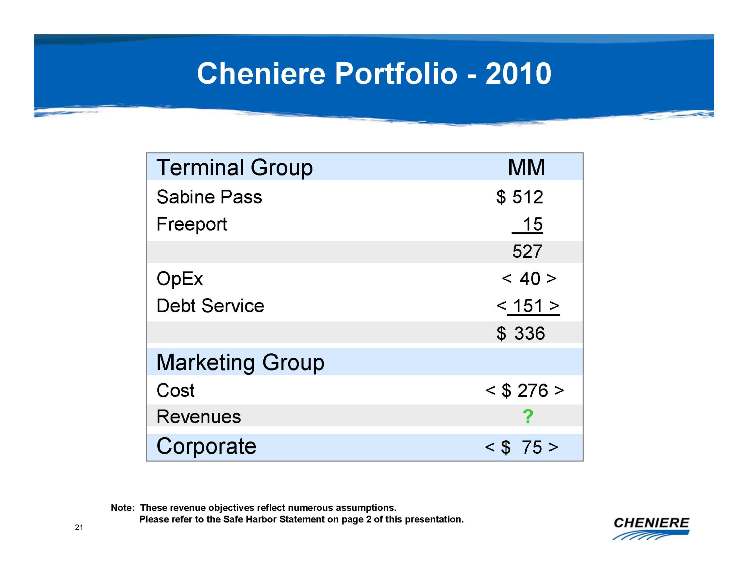
Terminal
Group MM Sabine Pass $ 512 Freeport 15 527 OpEx < 40 > Debt Service <
151 > $ 336 Marketing Group Cost < $ 276 > Revenues ? Corporate < $
75 > Note: These revenue objectives reflect numerous assumptions. Please
refer to the Safe Harbor Statement on page 2 of this
presentation.