Exhibit
99.1
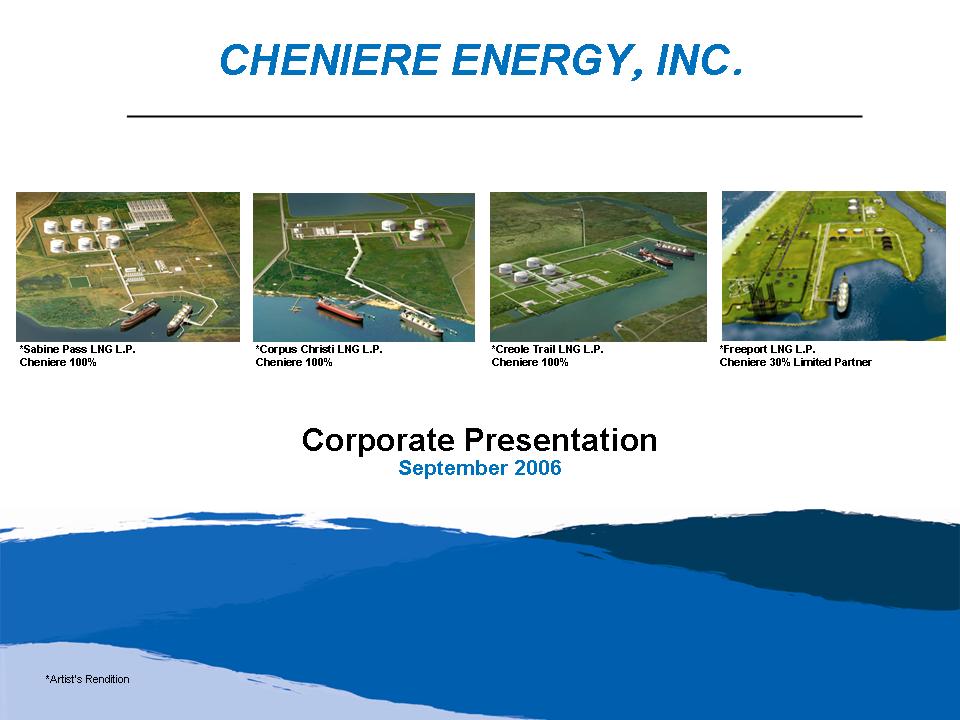
Corporate
Presentation September 2006 CHENIERE ENERGY ,INC . *Corpus Christi LNG L.P.
Cheniere 100% *Artist’s Rendition *Creole Trail LNG L.P. Cheniere 100% *Sabine
Pass LNG L.P. Cheniere 100% *Freeport LNG L.P. Cheniere 30% Limited
Partner
2
This presentation contains certain statements that are, or may be deemed to
be,
“forward-looking statements” within the meaning of Section 27A of the Securities
Act and Section 21E of the Securities Exchange Act of 1934, as amended, or
the
Exchange Act. All statements, other than statements of historical facts,
included herein are “forward-looking statements.” Included among
“forward-looking statements” are, among other things: ⑀⍽ statements that we
expect to commence or complete construction of each or any of our proposed
liquefied natural gas, or LNG, receiving terminals by certain dates, or at
all;
⑀⍽ statements that we expect to receive Draft Environmental Impact Statements
or
Final Environmental Impact Statements from the Federal Energy Regulatory
Commission, or FERC, by certain dates, or at all, or that we expect to receive
an order from FERC authorizing us to construct and operate proposed LNG
receiving terminals by a certain date, or at all; ⑀⍽ statements regarding future
levels of domestic natural gas production and consumption, or the future level
of LNG imports into North America, or regarding projected future capacity of
liquefaction or regasification facilities worldwide regardless of the source
of
such information; ⑀⍽ statements regarding any financing transactions or
arrangements, whether on the part of Cheniere or at the project level; ⑀⍽
statements relating to the construction of our proposed LNG receiving terminals,
including statements concerning estimated costs, and the engagement of any
EPC
contractor; ⑀⍽ statements regarding any Terminal Use Agreement, or TUA, or other
commercial arrangements presently contracted, optioned, marketed or potential
arrangements to be performed substantially in the future, including any cash
distributions and revenues anticipated to be received; statements regarding
the
commercial terms and potential revenues from Targeted Long-Term Agreements
described in this presentation; ⑀⍽ statements regarding the commercial terms or
potential revenue from any arrangements which may arise from the marketing
of
uncommitted capacity from any of the terminals, including the Creole Trail
and
Corpus Christi terminals which do not currently have contractual commitments;
⑀⍽
statements regarding the commercial terms or potential revenue from any
arrangement relating to the proposed contracting for excess or expansion
capacity for the Sabine Pass LNG Terminal or the Indexed Purchase Agreement
(“IPA’s”) Examples described in this presentation; ⑀⍽ statements that our
proposed LNG receiving terminals, when completed, will have certain
characteristics, including amounts of regasification and storage capacities,
a
number of storage tanks and docks and pipeline interconnections; ⑀⍽ statements
regarding Cheniere and Cheniere Marketing forecasts, and any potential revenues
and capital expenditures which may be derived from either of Cheniere Energy’s
business groups; ⑀⍽ statements regarding Cheniere Pipeline Company, and the
capital expenditures and potential revenues related to this business group;
statements regarding our proposed LNG receiving terminals’ access to existing
pipelines, and their ability to obtain transportation capacity on existing
pipelines; ⑀⍽ statements regarding possible expansions of the currently
projected size of any of our proposed LNG receiving terminals; ⑀⍽ statements
regarding our business strategy, our business plan or any other plans,
forecasts, examples, models, forecasts or objectives; and ⑀⍽ any other
statements that relate to non-historical information. These forward-looking
statements are often identified by the use of terms and phrases such as
“achieve,” “anticipate,” “believe,” “estimate,” “example,” “expect,” “forecast,”
“opportunities,” “plan,” “potential,” “project,” “propose,” “subject to,” and
similar terms and phrases. Although we believe that the expectations reflected
in these forward-looking statements are reasonable, they do involve assumptions,
risks and uncertainties, and these expectations may prove to be incorrect.
You
should not place undue reliance on these forward-looking statements, which
speak
only as of the date of this presentation. Our actual results could differ
materially from those anticipated in these forward-looking statements as a
result of a variety of factors, including those discussed in “Risk Factors” in
the Cheniere Energy, Inc. Annual Report on Form 10-K for the year ended December
31, 2005, which are incorporated by reference into this presentation. All
forward-looking statements attributable to us or persons acting on our behalf
are expressly qualified in their entirety by these ”Risk Factors”. These
forward-looking statements are made as of the date of this presentation. Safe
Harbor Act
3
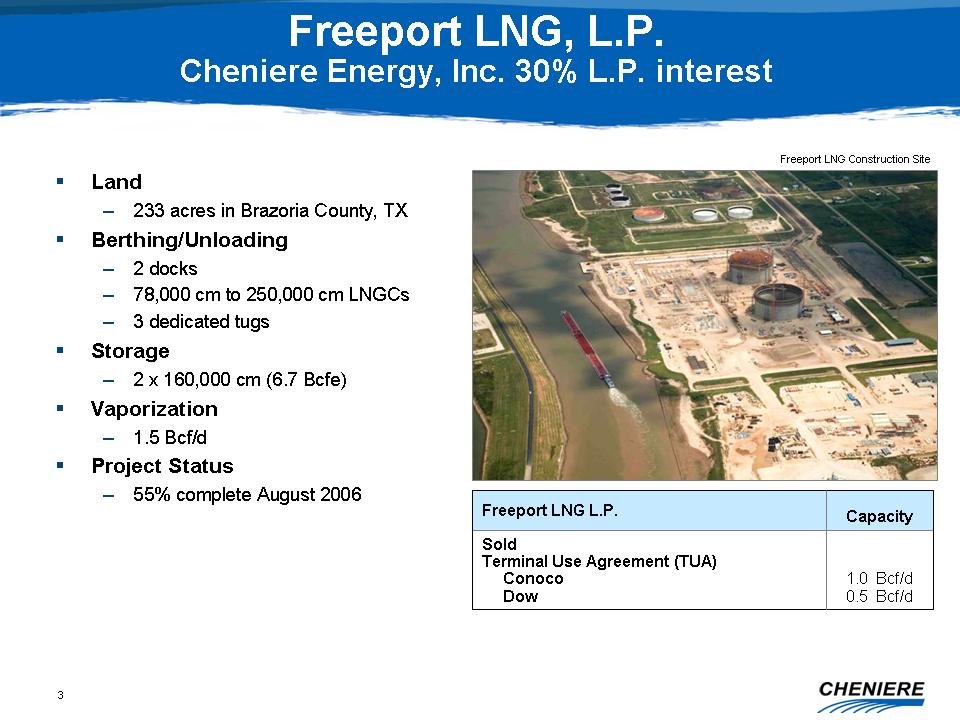
Freeport LNG, L.P. Cheniere Energy, Inc. 30% L.P. interest ⑀⍽ Land - 233 acres
in Brazoria County, TX ⑀⍽ Berthing/Unloading - 2 docks - 78,000 cm to 250,000 cm
LNGCs - 3 dedicated tugs ⑀⍽ Storage - 2 x 160,000 cm (6.7 Bcfe) ⑀⍽ Vaporization
- 1.5 Bcf/d ⑀⍽ Project Status - 55% complete August 2006 Freeport LNG
Construction Site 1.0 Bcf/d 0.5 Bcf/d Sold Terminal Use Agreement (TUA) Conoco
Dow Capacity Freeport LNG L.P.
4
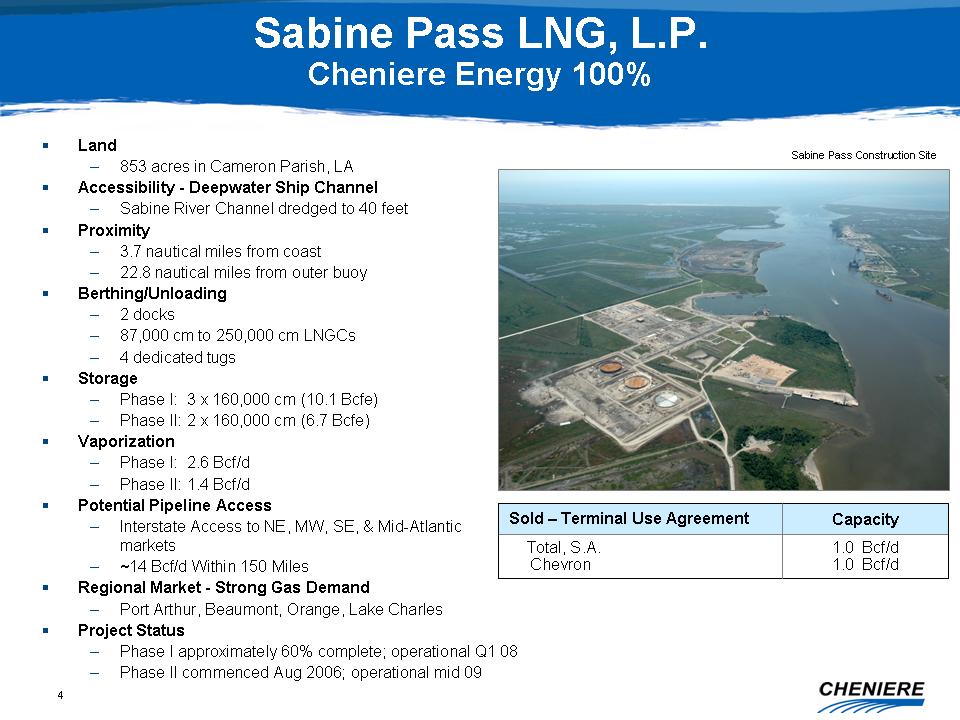
Sabine Pass LNG, L.P. Cheniere Energy 100% ⑀⍽ Land - 853 acres in Cameron
Parish, LA ⑀⍽ Accessibility - Deepwater Ship Channel - Sabine River Channel
dredged to 40 feet ⑀⍽ Proximity - 3.7 nautical miles from coast - 22.8 nautical
miles from outer buoy ⑀⍽ Berthing/Unloading - 2 docks - 87,000 cm to 250,000 cm
LNGCs - 4 dedicated tugs ⑀⍽ Storage - Phase I: 3 x 160,000 cm (10.1 Bcfe) -
Phase II: 2 x 160,000 cm (6.7 Bcfe) ⑀⍽ Vaporization - Phase I: 2.6 Bcf/d - Phase
II: 1.4 Bcf/d ⑀⍽ Potential Pipeline Access - Interstate Access to NE, MW, SE,
& Mid-Atlantic markets - ~14 Bcf/d Within 150 Miles ⑀⍽ Regional Market -
Strong Gas Demand - Port Arthur, Beaumont, Orange, Lake Charles ⑀⍽ Project
Status - Phase I approximately 60% complete; operational Q1 08 - Phase II
commenced Aug 2006; operational mid 09 Sabine Pass Construction Site 1.0
Bcf/d
1.0 Bcf/d Total, S.A. Chevron Capacity Sold - Terminal Use
Agreement
5
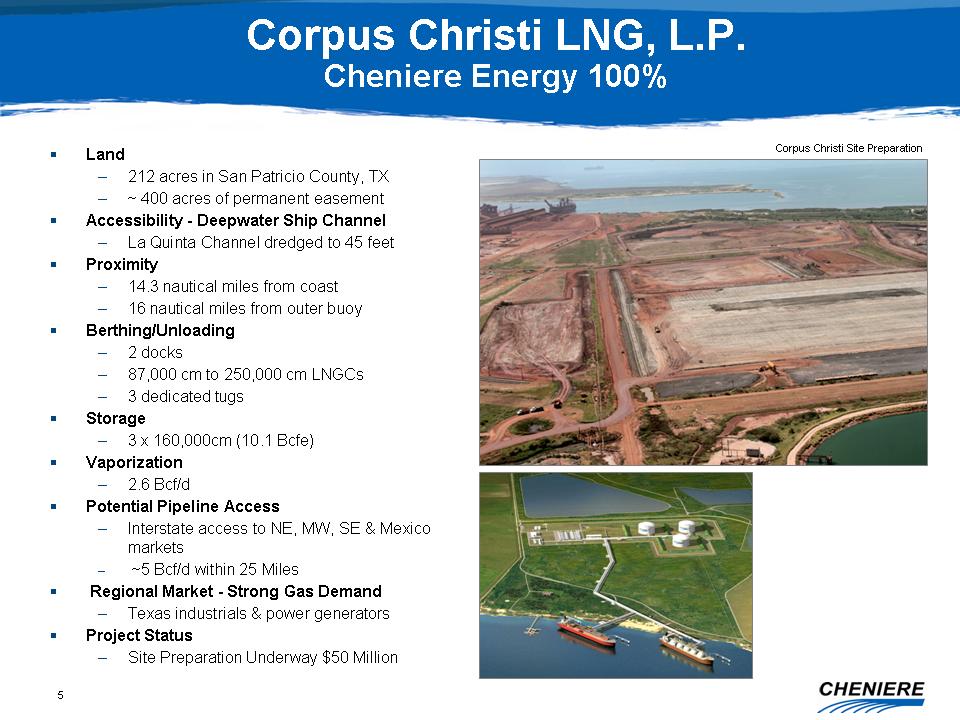
Corpus Christi LNG, L.P. Cheniere Energy 100% ⑀⍽ Land - 212 acres in San
Patricio County, TX - ~ 400 acres of permanent easement ⑀⍽ Accessibility -
Deepwater Ship Channel - La Quinta Channel dredged to 45 feet ⑀⍽ Proximity -
14.3 nautical miles from coast - 16 nautical miles from outer buoy ⑀⍽
Berthing/Unloading - 2 docks - 87,000 cm to 250,000 cm LNGCs - 3 dedicated
tugs
⑀⍽ Storage - 3 x 160,000cm (10.1 Bcfe) ⑀⍽ Vaporization - 2.6 Bcf/d ⑀⍽ Potential
Pipeline Access - Interstate access to NE, MW, SE & Mexico markets - ~5
Bcf/d within 25 Miles ⑀⍽ Regional Market - Strong Gas Demand - Texas industrials
& power generators ⑀⍽ Project Status - Site Preparation Underway $50 Million
Corpus Christi Site Preparation
6
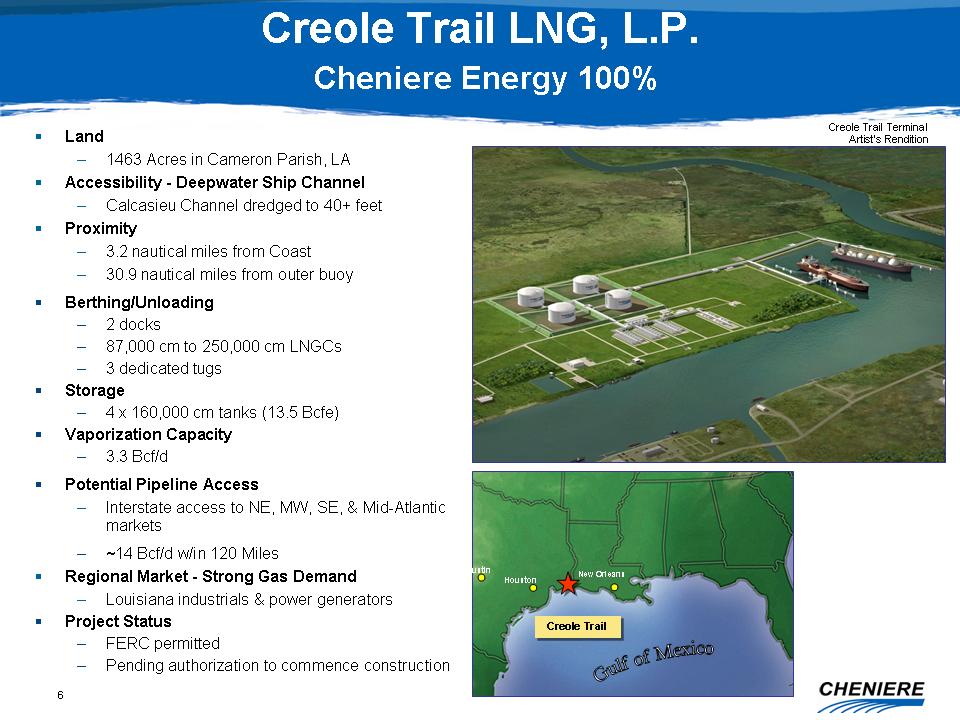
Creole Trail LNG, L.P. Cheniere Energy 100% ⑀⍽ Land - 1463 Acres in Cameron
Parish, LA ⑀⍽ Accessibility - Deepwater Ship Channel - Calcasieu Channel dredged
to 40+ feet ⑀⍽ Proximity - 3.2 nautical miles from Coast - 30.9 nautical miles
from outer buoy ⑀⍽ Berthing/Unloading - 2 docks - 87,000 cm to 250,000 cm LNGCs
- 3 dedicated tugs ⑀⍽ Storage - 4 x 160,000 cm tanks (13.5 Bcfe) ⑀⍽ Vaporization
Capacity - 3.3 Bcf/d ⑀⍽ Potential Pipeline Access - Interstate access to NE, MW,
SE, & Mid-Atlantic markets - ~14 Bcf/d w/in 120 Miles ⑀⍽ Regional Market -
Strong Gas Demand - Louisiana industrials & power generators ⑀⍽ Project
Status - FERC permitted - Pending authorization to commence construction
Creole
Trail Terminal Artist’s Rendition Creole Trail Creole Trail Austin Houston New
Orleans
7
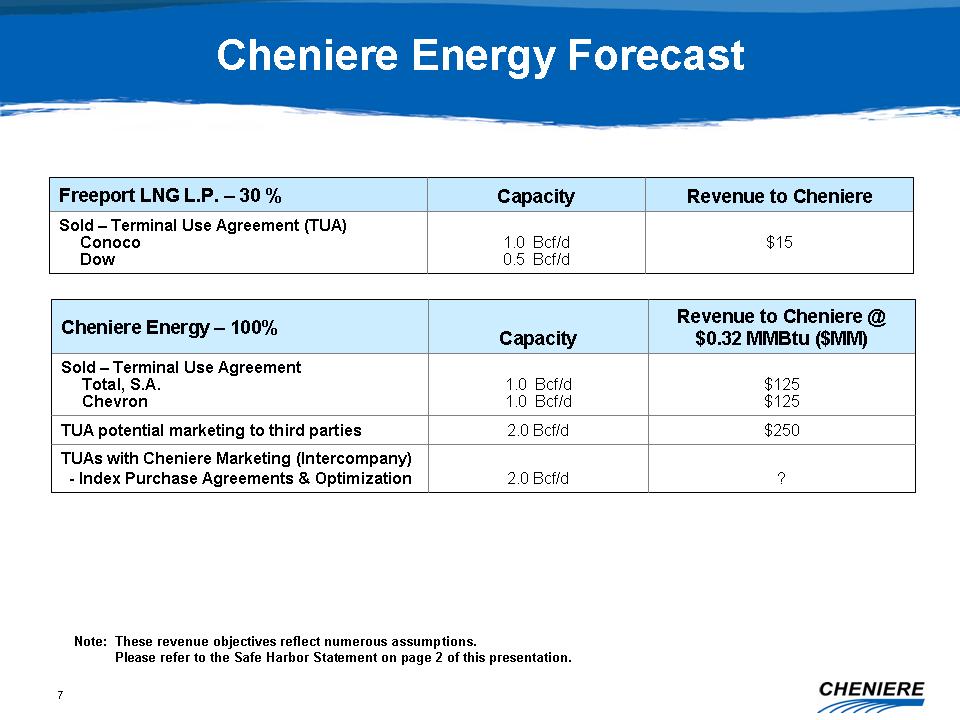
Cheniere Energy Forecast Note: These revenue objectives reflect numerous
assumptions. Please refer to the Safe Harbor Statement on page 2 of this
presentation. $125 $125 1.0 Bcf/d 1.0 Bcf/d Sold - Terminal Use Agreement
Total,
S.A. Chevron $250 2.0 Bcf/d TUA potential marketing to third parties ? Revenue
to Cheniere @ $0.32 MMBtu ($MM) 2.0 Bcf/d TUAs with Cheniere Marketing
(Intercompany) - Index Purchase Agreements & Optimization Capacity Cheniere
Energy - 100% $15 1.0 Bcf/d 0.5 Bcf/d Sold - Terminal Use Agreement (TUA)
Conoco
Dow Revenue to Cheniere Capacity Freeport LNG L.P. - 30 %
Potential
Value of Spare Capacity
9
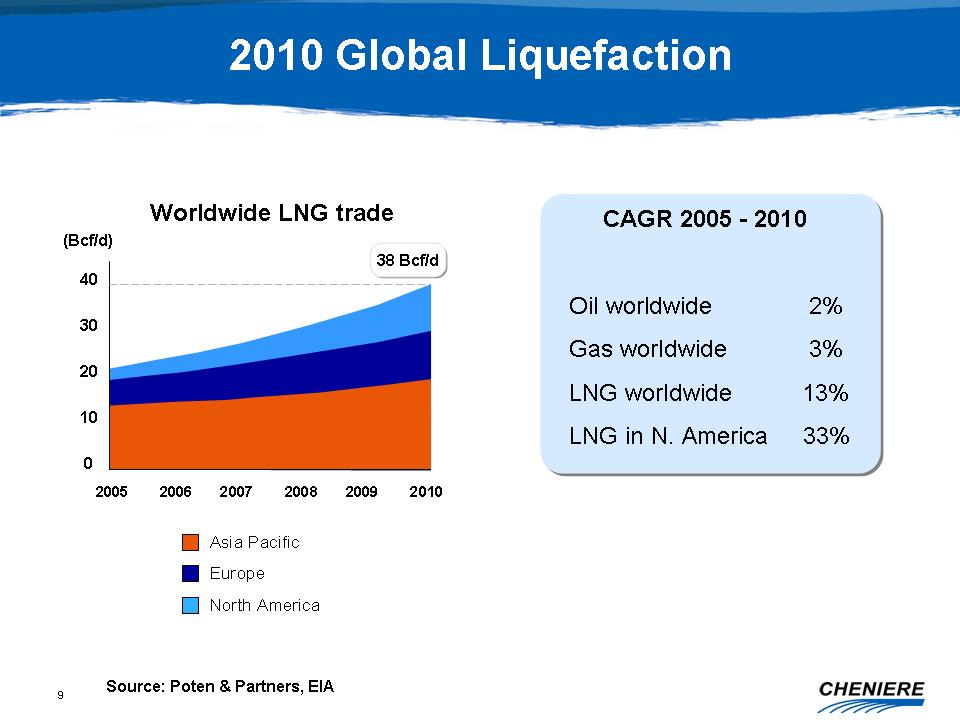
2010 Global Liquefaction 40 30 20 10 0 (Bcf/d) 2005 2006 2007 2008 2009 2010
Source: Poten & Partners, EIA CAGR 2005 - 2010 Oil worldwide 2% Gas
worldwide 3% LNG worldwide 13% LNG in N. America 33% Worldwide LNG trade
Asia
Pacific Europe North America 38 Bcf/d 38 Bcf/d
10
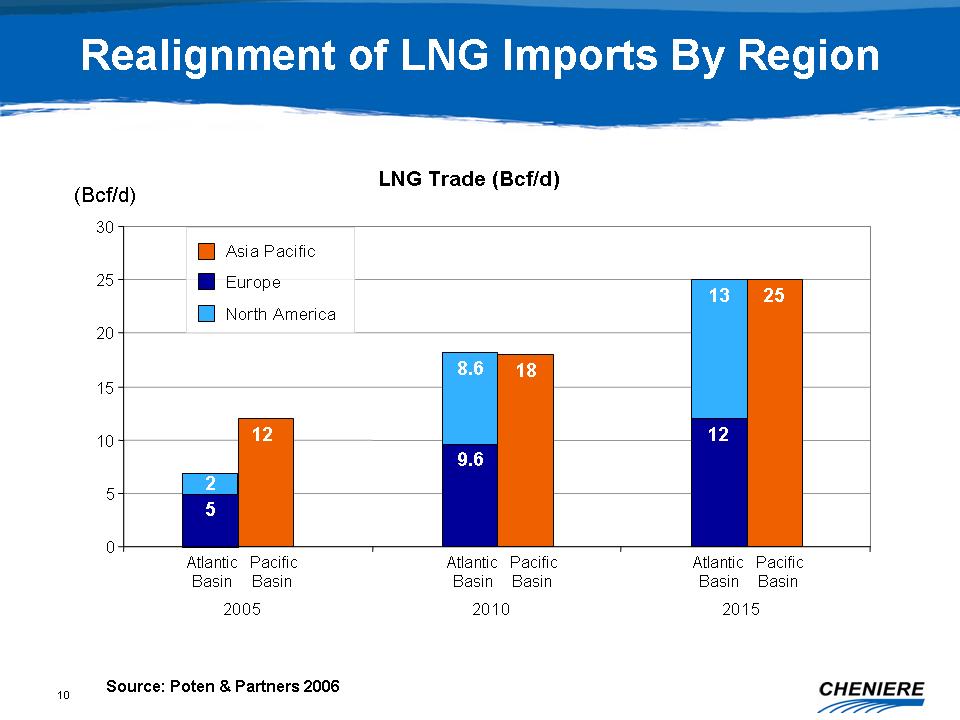
12 18 25 5 9.6 12 2 8.6 13 0 5 10 15 20 25 30 2005 2010 2015 Source: Poten
&
Partners 2006 LNG Trade (Bcf/d) Realignment of LNG Imports By Region (Bcf/d)
Asia Pacific Europe North America Atlantic Basin Pacific Basin Atlantic Basin
Pacific Basin Atlantic Basin Pacific Basin
11
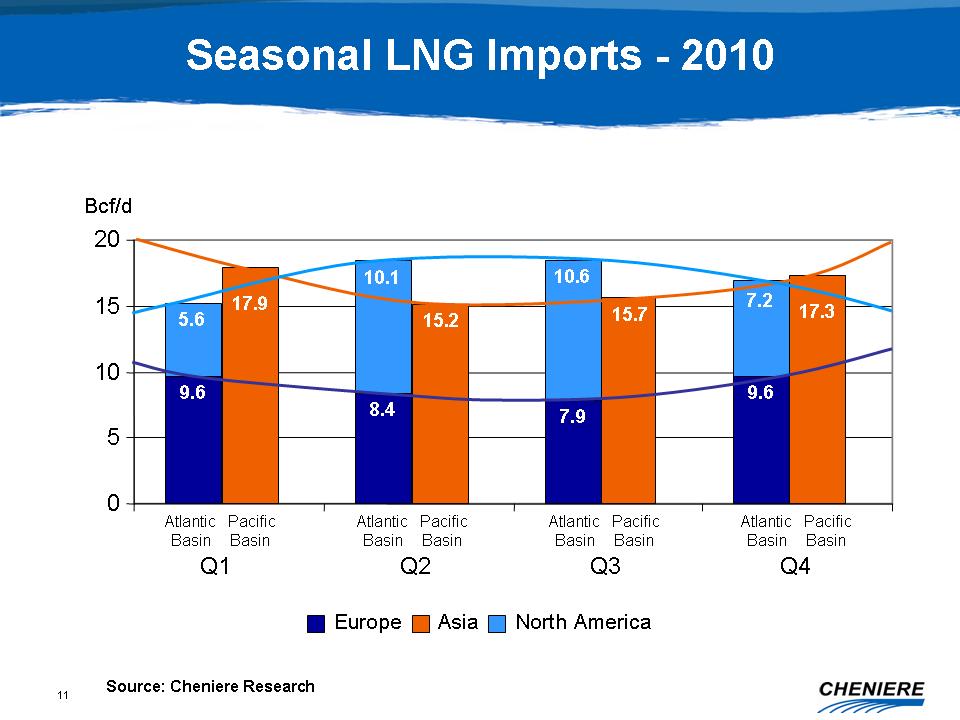
Seasonal LNG Imports - 2010 15.2 15.7 17.3 0 5 10 15 20 Atlantic Basin Q2
Q3 Q4
Bcf/d Europe Asia North America 9.6 5.6 8.4 10.1 7.9 10.6 9.6 7.2 Pacific
Basin
Atlantic Basin Pacific Basin Atlantic Basin Pacific Basin Atlantic Basin
Pacific
Basin Q1 17.9 Source: Cheniere Research
12
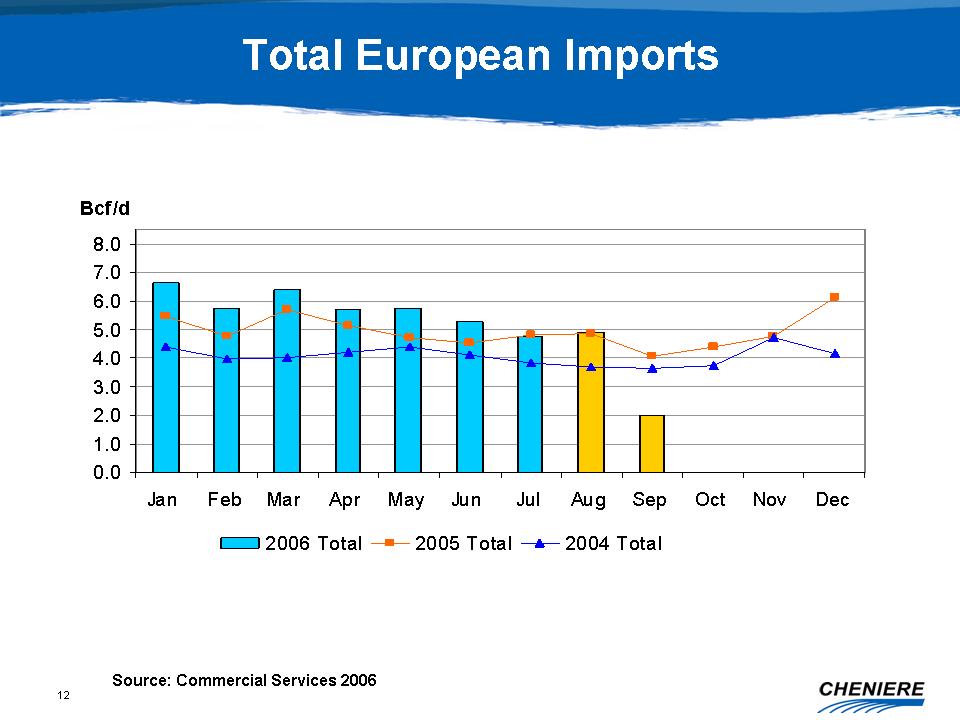
Europe Total Imports 0.0 1.0 2.0 3.0 4.0 5.0 6.0 7.0 8.0 Jan Feb Mar Apr
May Jun
Jul Aug Sep Oct Nov Dec Bcf/d 2006 Total 2005 Total 2004 Total Total European
Imports Source: Commercial Services 2006
13
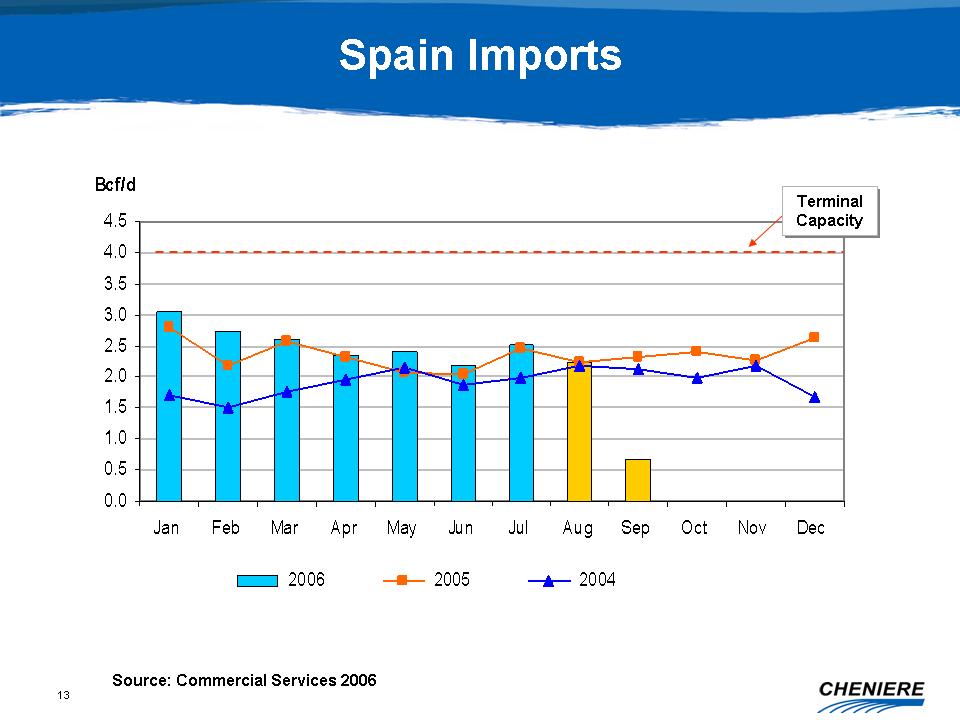
Spain Imports Source: Commercial Services 2006 0.0 0.5 1.0 1.5 2.0 2.5 3.0
3.5
4.0 4.5 Jan Feb Mar Apr May Jun Jul Aug Sep Oct Nov Dec Bcf/d 2006 Total
2005
Total 2004 Total Terminal Capacity Terminal Capacity
14
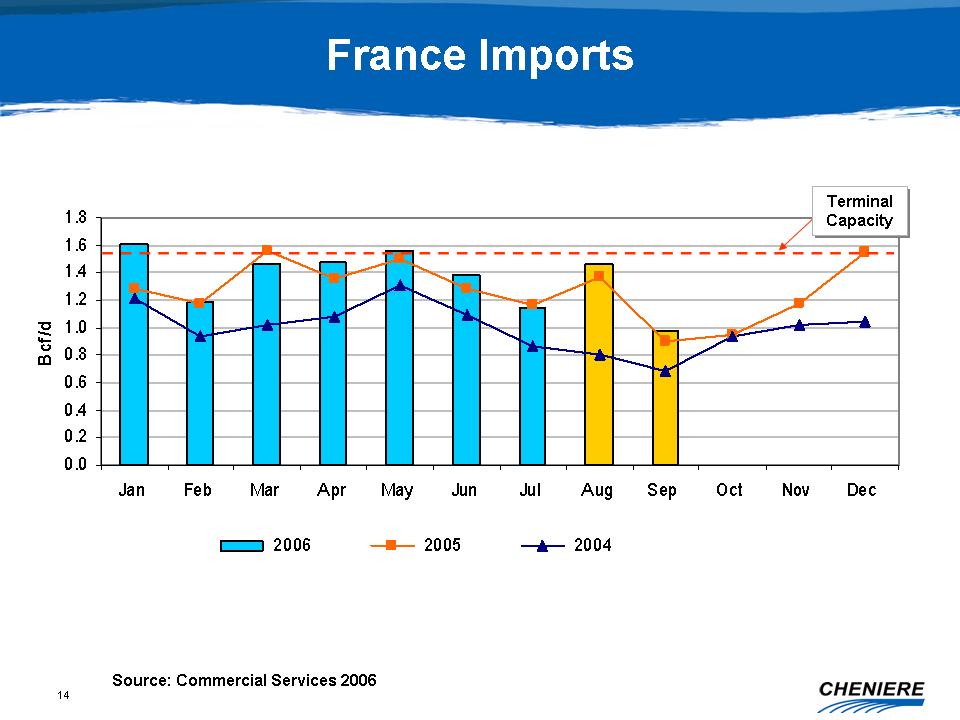
France Imports Source: Commercial Services 2006 France Total Imports 0.0
0.2 0.4
0.6 0.8 1.0 1.2 1.4 1.6 1.8 Jan Feb Mar Apr May Jun Jul Aug Sep Oct Nov Dec
Bcf/d 2006 Total 2005 Total 2004 Total Terminal Capacity Terminal
Capacity
15
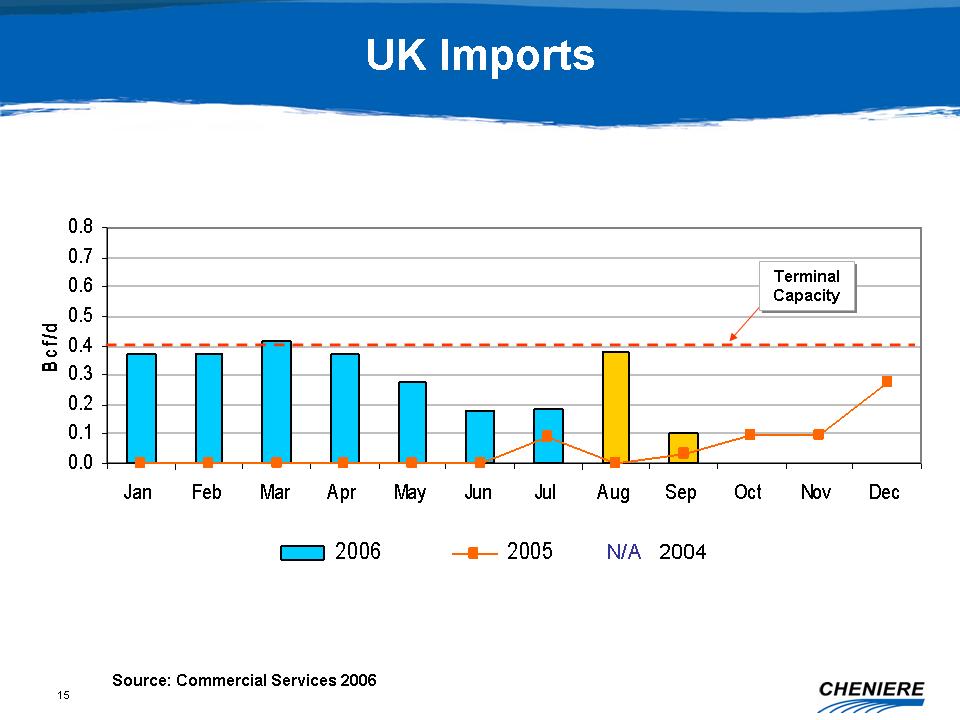
UK Imports Source: Commercial Services 2006 UK Isle of Grain Imports 0.0
0.1 0.2
0.3 0.4 0.5 0.6 0.7 0.8 Jan Feb Mar Apr May Jun Jul Aug Sep Oct Nov Dec Bcf/d
2006 Total 2005 Total Terminal Capacity Terminal Capacity N/A
2004
16
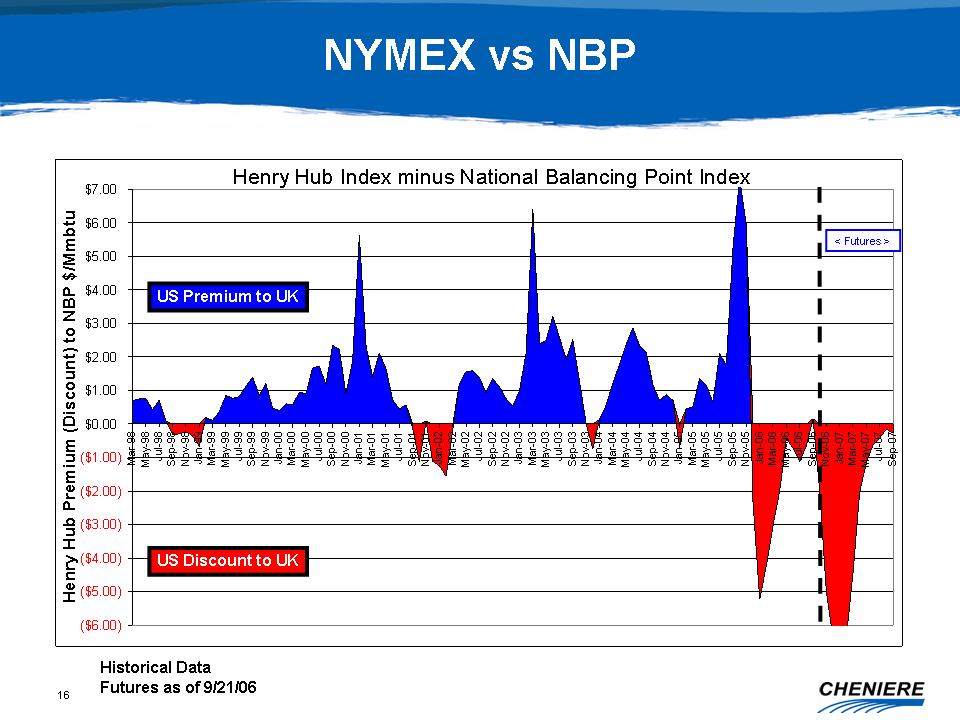
Henry Hub Index minus National Balancing Point Index ($6.00) ($5.00) ($4.00)
($3.00) ($2.00) ($1.00) $0.00 $1.00 $2.00 $3.00 $4.00 $5.00 $6.00 $7.00 Mar-98
May-98 Jul-98 Sep-98 Nov-98 Jan-99 Mar-99 May-99 Jul-99 Sep-99 Nov-99 Jan-00
Mar-00 May-00 Jul-00 Sep-00 Nov-00 Jan-01 Mar-01 May-01 Jul-01 Sep-01 Nov-01
Jan-02 Mar-02 May-02 Jul-02 Sep-02 Nov-02 Jan-03 Mar-03 May-03 Jul-03 Sep-03
Nov-03 Jan-04 Mar-04 May-04 Jul-04 Sep-04 Nov-04 Jan-05 Mar-05 May-05 Jul-05
Sep-05 Nov-05 Jan-06 Mar-06 May-06 Jul-06 Sep-06 Nov-06 Jan-07 Mar-07 May-07
Jul-07 Sep-07 Henry Hub Premium (Discount) to NBP $/Mmbtu < Futures > US
Premium to UK US Discount to UK NYMEX vs NBP Historical Data Futures as of
9/21/06
17
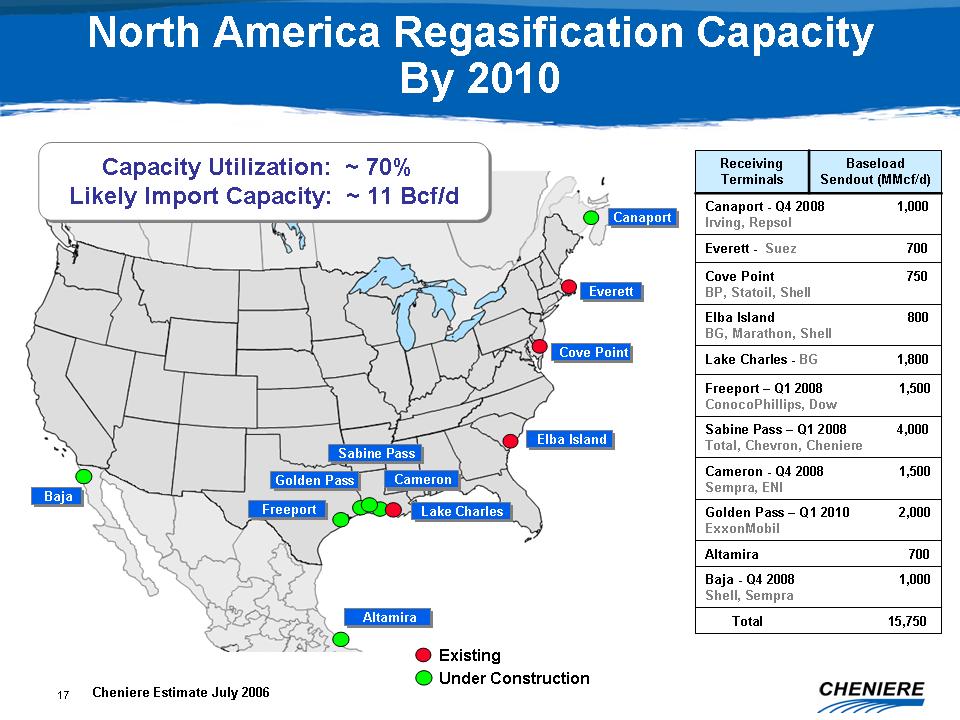
Cheniere Estimate July 2006 North America Regasification Capacity By 2010
Capacity Utilization: ~ 70% Likely Import Capacity: ~ 11 Bcf/d Capacity
Utilization: ~ 70% Likely Import Capacity: ~ 11 Bcf/d Everett Everett Cove
Point
Cove Point Elba Island Elba Island Lake Charles Lake Charles Sabine Pass
Sabine
Pass Freeport Freeport Golden Pass Golden Pass Cameron Cameron Baja Baja
Canaport Canaport Altamira 700 Baja - Q4 2008 1,000 Shell, Sempra Canaport
- Q4
2008 1,000 Irving, Repsol Total 15,750 Golden Pass - Q1 2010 2,000 ExxonMobil
Cameron - Q4 2008 1,500 Sempra, ENI Sabine Pass - Q1 2008 4,000 Total, Chevron,
Cheniere Freeport - Q1 2008 1,500 ConocoPhillips, Dow Lake Charles - BG 1,800
Elba Island 800 BG, Marathon, Shell Cove Point 750 BP, Statoil, Shell Everett
-
Suez 700 Baseload Sendout (MMcf/d) Receiving Terminals Existing Under
Construction Altamira Altamira
18
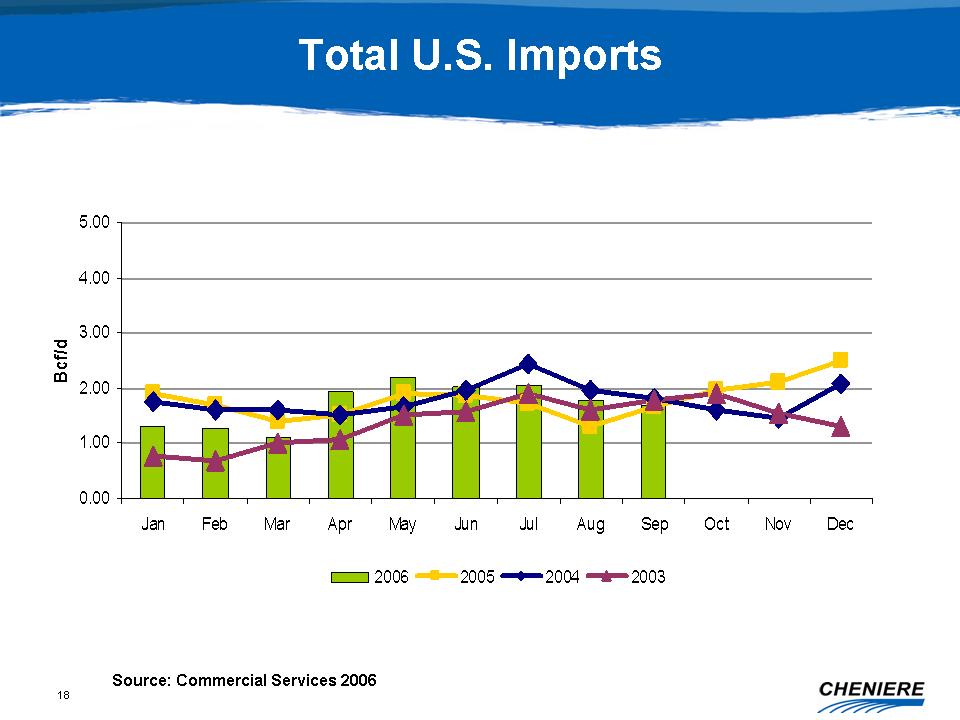
0.00 1.00 2.00 3.00 4.00 5.00 Jan Feb Mar Apr May Jun Jul Aug Sep Oct Nov
Dec
Bcf/d 2006 2005 2004 2003 Total U.S. Imports Source: Commercial Services
2006
19
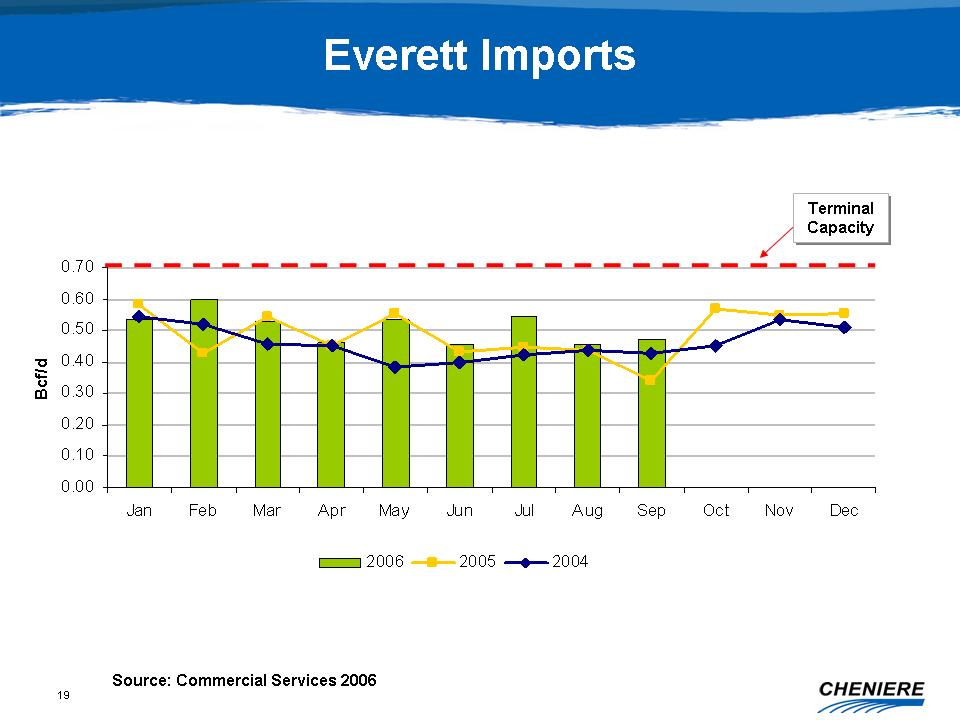
0.00 0.10 0.20 0.30 0.40 0.50 0.60 0.70 Jan Feb Mar Apr May Jun Jul Aug Sep
Oct
Nov Dec Bcf/d 2006 2005 2004 Everett Imports Source: Commercial Services
2006
Terminal Capacity Terminal Capacity
20
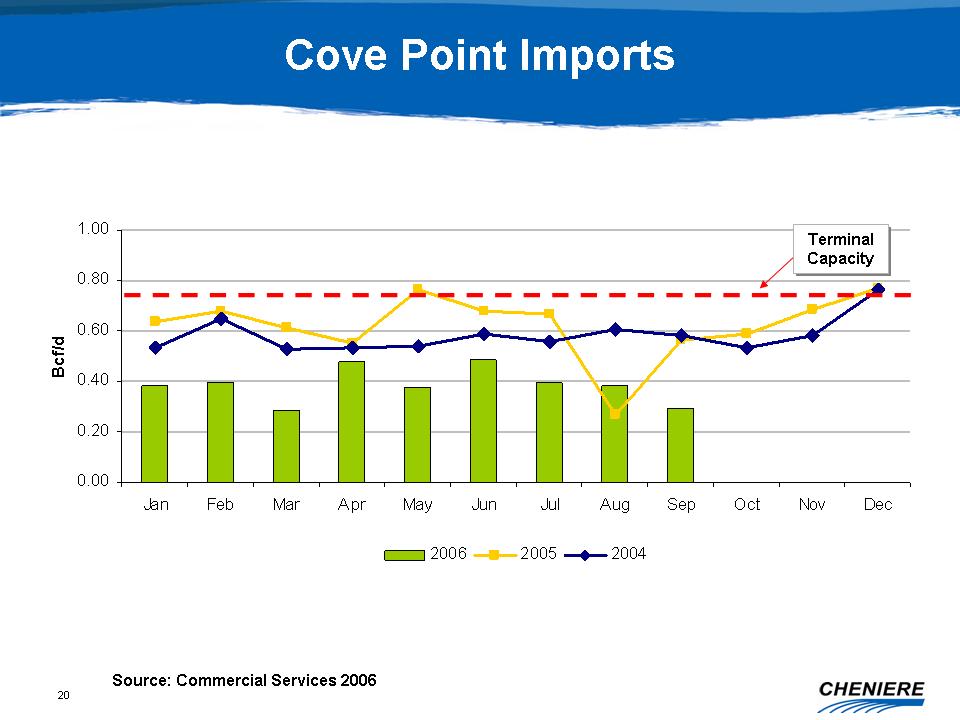
0.00 0.20 0.40 0.60 0.80 1.00 Jan Feb Mar Apr May Jun Jul Aug Sep Oct Nov
Dec
Bcf/d 2006 2005 2004 Cove Point Imports Source: Commercial Services 2006
Terminal Capacity Terminal Capacity
21
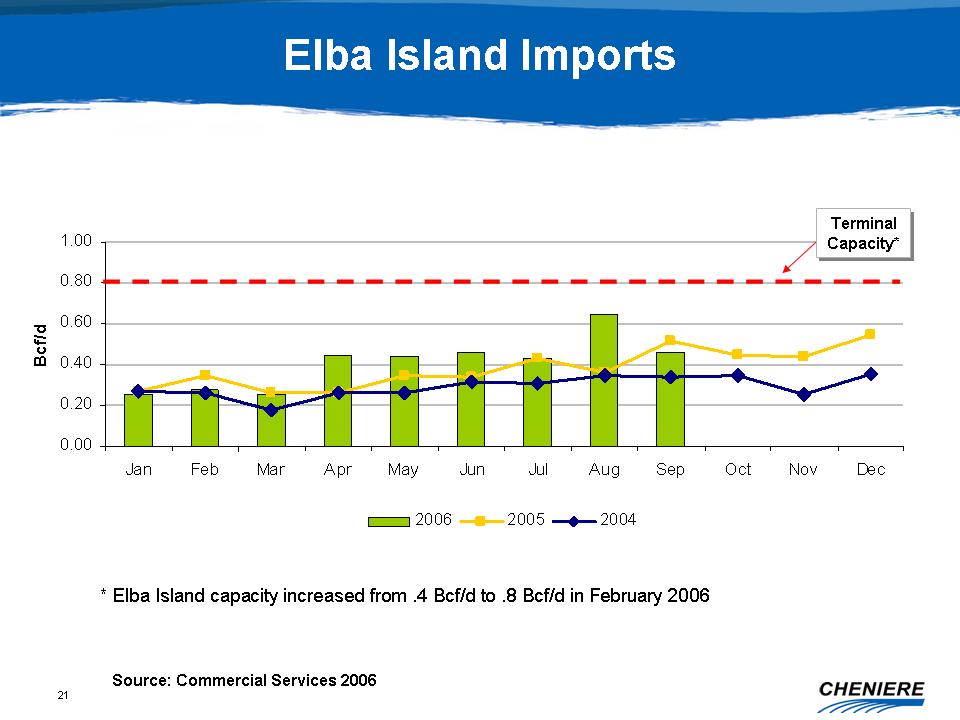
0.00 0.20 0.40 0.60 0.80 1.00 Jan Feb Mar Apr May Jun Jul Aug Sep Oct Nov
Dec
Bcf/d 2006 2005 2004 Elba Island Imports Source: Commercial Services 2006
Terminal Capacity* Terminal Capacity* * Elba Island capacity increased from
.4
Bcf/d to .8 Bcf/d in February 2006
22
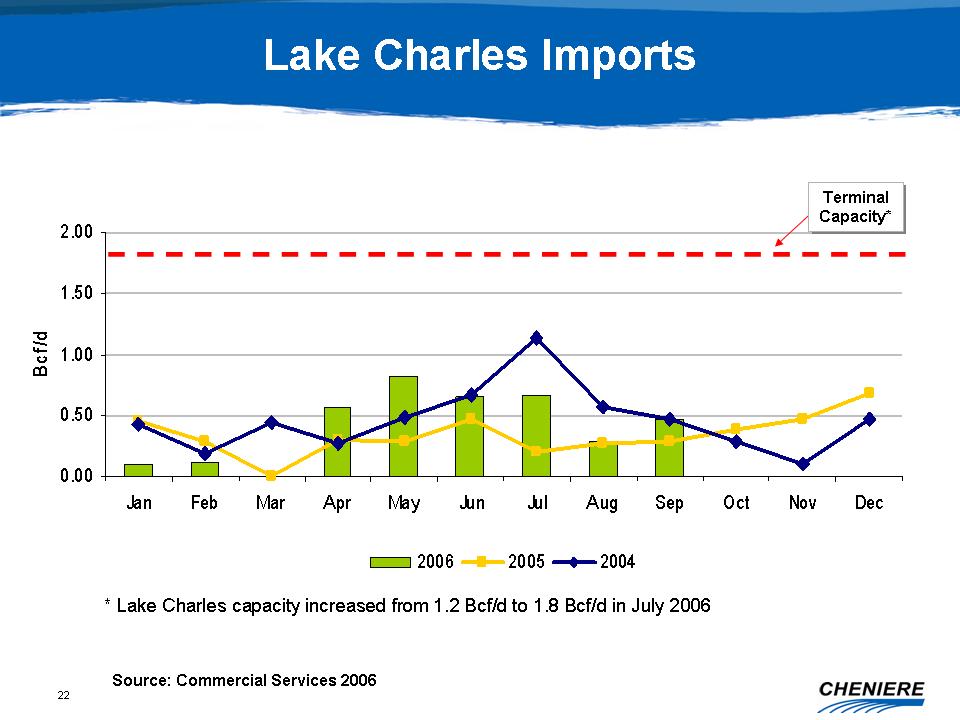
0.00 0.50 1.00 1.50 2.00 Jan Feb Mar Apr May Jun Jul Aug Sep Oct Nov Dec
Bcf/d
2006 2005 2004 Lake Charles Imports Source: Commercial Services 2006 Terminal
Capacity* Terminal Capacity* * Lake Charles capacity increased from 1.2 Bcf/d
to
1.8 Bcf/d in July 2006
23
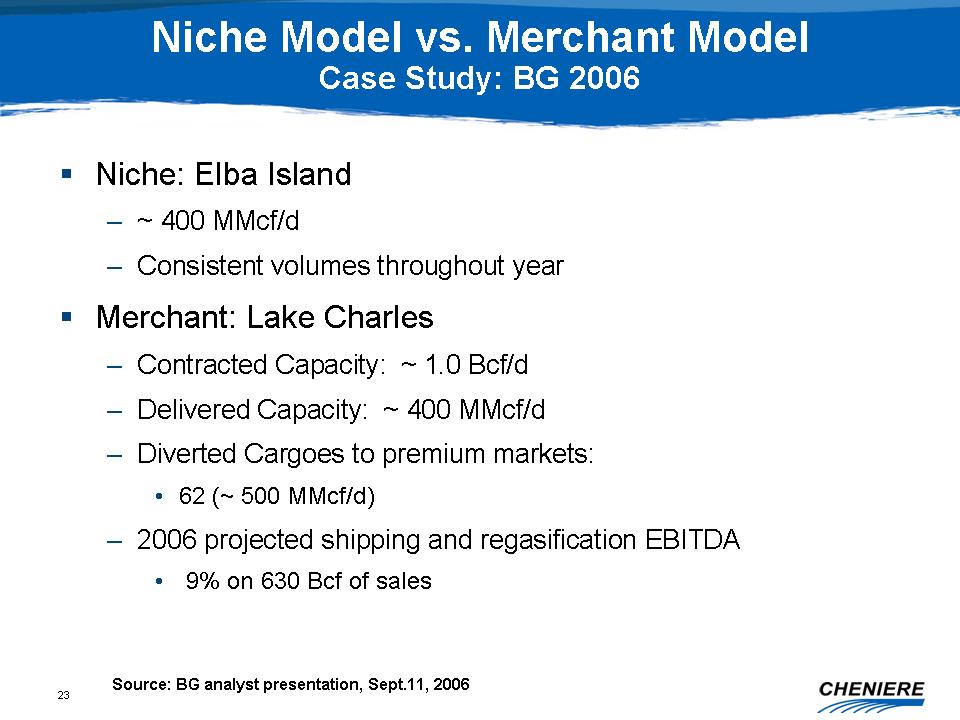
Niche Model vs. Merchant Model Case Study: BG 2006 Source: BG analyst
presentation, Sept.11, 2006 ⑀⍽ Niche: Elba Island - ~ 400 MMcf/d - Consistent
volumes throughout year ⑀⍽ Merchant: Lake Charles - Contracted Capacity: ~ 1.0
Bcf/d - Delivered Capacity: ~ 400 MMcf/d - Diverted Cargoes to premium markets:
• 62 (~ 500 MMcf/d) - 2006 projected shipping and regasification EBITDA • 9% on
630 Bcf of sales
24
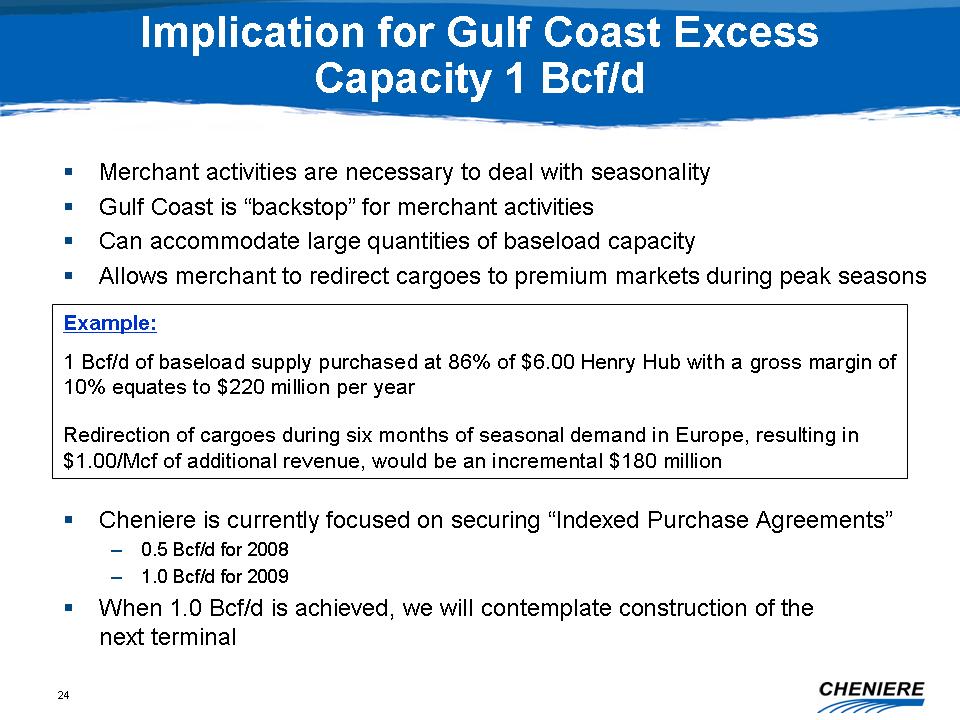
Implication for Gulf Coast Excess Capacity 1 Bcf/d ⑀⍽ Merchant activities are
necessary to deal with seasonality ⑀⍽ Gulf Coast is “backstop” for merchant
activities ⑀⍽ Can accommodate large quantities of baseload capacity ⑀⍽ Allows
merchant to redirect cargoes to premium markets during peak seasons Example:
1
Bcf/d of baseload supply purchased at 86% of $6.00 Henry Hub with a gross
margin
of 10% equates to $220 million per year Redirection of cargoes during six
months
of seasonal demand in Europe, resulting in $1.00/Mcf of additional revenue,
would be an incremental $180 million ⑀⍽ Cheniere is currently focused on
securing “Indexed Purchase Agreements” - 0.5 Bcf/d for 2008 - 1.0 Bcf/d for 2009
⑀⍽ When 1.0 Bcf/d is achieved, we will contemplate construction of the next
terminal
25
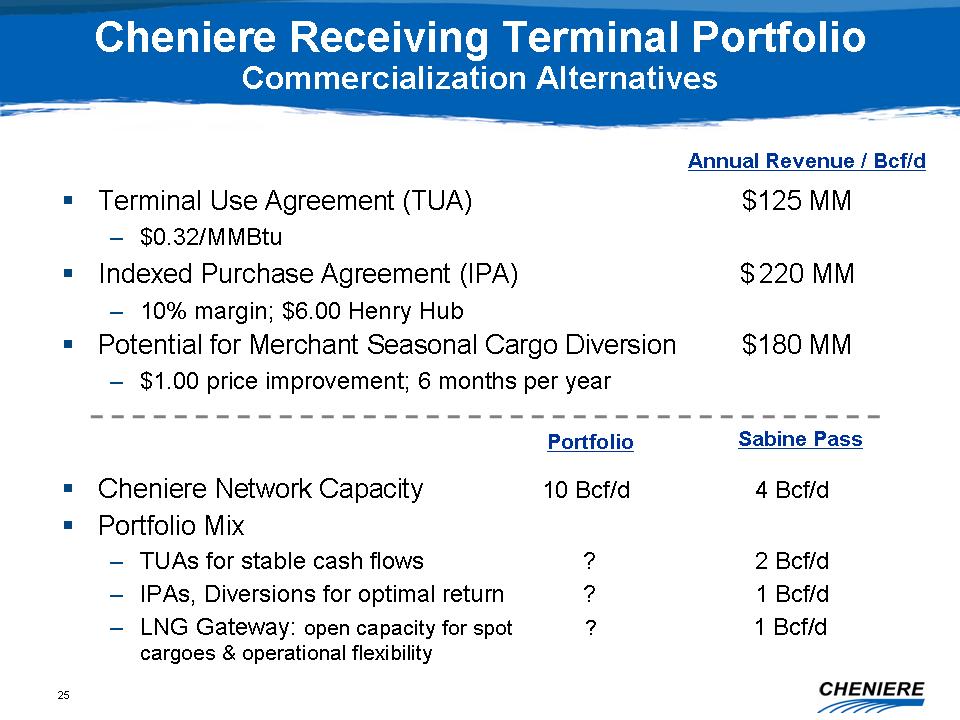
Cheniere Receiving Terminal Portfolio Commercialization Alternatives ⑀⍽ Terminal
Use Agreement (TUA) $125 MM - $0.32/MMBtu ⑀⍽ Indexed Purchase Agreement (IPA) $
220 MM - 10% margin; $6.00 Henry Hub ⑀⍽ Potential for Merchant Seasonal Cargo
Diversion $180 MM - $1.00 price improvement; 6 months per year ⑀⍽ Cheniere
Network Capacity 10 Bcf/d 4 Bcf/d ⑀⍽ Portfolio Mix - TUAs for stable cash flows
? 2 Bcf/d - IPAs, Diversions for optimal return ? 1 Bcf/d - LNG Gateway:
open
capacity for spot ? 1 Bcf/d cargoes & operational flexibility Annual Revenue
/ Bcf/d Sabine Pass Portfolio