|
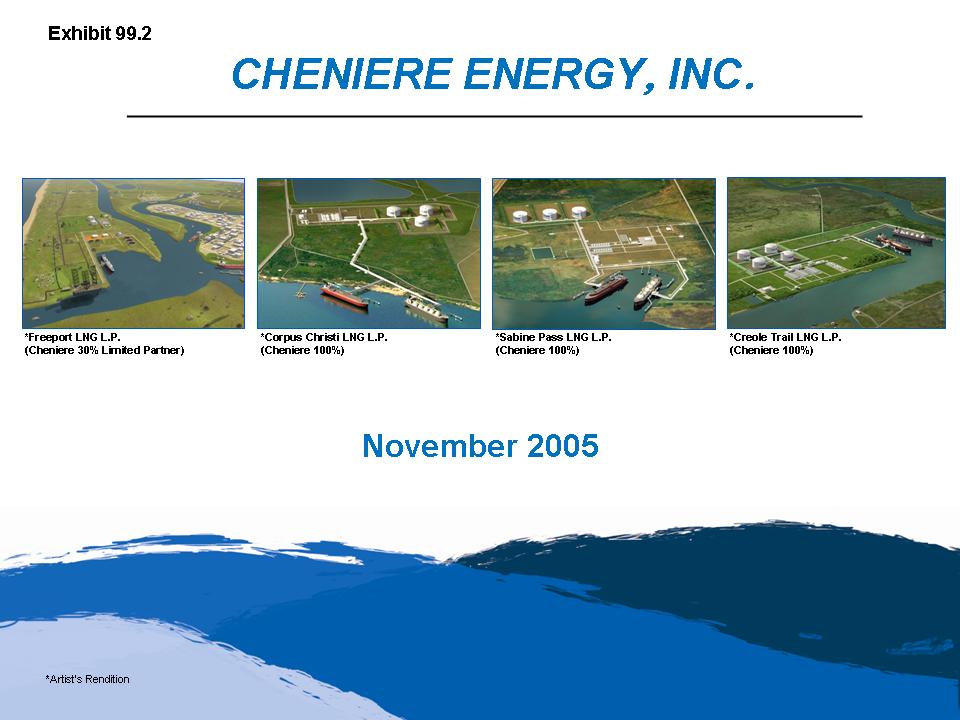
Exhibit
99.2
Cheniere
Energy
*Freeport
LNG L.P. (Cheniere 30% Limited Partner)
*Corpus
Christi LNG L.P. (Cheniere 100%)
*Sabine
Pass LNG L.P. (Cheniere 100%)
*Creole
Trail LNG L.P. (Cheniere 100%)
November
2005
|
|
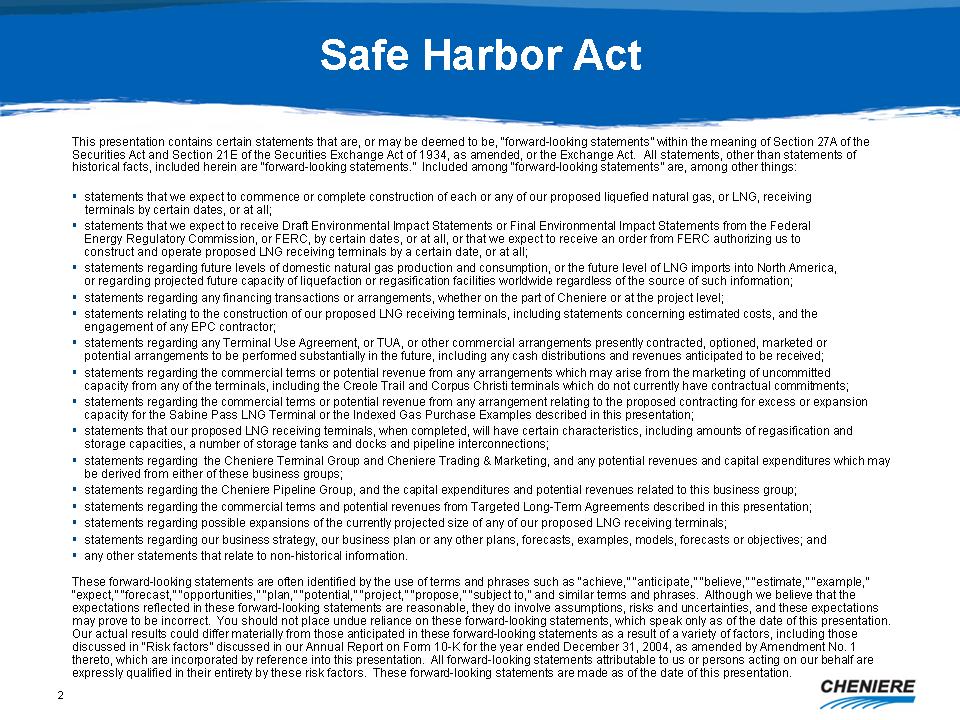
Corpus
Christi 2.6 Bcf/d
Freeport
(30%) 1.5 Bcf/d Under Construction
Sabine
Pass 4.0 Bcf/d Under Construction
Creole
Trail 3.3 B cf/d
-
4 Deepwater Ports
-
7 Unloading Docks
-
15 Storage Tanks (51.7 Bcf equivalent)
-
11.4 Bcf/d Regas Capacity
|
|
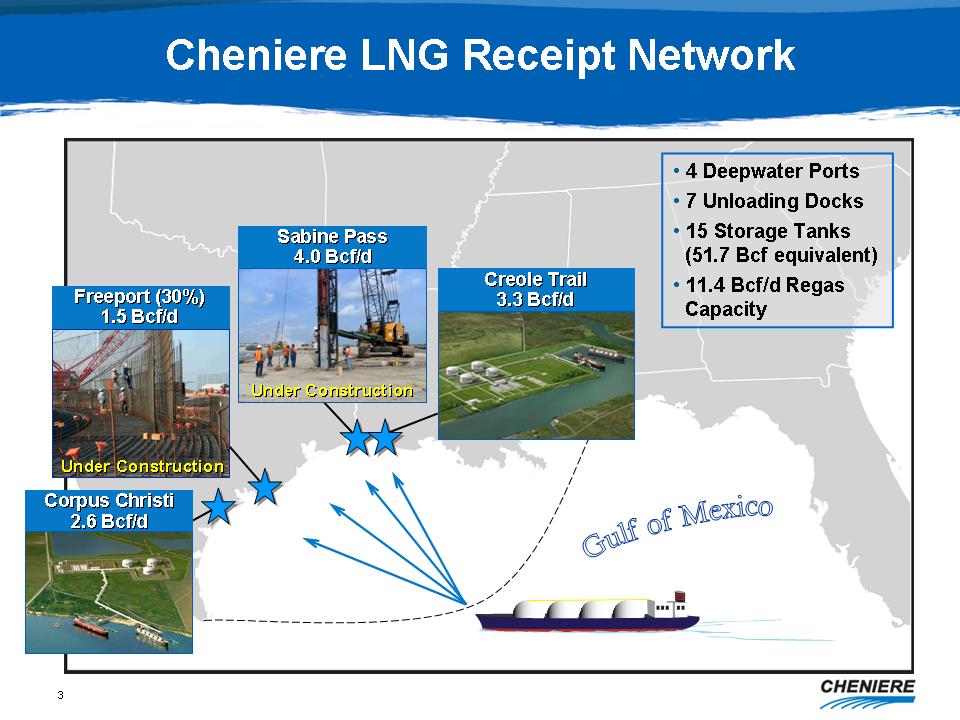
2008
|
2009
|
2010
|
2011
|
|
|
Freeport
|
1.5
|
1.5
|
1.5
|
1.5
|
|
Sabine
Pass
|
2.6
|
4.0
|
4.0
|
4.0
|
|
Corpus
Christi
|
-
|
-
|
2.6
|
2.6
|
|
Creole
Trail
|
-
|
-
|
-
|
3.3
|
|
Total
Bcf/d
|
4.1
|
5.5
|
8.1
|
11.4
|
| • |
Regulatory
– no delays in schedules currently
anticipated
|
| • |
Commercial
|
| – |
Cheniere’s
ability to expand to meet growing
workload
|
| – |
Domestic
market’s capacity to absorb increase in LNG
deliveries
|
| – |
Identifying
and optimizing alternative commercial
models
|
| – |
Financing
decisions impacted by timing of receipt of cash
flow
|
|
Is
Cheniere building too much capacity?
Availability
of supply
Competition
for regasification
Optimum
commercial arrangements
|
|
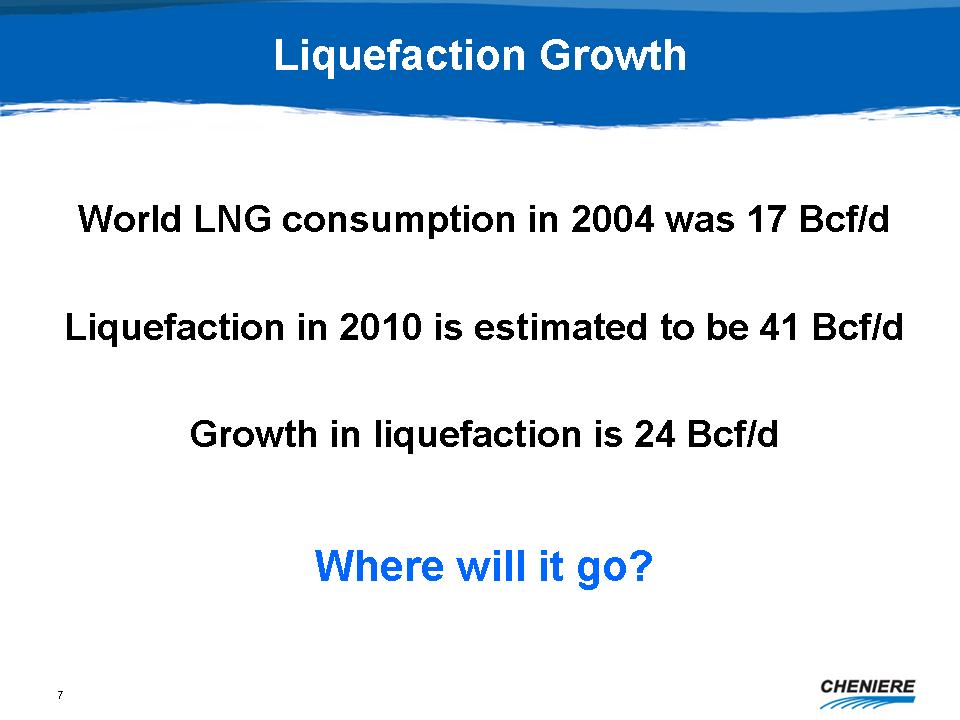
Liquefaction
Growth
World
LNG consumption in 2004 was 17 Bcf/d
Liquefaction
in 2010 is estimated to be 41 Bcf/d
Growth
in liquefaction is 24 Bcf/d
Where
will it go?
|
|
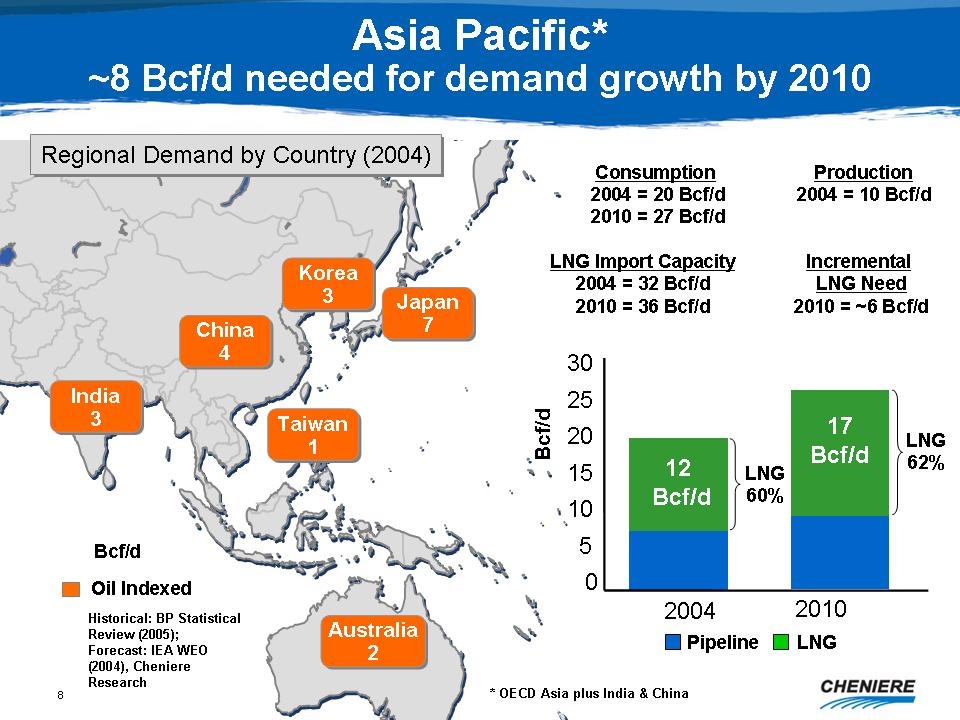
Asia
Pacific* ~8 Bcf/d needed for demand growth by 2010
Regional
Demand by Country (2004)
Japan
7, China 4, Korea 3, India 3, Australia 2, Taiwan 1
Consumption
2004=20 Bcf/d 2010=27 Bcf/d
Production
2004=10 Bcf/d
LNG
Import Capacity 2004=32 Bcf/d 2010=36 Bcf/d
Historical:
BP Statistical Review (2005); Forecast: IEA WEO (2004), Cheniere
Research
*OECD
Asia plus India & China
Incremental
LNG Need 2010=~6 Bcf/d
|
|
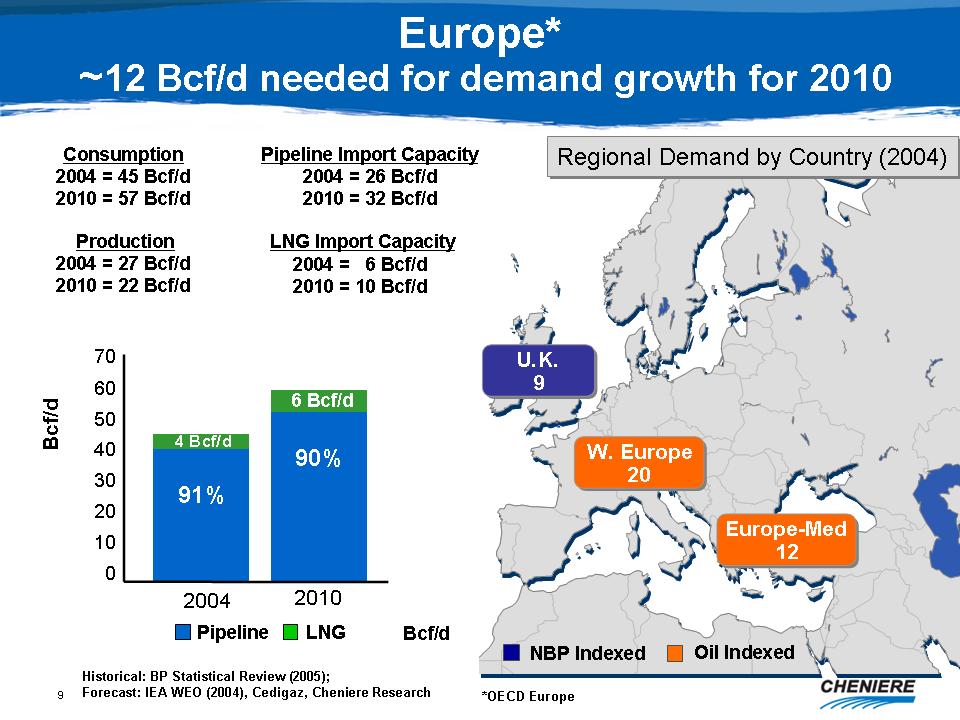
Europe*
~12 Bcf/d needed for demand growth for 2010
Consumption
2004=45 Bcf/d 2010=57 Bcf/d
Pipeline
Import Capacity 2004=26 Bcf/d 2010=32 Bcf/d
Production
2004=27 Bcf/d 2010=22 Bcf/d
LNG
Import Capacity 2004=6 Bcf/d 2010=10 Bcf/d
Regional
Demand by Country (2004) U.K. 9, W. Europe 20, Europe-Med 12
Historical:
BP Statistical Review (2005); Forecast: IEA WEO (2004), Cedigaz,
Cheniere
Research
*OECD
Europe
|
|
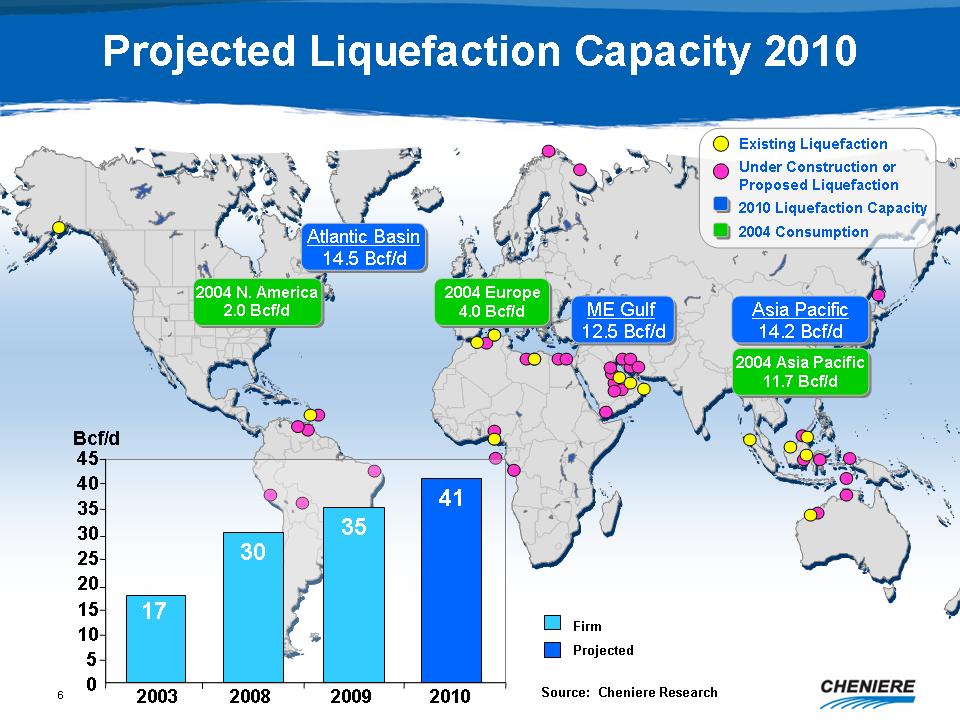
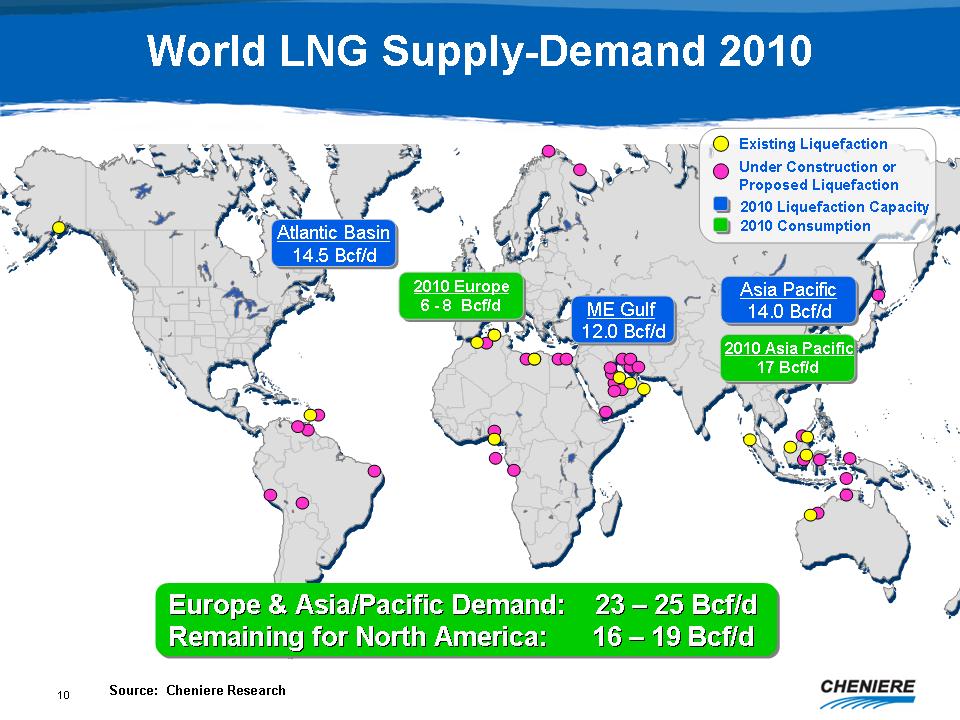
World
LNG Supply-Demand 2010
Atlantic
Basin 14.5 Bcf/d
2010
Europe 6 - 8 Bcf/d
ME
Gulf 12.0 Bcf/d
Asia
Pacific 14.0 Bcf/d
2010
Asia Pacific 17 Bcf/d
Europe
& Asia/Pacific Demand: 23 - 25 Bcf/d
Remaining
for North America: 16 - 19 Bcf/d
|
|
North
American Receiving Capacity
Can
North America receive 16 to 19 Bcf/d?
-
Gas consumption constraint
-
Regasification
|
|
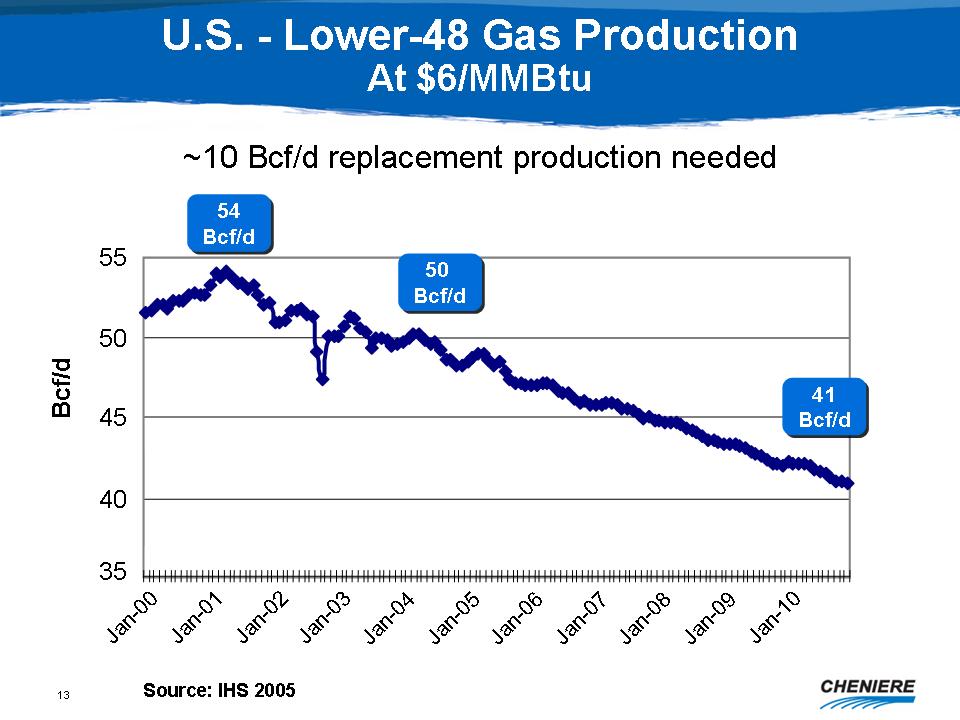
U.S.
- Lower-48 Gas Production At $6/MMBtu
~10
Bcf/d replacement production needed
Source:
IHS 2005
|
|
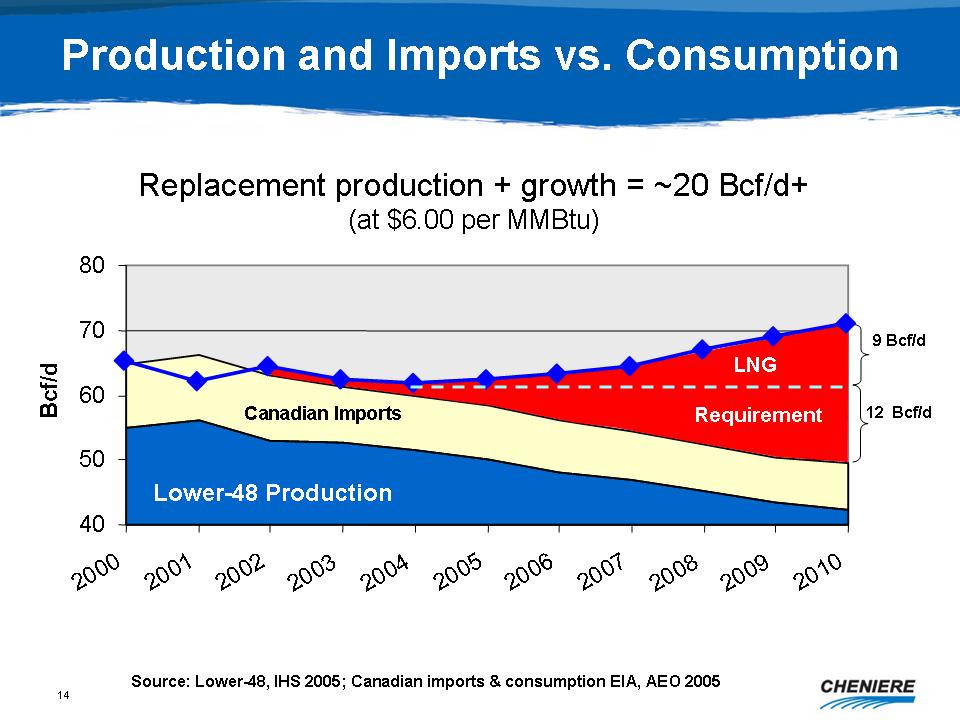
Production
and Imports vs. Consumption
Replacement
production + growth = ~20 Bcf/d+ (at $6.00 per MMBtu)
Source:
Lower-48, IHS 2005; Canadian imports & consumption EIA, AEO
2005
|
|
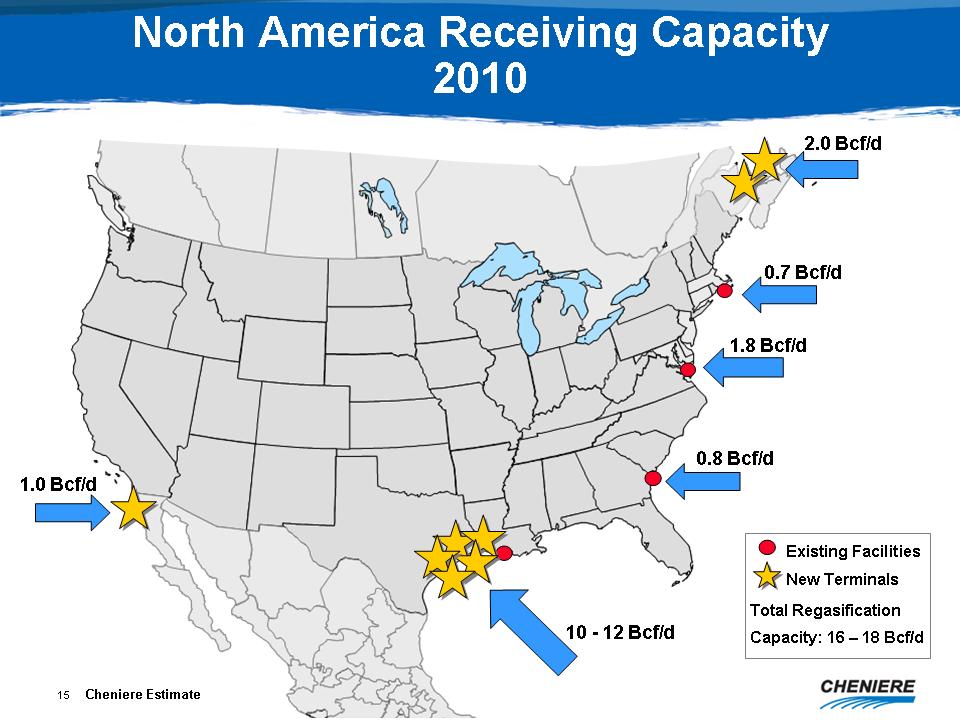
North
America Receiving Capacity 2010
1.0
Bcf/d
10
- 12 Bcf/d
2.0
Bcf/d
0.7
Bcf/d
1.8
Bcf/d
0.8
Bcf/d
|

|
North
America Receiving Capacity
Enough
capacity but not too much
Depends
on utilization rate
|
|
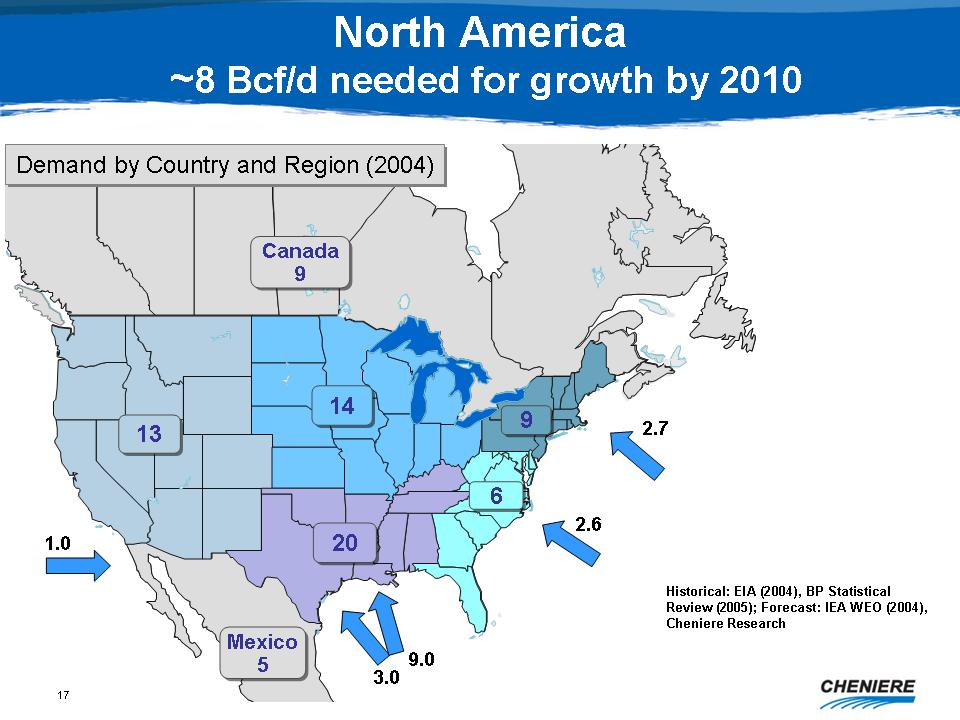
North
America ~8 Bcf/d needed for growth by 2010
Demand
by Country and Region (2004)
Canada
9, Mexico 5, 1.0, 13, 14, 20, 6, 9, 2.7, 2.6
Historical:
EIA (2004), BP Statistical Review (2005); Forecast: IEA WEO (2004),
Cheniere Research
|
|
Observations
Capacity
utilization probably under 75%
U.S.
will not receive sufficient gas at $6.00/MMBtu so prices will remain
higher on average
European
seasonality will increase volatility and reduce utilization
rates
NYMEX
will increasingly be a benchmark price
globally
|
|
Financing
-
Financing is not an issue any longer if:
-
Resource is controlled (hydrocarbon)
-
Market is accessible
-
Regasification
-
Customer base
-
NYMEX pricing is used
-
Trend is increasingly toward transactions between owners and
users
|
|
Cheniere's
LNG Receiving Portfolio
In
this context, what is the optimal business model for Cheniere's
capacity?
|
|
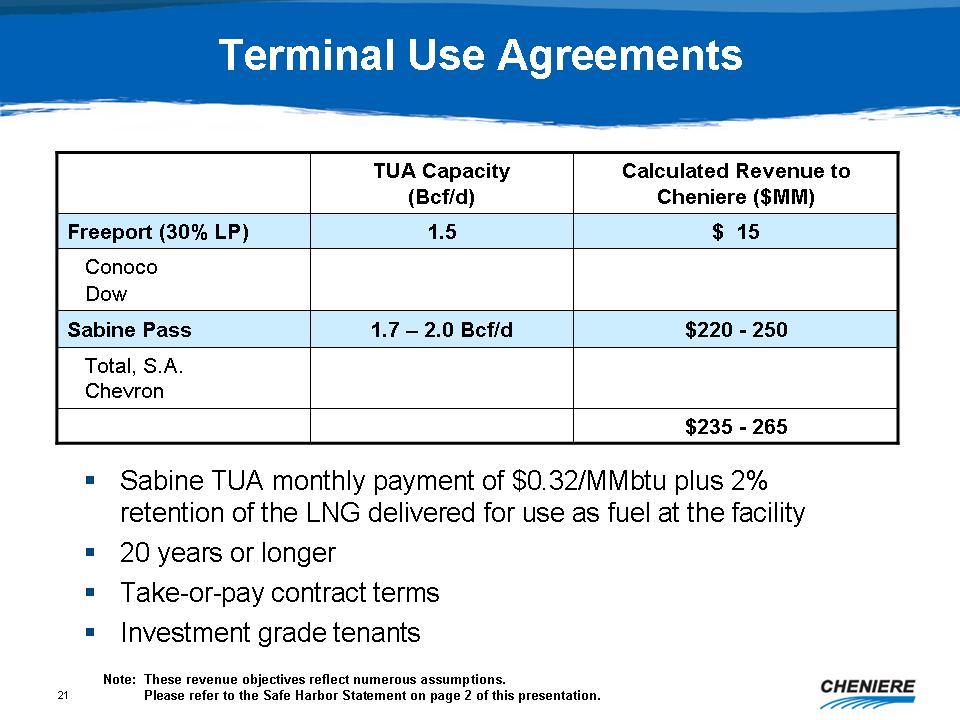
Terminal
Use Agreements
TUA
Capacity (Bcf/d)
Calculated
Revenue to Cheniere ($MM)
Freeport
(30% LP) 1.5 $15
Conoco
Dow
Sabine
Pass 1.7 - 2.0 Bcf/d $220 - 250
Total,
S.A.
Chevron
$235
- 265
Sabine
TUA monthly payment of $0.32/MMbtu plus 2% retention of the LNG delivered
for use as fuel at the facility
20
years or longer
Take-or-pay
contract terms
Investment
grade tenants
Note:
These revenue objectives reflect numerous assumptions.
Please
refer to the Safe Harbor Statement on page 2 of this
presentation.
|
|
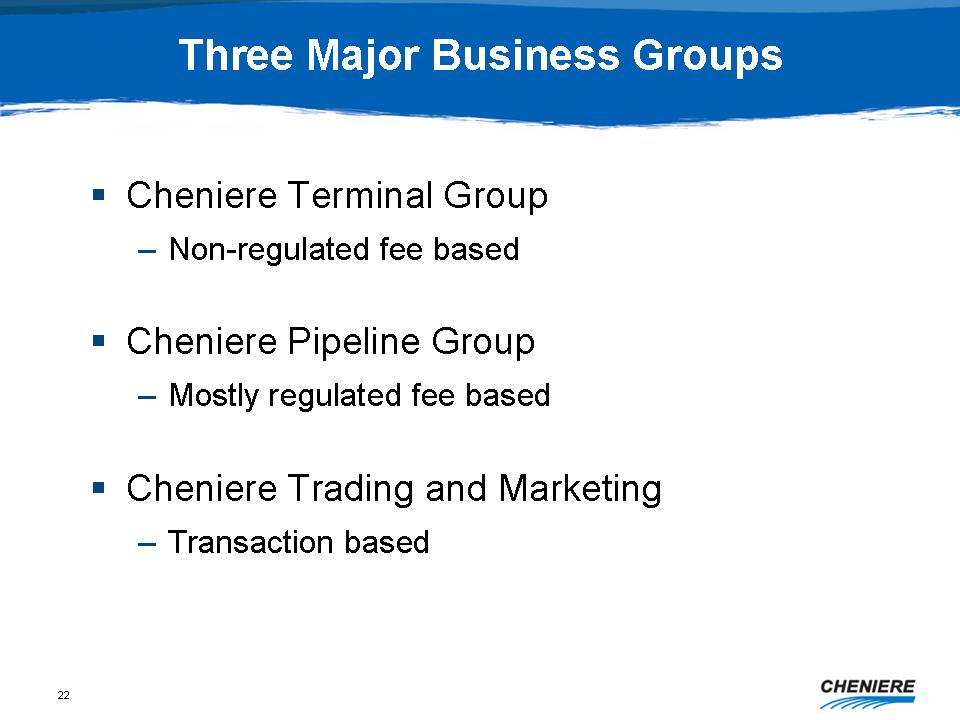
Three
Major Business Groups
Cheniere
Terminal Group
Non-regulated
fee based
Cheniere
Pipeline Group
Mostly
regulated fee based
Cheniere
Trading and Marketing
Transaction
based
|
|
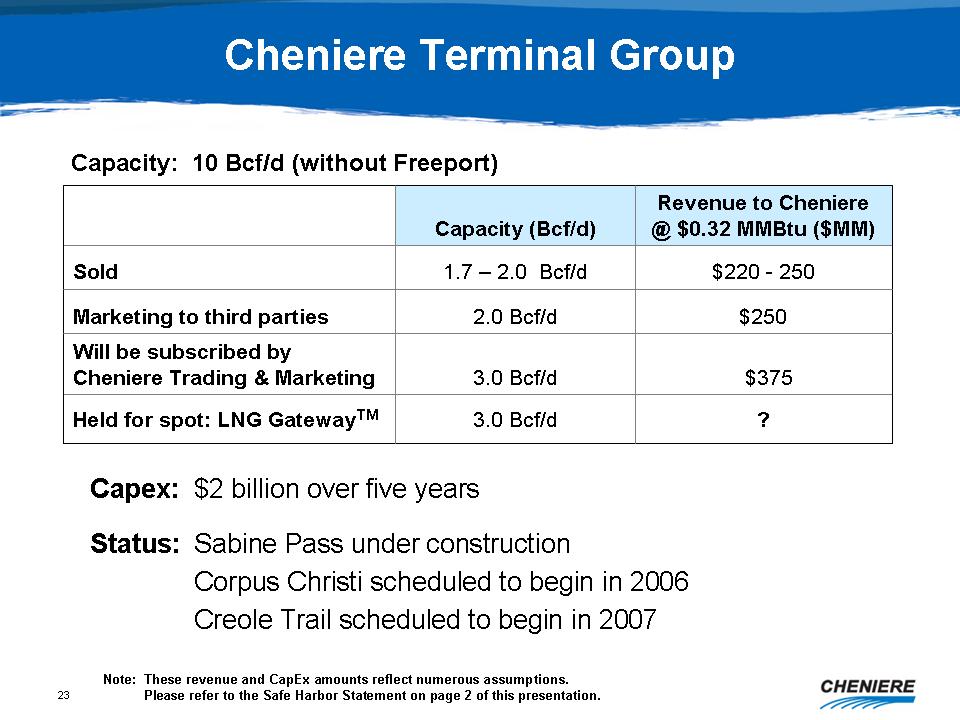
Cheniere
Terminal Group
Capacity:
10 Bcf/d (without Freeport)
Capacity
(Bcf/d)
Revenue
to Cheniere @ $0.32 MMBtu ($MM)
Sold
1.7 - 2.0 Bcf/d $220 - 250 Marketing
to third parties 2.0 Bcf/d $250
Will
be subscribed by Cheniere Trading & Marketing 3.0 Bcf/d
$375
Held
for spot: LNG GatewayTM 3.0 Bcf/d ? Capex:
$2 billion over five yearsStatus:
Sabine Pass under construction
Corpus
Christi scheduled to begin in 2006Creole
Trail scheduled to begin in 2007 Note:
These revenue and CapEx amounts reflect numerous assumptions.
Please
refer to the Safe Harbor Statement on page 2 of this
presentation.
|
|
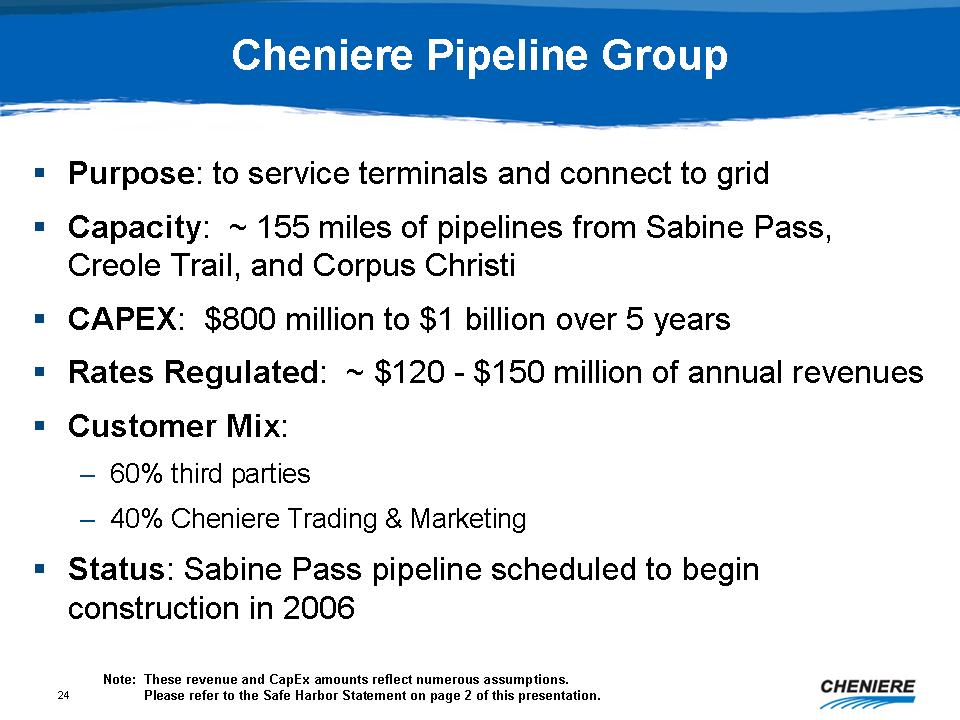
Cheniere
Pipeline Group
Purpose:
to service terminals and connect to grid
Capacity:
~ 155 miles of pipeline from Sabine Pass, Creole Trail, and Corpus
Christi
CAPEX:
$800 million to $1 billion over 5 years
Rates
Regulated: ~$120 - $150 million of annual revenues
Customer
Mix:
-
60% third parties
-
40% Cheniere Trading & Marketing
Status:
Sabine Pass pipeline scheduled to begin construction in 2006
Note:
These revenue and CapEx amounts reflect numerous assumptions.
Please
refer to the Safe Harbor Statement on page 2 of this
presentation.
|
|
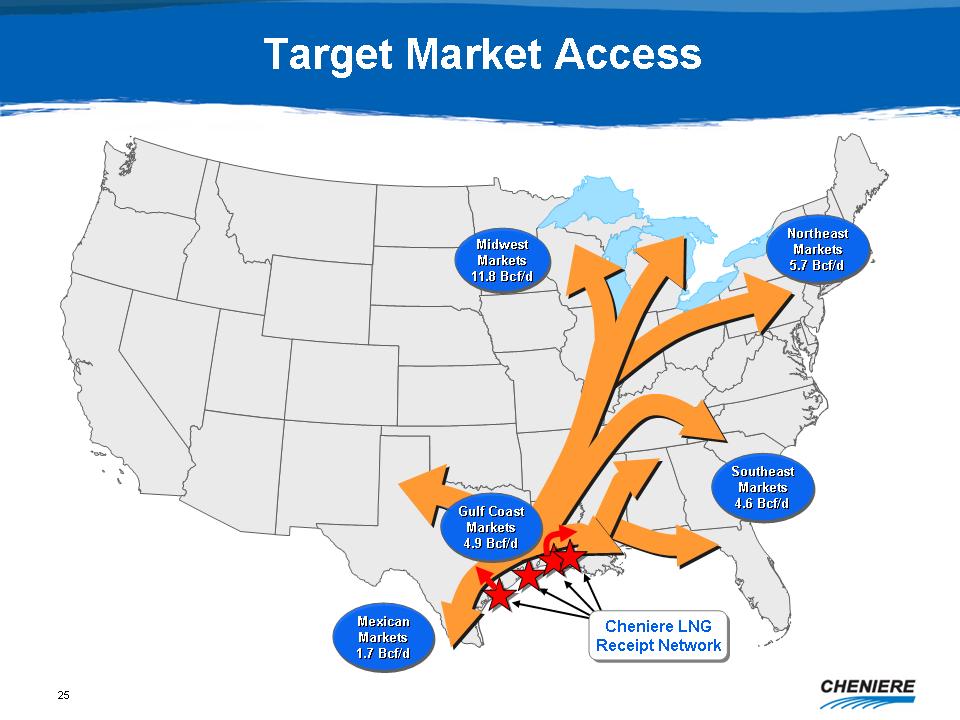
Target
Market Access
Midwest
Markets 11.8 Bcf/d
Northeast
Markets 5.7 Bcf/d
Gulf
Coast Markets 4.9 Bcf/d
Mexican
Markets 1.7 Bcf/d
Southeast
Markets 4.6 Bcf/d
Cheniere
LNG Receipt Network
|
|
Cheniere
Trading & Marketing
Developing
portfolio of gas purchase and gas sale agreements
Manage
LNG GatewayTM
|
|
Targeted
Long-Term Agreements
Long-term
purchase transactions currently between 83% and 87% of NYMEX delivered
at
the terminal
When
purchase agreements are concluded, Cheniere Trading & Marketing will
enter into corresponding agreements with Cheniere's Terminal Group
-
imputed opportunity cost $0.32
Domestic
sale agreements to deliver gas to customers at various liquidity
points
starting at the tailgate of the terminal
Will
encourage purchasers to enter into agreements with Cheniere's Pipeline
Group.
|
|
LNG
GatewayTM
Because
of seasonality and volatility we think the market for short-term
transactions will continue to grow
Opportunity
to purchase LNG on better conditions
Plan
to start receiving cargoes beginning in 2008 and gauge market
reaction
|
|
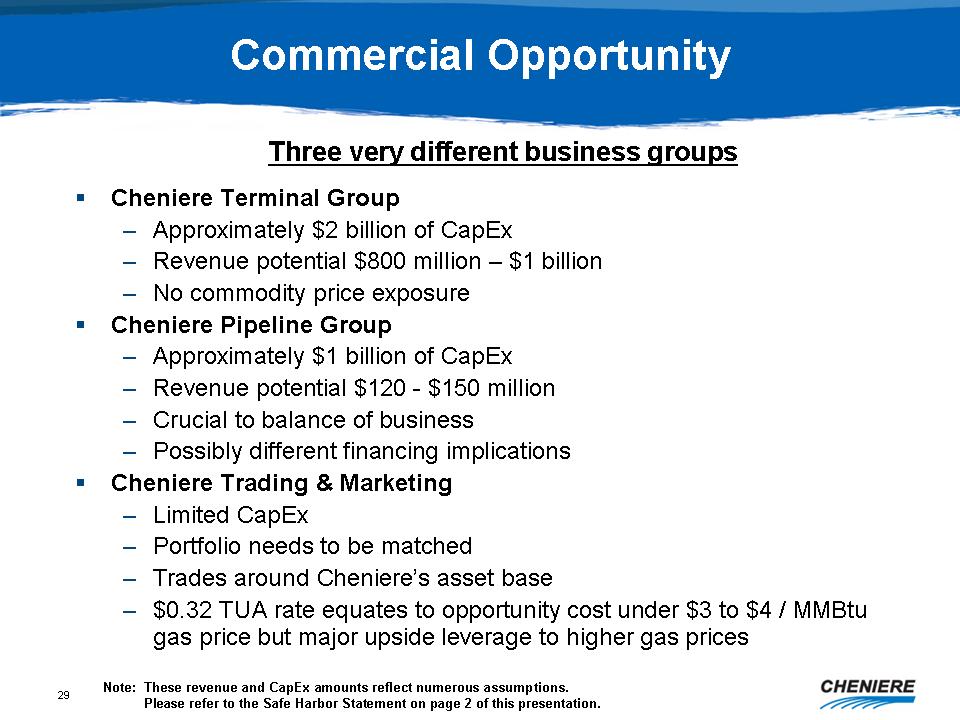
Commercial
Opportunity
Three
very different business groups
Cheniere
Terminal Group
Approximately
$2 billion of CapEx
Revenue
potential $800 million - $1 billion
No
commodity price exposure
Cheniere
Pipeline Group
Approximately
$1 billion of CapEx
Revenue
potential $120 - $150 million
Crucial
to balance of business
Possibly
different financing implications
Cheniere
Trading & Marketing
Limited
CapEx
Portfolio
needs to be matched
Trades
around Cheniere's asset base
$0.32
TUA rate equates to opportunity cost under $3 to $4 / MMBtu gas price
but
major upside leverage to higher gas prices
Note:
These revenue and CapEx amounts reflect numerous assumptions.
Please
refer to the Safe Harbor Statement on page 2 of this
presentation.
|
|
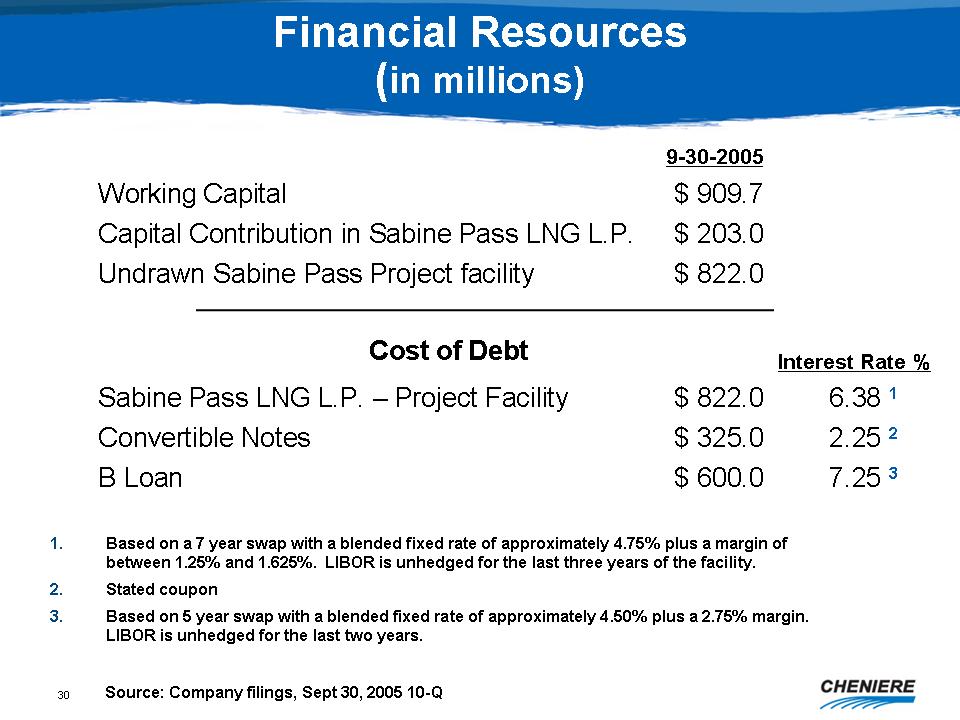
Financial
Resources (in millions)
9-30-2005
Working
Capital $909.7
Capital
Contribution in Sabine Pass LNG L.P. $203.0
Undrawn
Sabine Pass Project facility $822.0
Cost
of Debt
Interest
Rate %
Sabine
Pass LNG L.P. - Project Facility $822.0 6.38 1
Convertible
Notes $325.0 2.25 2
B
Loan $600.0 7.25 3
1.
Based on a 7 year swap with a blended fixed rate of approximately
4.75%
plus a margin of between 1.25% and 1.625%. LIBOR is unhedged for
the last
three years of the facility.
2.
Stated coupon
3.
Based on 5 year swap with a blended fixed rate of approximately 4.50%
plus
a 2.75% margin. LIBOR is unhedged for the last two years.
Source:
Company filings, Sept 30, 2005
10-Q
|