
Cheniere Energy, Inc.
*Freeport LNG L.P. (Cheniere 30% Limited Partner)
*Sabine Pass LNG L.P. (Cheniere 100%)
*Corpus Christi LNG L.P. (Cheniere 100%)
*Creole Trail LNG L.P. (Cheniere 100%)
*Artist’s Rendition
May 2005

This presentation contains certain statements that are, or may be deemed to be, “forward-looking statements” within the meaning of Section 27A of the Securities
Act and Section 21E of the Securities
Exchange Act of 1934, as amended, or the Exchange Act. All statements, other than statements of historical facts, included
herein are “forward-looking statements.” Included among “forward-looking statements” are,
among other things:
statements that we expect to commence or complete construction of each or any of our proposed liquefied natural gas, or LNG, receiving terminals by
certain dates, or at all;
statements that we expect to receive Draft Environmental Impact Statements or Final Environmental Impact Statements from the Federal Energy
Regulatory Commission, or FERC, by certain dates, or at all, or
that we expect to receive an order from FERC authorizing us to construct and operate
proposed LNG receiving terminals by a certain date, or at all;
statements regarding future levels of domestic natural gas production and consumption, or the future level of LNG imports into North America, or
regarding projected future capacity of liquefaction or regasification
facilities worldwide regardless of the source of such information;
statements regarding any financing transactions or arrangements, whether on the part of Cheniere or at the project level;
statements relating to the construction of our proposed LNG receiving terminals, including statements concerning estimated costs, and the
engagement of any EPC contractor;
statements regarding any Terminal Use Agreement, or TUA, or other commercial arrangements presently contracted, optioned, marketed or potential
arrangements to be performed substantially in the future, including
any cash distributions and revenues anticipated to be received;
statements regarding the commercial terms or potential revenue from any arrangements which may arise from the marketing of uncommitted capacity
from any of the terminals, including the Creole Trail and Corpus
Christi terminals which do not currently have contractual commitments;
statements regarding the commercial terms or potential revenue from any arrangement relating to the proposed contracting for excess or expansion
capacity for the Sabine Pass LNG Terminal or the Indexed Gas
Purchase Examples described in this presentation;
statements that our proposed LNG receiving terminals, when completed, will have certain characteristics, including amounts of regasification and
storage capacities, a number of storage tanks and docks and
pipeline interconnections;
statements regarding possible expansions of the currently projected size of any of our proposed LNG receiving terminals;
statements regarding our business strategy, our business plan or any other plans, forecasts, examples, models, forecasts or objectives; and
any other statements that relate to non-historical information.
These forward-looking statements are often identified by the use of terms and phrases such as “achieve,” “anticipate,” “believe,” “estimate,” “example,” “expect,”
“forecast,” “opportunities,” “plan,” “potential,” “project,” “propose,” “subject to,” and similar terms and phrases. Although we believe that the expectations reflected in
these forward-looking statements are reasonable, they do involve assumptions, risks and uncertainties, and these expectations may prove to be incorrect. You
should not place undue reliance on these forward-looking statements, which speak
only as of the date of this presentation.
Our actual results could differ materially from those anticipated in these forward-looking statements as a result of a variety of factors, including those discussed
in “Risk factors” discussed in our Annual Report on Form 10-K for the year ended December 31, 2004, as amended by Amendment No. 1 thereto, which are
incorporated by reference into this presentation. All forward-looking statements attributable to us or persons acting on our
behalf are expressly qualified in their
entirety by these risk factors. These forward-looking statements are made as of the date of this presentation.
Safe Harbor Act
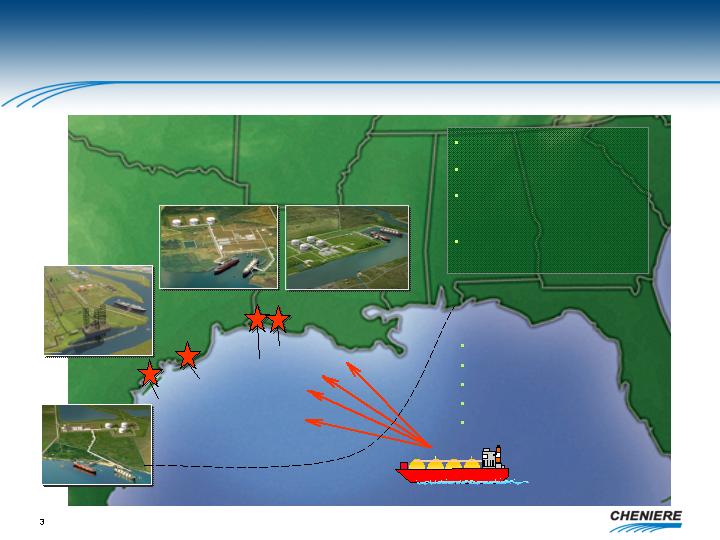
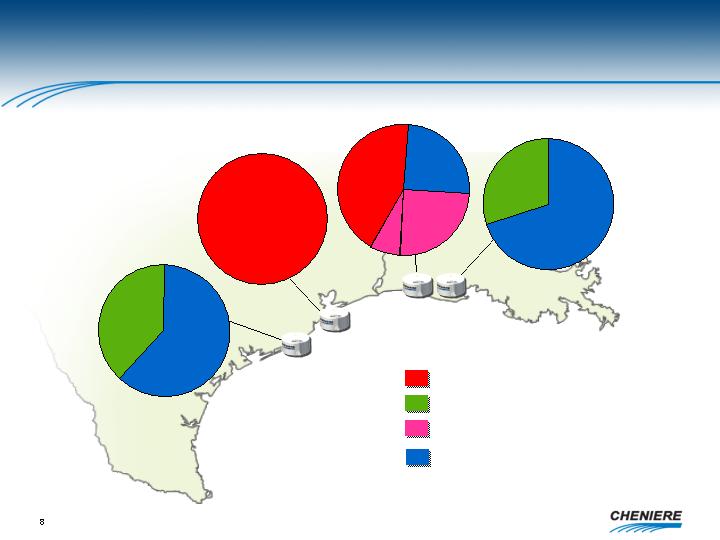
Cheniere LNG Receipt Network
4 Deepwater Ports
7 Unloading Docks
12 Storage Tanks
(40 Bcf equivalent)
10-11.4 Bcf/d Regas
Capacity
Sabine Pass
Freeport (30%)
Corpus Christi
Creole Trail
Optionality
Flexibility
Reliability
Liquidity
Low Cost
3.3 Bcf/d
2.6 – 4.0 Bcf/d
1.5 Bcf/d
2.6 Bcf/d
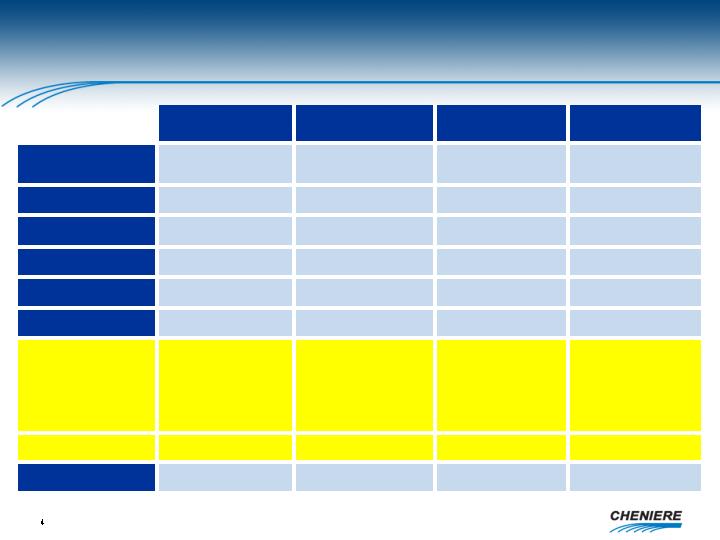
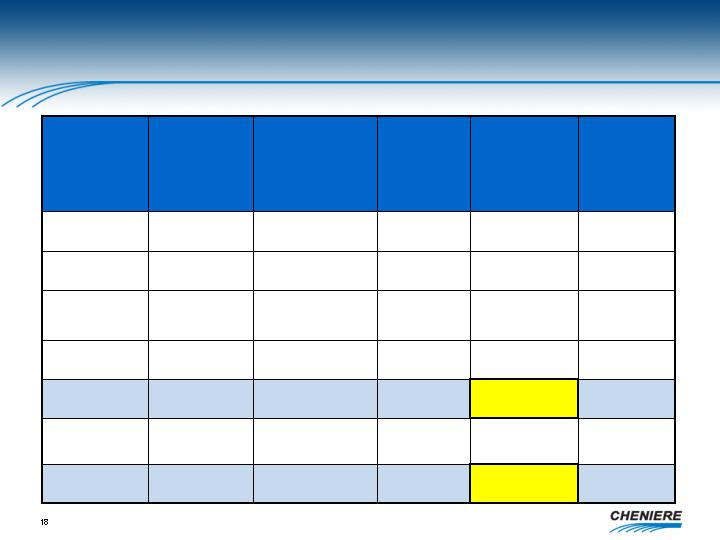
Project Overviews
Q3 2006 (exp.)
Q4 2005 (exp.)
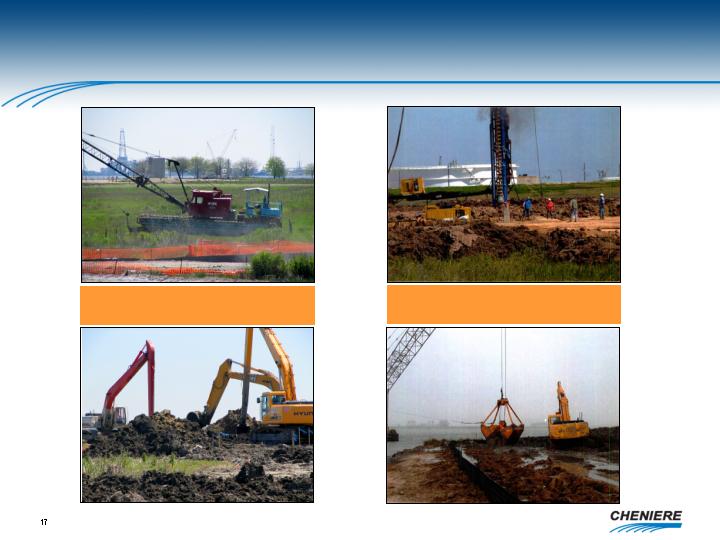
Under Construction
Under Construction
Ground Breaking
NEPA pre-filing
January 2005
Final EIS
March 2005
Authorization to
construct
Q3 2005 (exp.)
Authorization to
construct
March 2005
Authorization to
construct
January 2005
FERC Status
1,463 acres
612 acres
853 acres
233 acres
Land
2010
2009
2008
2008
Est. Operational
13.5 Bcfe
10.1 Bcfe
10.1 Bcfe
6.7 Bcfe
Storage Capacity
$850 – $950
$650 – $750
$750 – $850
$750
Capex ($mm)1
4 tanks
3 tanks
3 tanks
2 tanks
Tanks
2 docks
3.3 Bcf/d
Creole Trail
2 docks
2 docks
1 dock
Berths
Initial Capacity
2.6 Bcf/d
2.6 Bcf/d
1.5 Bcf/d
Corpus Christi
Sabine Pass
Freeport
1 Estimated construction costs before financing costs (includes EPC contract, owner’s cost, G&A and contingencies), subject to
change
due to such items as cost overruns, change orders and changes in commodity prices (particularly steel)
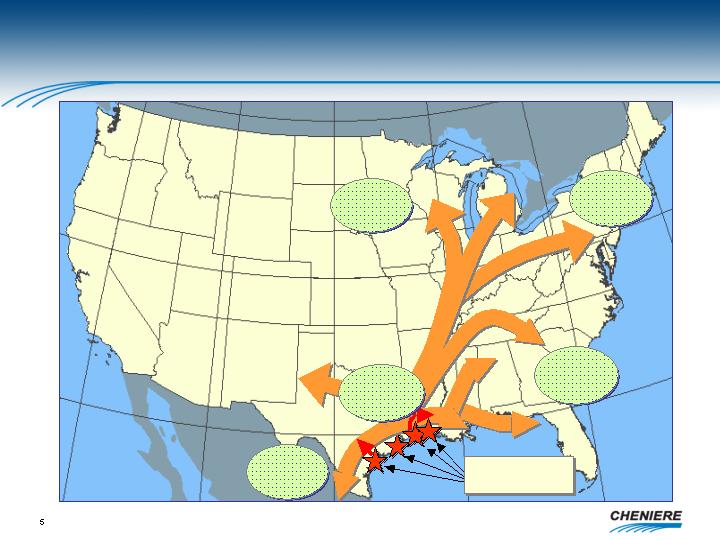
Target Gas Demand Corridor
Market Access – 29 Bcf/d
Midwest
Markets
11.8 Bcf/d
Northeast
Markets
5.7 Bcf/d
Southeast
Markets
4.6 Bcf/d
Gulf Coast
Markets
4.9 Bcf/d
Mexican
Markets
1.7 Bcf/d
Source: Cheniere Research
Cheniere LNG
Receipt Network

Coastal States Gas Consumption
1.0
1.9
1.0
0.7
1.2
0.7
0.7
0.2
0.4
0.6
0.7
Top 5 Coastal Consumers
TX, CA, LA, NY, FLA
Source: EIA, NG Monthly, April 2004
In Bcf/d
2003
11.2
3.4
1.9
6.1
3.1
1.7
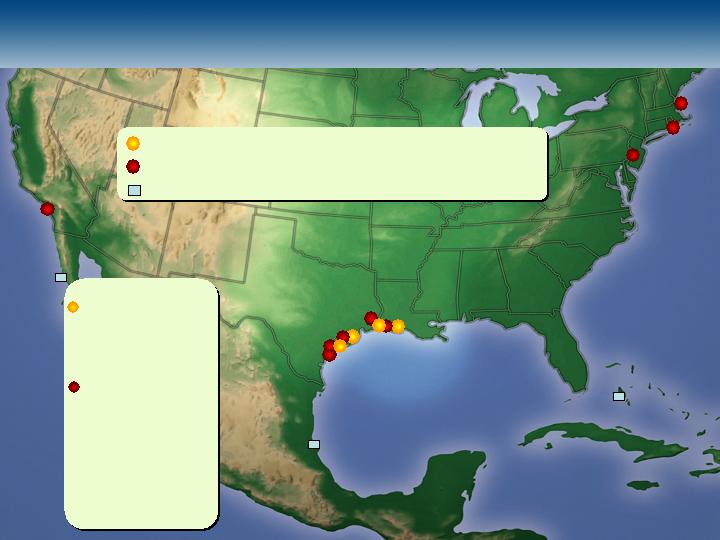
FERC Permit Status
4 Onshore applications approved by FERC – 8.2 Bcf/d
9 Onshore applications filed w/ FERC – 9.8 Bcf/d
Outside U.S. for U.S. Markets (Bahamas and Mexico)
FERC Approved
Cameron LNG (LA)
Corpus Christi – (TX)
Freeport LNG (TX)
Sabine Pass – (LA)
Filed with FERC
Calhoun LNG – (TX)
Weaver’s Cove – (MA)
Golden Pass – (TX)
Ingleside Energy – (TX)
Sound Energy – (CA)
Providence – (RI)
Vista del Sol – (TX)
Port Arthur - (TX)
Crown Landing - (NJ)
Onshore
Commercial Status
Corpus Christi
2.6 Bcf/d
Freeport
1.5 Bcf/d
Sabine Pass2
4.0 Bcf/d
Creole Trail
3.3 Bcf/d
Firm TUAs
Marketing TUAs
Under Option, subject to negotiation
1.5
1.0
1.6
2.3
1.0
1.71
1.0
1.0
.31
Cheniere Retained
1
Chevron has 0.7 Bcf/d of reserved capacity with the option to reduce to 0.5 Bcf/d by July 1, 2005 or
increase to 1.0 Bcf/d by December 1, 2005
2
Assumes expansion of 1.4 Bcf/d, which is currently not contracted
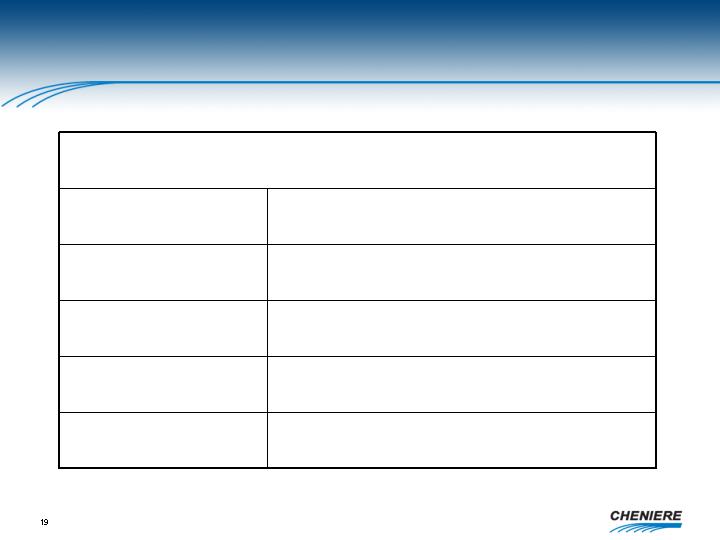
Terminal Use Agreements (TUAs)
Sabine TUA monthly payment amounts of $0.32/MMbtu
plus retain 2% of the LNG delivered for use as fuel at the
facility
20 years or longer
Take-or-pay contract terms
Investment grade tenants
F r e e p o r t L N G
Dow Chemical Company*
ConocoPhillips Company*
S a b i n e P a s s L N G
Total LNG U.S.A., Inc.
Chevron U.S.A., Inc.
* TUA economic terms are confidential
$230
3.2
Total
Contracted
Contracted
Contracted
TUA
Status
$0.32
$0.32
Fee
($/MMbtu)
$ 15
1.5
Freeport
$125
$ 90
Calculated
Revenue to
Cheniere ($mm)1
1.0
0.7 2
Sabine Pass3
Total, S.A.
Chevron
TUA
Capacity
(Bcf/d)
Estimated TUA Annual Revenue
1
Revenue calculations are based solely on TUAs and reflect numerous assumptions; Freeport revenues represent the
midpoint of currently estimated pre-tax cash distributions of $10—$20 million
per year.
2
Chevron has 0.7 Bcf/d of reserved capacity with the option to reduce to 0.5 Bcf/d ($65 million in revenues) by July 1, 2005
or increase to 1.0 Bcf/d ($129 million in revenues) by December 1,
2005
3
Fixed cash operating expenses for each terminal are estimated to be $25—$30 million per year; Sabine Pass LNG,
Corpus Christi LNG and Creole Trail LNG will also retain 2% of throughput for
fuel usage
$39
$0.32
0.31
Option
Chevron
$129
1.3
Total
Option -
subject to
negotiation
TUA
Status
$0.24
Fee
($/MMbtu)
$90
Calculated
Revenue to
Cheniere ($MM)
1.0
Expansion of
existing customers
TUA
Capacity
(Bcf/d)
Sabine Pass Capacity Opportunities
1 Chevron has 0.7 Bcf/d of reserved capacity with the option to reduce to 0.5 Bcf/d by July 1, 2005 or increase to
1.0
Bcf/d by December 1, 2005
Current Marketing Efforts
Marketing Efforts
2 Bcf/d at Corpus or Creole at $0.32 / MMBtu
Potential Revenues:
$250 million
Indexed Gas Purchase - Example
1 Bcf/d Gulf Coast delivery at 83% of Henry Hub price
Potential Revenues:
17% of $4.00/MMBtu @ Henry Hub:
$260 million

$609
6.5
Total
250
2.0
Corpus Christi or
Creole Trail
Marketing Capacity*
90
1.0
Expansion of Existing
Customers**
39
0.3
Chevron*
Sabine Pass Capacity
Opportunities
215
1.7
Sabine Pass
$15
1.5
Freeport
Contracted Capacity
Calculated Revenue
to Cheniere ($MM)
TUA Capacity
(Bcf/d)
Terminal Use Agreement Summary
* Capacity currently offered at $0.32/MMbtu.
** Expansion capacity under option at $0.24/MMbtu
There can be no assurances that contracts will be secured for these volumes at these rates.
Indexed Purchase Agreements
Growth of liquefaction
Increasing domestic supply/demand gap
Scarcity of flexible, cheap receiving terminals
Cheniere’s retention of remaining capacity is
strategically important
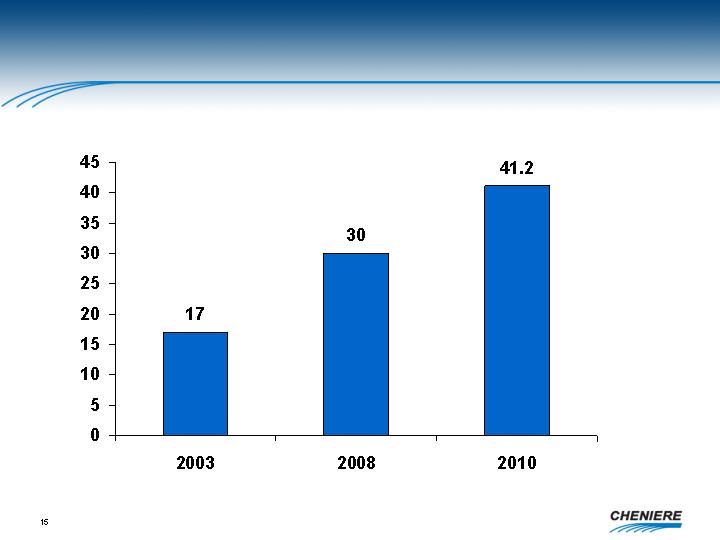
Projected Liquefaction Growth
Source: Cheniere Research
Bcf/d
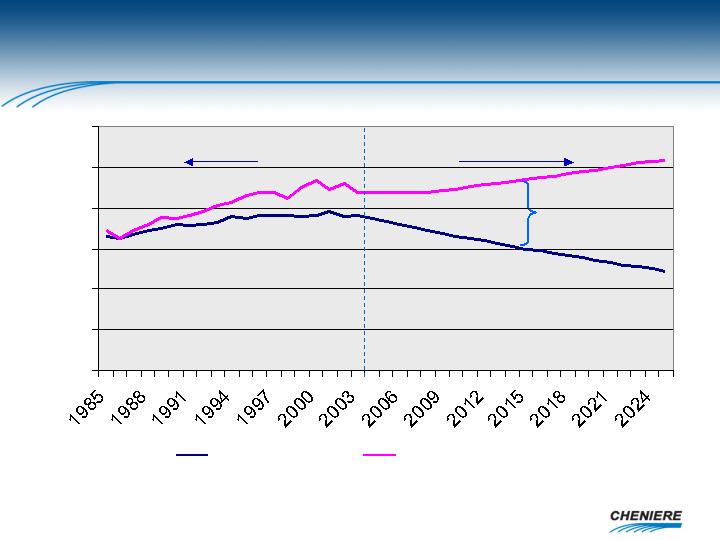
Production vs Consumption (Tcf)
Cheniere estimate based on 2% annual average decline in production,
1% annual average growth in consumption post-2008 based on EIA, AEO
Historical production and consumption EIA
8 Tcf or
22 Bcf/d
0
5
10
15
20
25
30
Forecast
Historical
Domestic Production
Consumption
16
U.S. Onshore Regasification Terminals
Currently Under Construction
S a b i n e P a s s L N G
F r e e p o r t L N G
Future Business Development
3.9
Total
1.0
Index Gas
Purchases
11.4
4.9
2.0
1.3
3.2
Total
3.3
2.3
1.0
Creole Trail
2.6
1.6
1.0
Corpus
Christi
4.0
1.0
1.3
1.7
Sabine Pass
1.5
1.5
Freeport
Total
Excess
Capacity
Marketing
Efforts
TUA
Opportunities
Under
Negotiation
Contracted
TUAs
Bcf/d
Indexed Purchase Agreement Model
Regasification costs and transportation to
liquidity points
Additional Costs:
At $4.00 Mcf; $0.68 per MMbtu; $260 million
Revenue Example:
Seller’s responsibility
Shipping:
83% of NYMEX
Cost Assumption:
U.S. Gulf Coast at any Cheniere LNG
regasification terminal
Delivery:
Volume: 1 Bcf/d

Long-Term Model
$MM
Freeport
15
Contracted TUAs
215
Optioned – subject to negotiation
129
TUAs Under Marketing Efforts
250
$609
Potential Indexed Gas
Purchases - 1 Bcf/d
$260
Total Potential Revenues
$845
Cheniere Future Business
Development (Bcf/d)
3.9
NOTE: These are revenue objectives and are subject to operating expenses, transportation, fuel, and terminal location.
Excess Capacity for