Corporate Presentation
January 2005
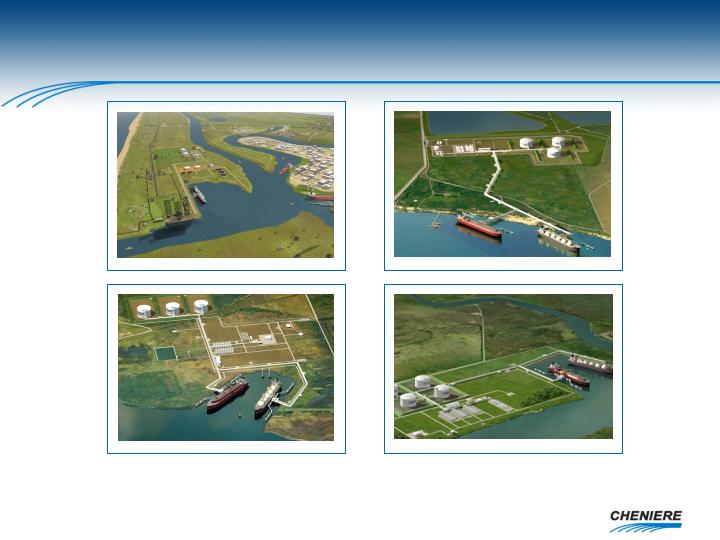
*Artist’s Rendition
*Creole Trail LNG L.P. (Cheniere 100%)
*Corpus Christi LNG L.P. (Cheniere G.P. & 67% L.P.)
*Sabine Pass LNG L.P. (Cheniere 100%)
*Freeport LNG L.P. (Cheniere 30% Limited Partner)
Cheniere Energy, Inc.
Safe Harbor Act Statement Under the Private Securities Litigation Reform Act of 1995: Certain information in this presentation are forward looking statements that are based on management's belief, as well as assumptions made by, and information currently available to management. While the company believes that its expectations are based upon reasonable assumptions, there can be no assurances that the company's financial goals will be realized. Numerous uncertainties and risk factors may affect the company's actual results and may cause results to differ materially from those expressed in forward-looking statements made by or on behalf of the company. These uncertainties and risk factors include political, economic, environmental and geological issues, including but not limited to, the continued need for additional capital, the competition within the oil and gas industry, the price of oil and gas, currency fluctuations, and other risks detailed from time to time in the company's periodic reports filed with the United States Securities and Exchange Commission.
Safe Harbor Act
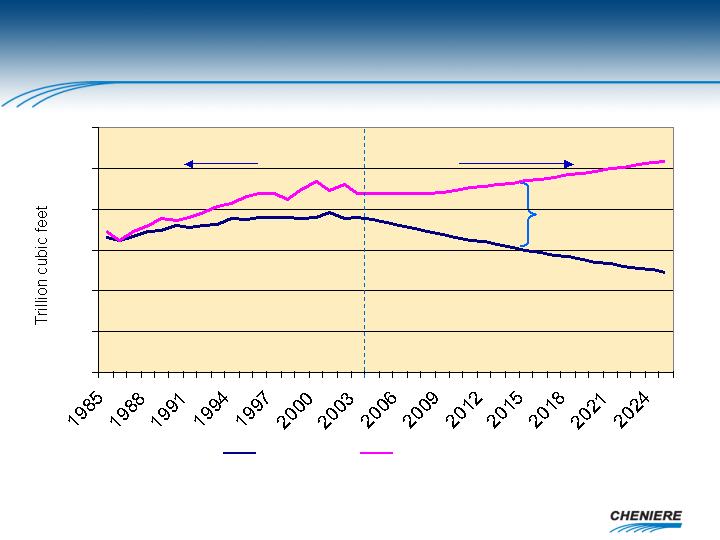
Cheniere estimate based on 2% annual average decline in production,
1% annual average growth in consumption post-2008
8 Tcf
0
5
10
15
20
25
30
Forecast
Historical
Production
Consumption
Production vs Consumption (Tcf)
Source: IHS Energy
Domestic Production
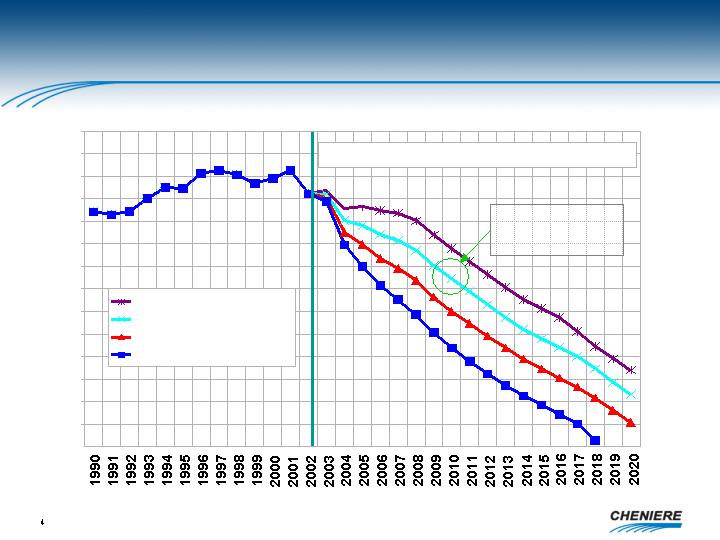
US Lower 48 Dry Gas Production Forecast
25
27
29
31
33
35
37
39
41
43
45
47
49
51
53
$6/Mcf (89% Rig Utilization)
$5/Mcf (83% Rig Utilization)
$4/Mcf (77% Rig Utilization)
$3/Mcf (71% Rig Utilization)
Bcf/d
Estimate ------------------------------------------------- >
Bcm/d
1.48
1.42
1.37
1.31
1.26
1.14
1.09
1.03
0.98
0.92
0.86
0.81
0.75
0.70
1.20
$5.00 @ 2010
40 Bcf/d
Gulf of Mexico Production
Source: PIRA, 2004
Shallow Water GoM
9.0 Bcf/d
2003 Total U.S. Production = 52 Bcf/d
Deep Water GoM
3.7 Bcf/d
Onshore Gulf
12.71 Bcf/d
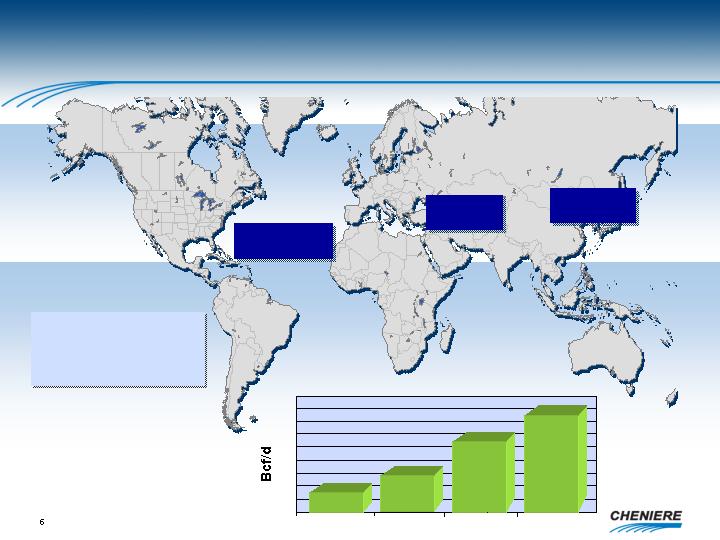
Supplies Ample
Existing &
Committed LNG Capacity 2010
Asia Pacific
14.2 Bcf/d
ME Gulf
12.5 Bcf/d
Atlantic Basin
14.5 Bcf/d
Liquefaction Growth
0
10
20
30
40
1997
2003
2010
30.5
17.1
12.9
2008
Source: GIIGNL, Cheniere Research
41.2
2003 LNG Consumption
Asia – 11 Bcf/d
Europe – 4 Bcf/d
Americas – 2 Bcf/d
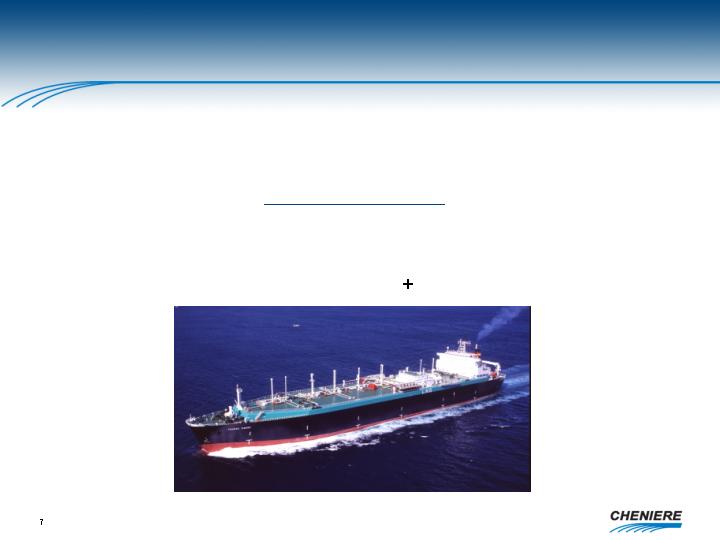
Committed Shipping Investment over $13 Billion by 2008
Source: *Poten & Partners July 2004
World Fleet*
Increasing number of ships uncommitted to a trade
Shipping
1995
2001
2003
2008
93
128
152
244
Status of Industry
In the next three years:
Liquefaction growth of 13.4 Bcf/d represents 78%
increase over next 3 years
Shipping growth of 92 vessels represents 60%
increase over next 3 years
The supply - demand gap in the US continues to
make this market the prime target for LNG producers
14 - 18 Bcf/d of regas capacity needed
Bottleneck: U.S. receiving capacity
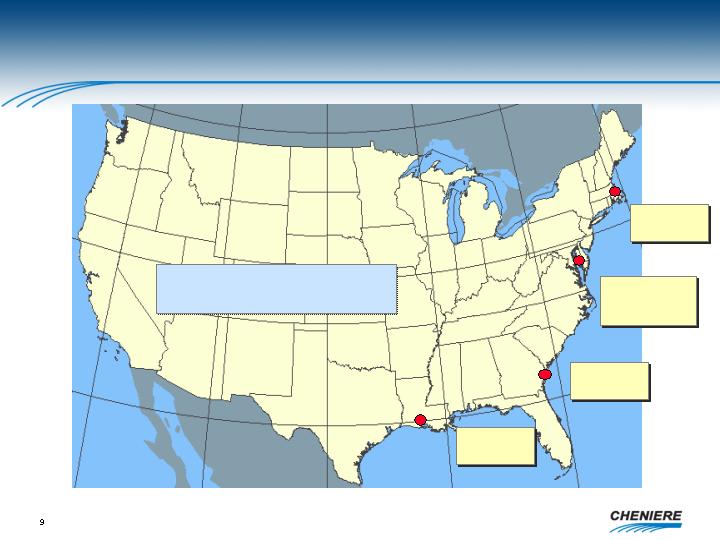
-
Everett
Closed Access
- Tractebel
Cove Pt.
Fully-reserved
- BP, Statoil & Shell
Elba Island
Fully-reserved
- BG, Marathon
Lake Charles
Fully-reserved
- BG
US LNG Import Facilities
Existing 2.5 Bcf/d
Expanded 5.0 Bcf/d
Source: EIA, FERC, Cheniere Research
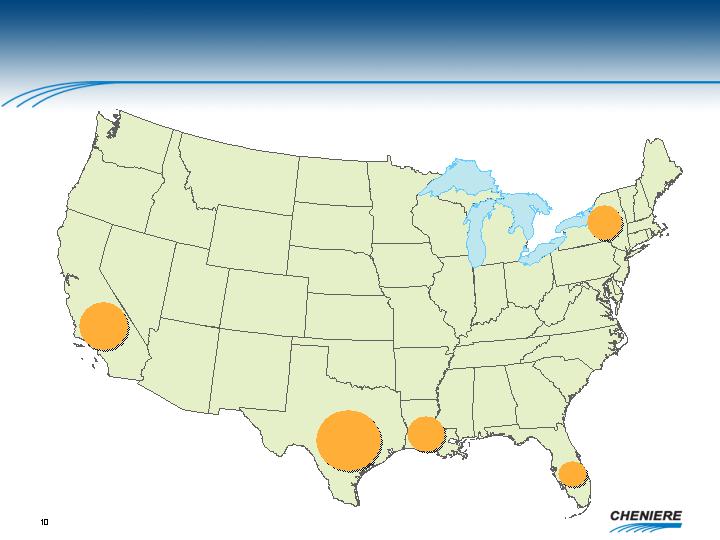
Coastal States Gas Consumption
1.0
1.7
0.9
0.8
1.1
0.5
0.6
0.2
0.5
0.6
0.7
Top 5 Coastal Consumers
TX, CA, LA, NY, FLA
Source: EIA, NG Monthly, April 2004
In Bcf/d
2002
10.8
3.2
1.8
6.1
3.2
Source: EIAGIS-Natural Gas Annual, 2001
11
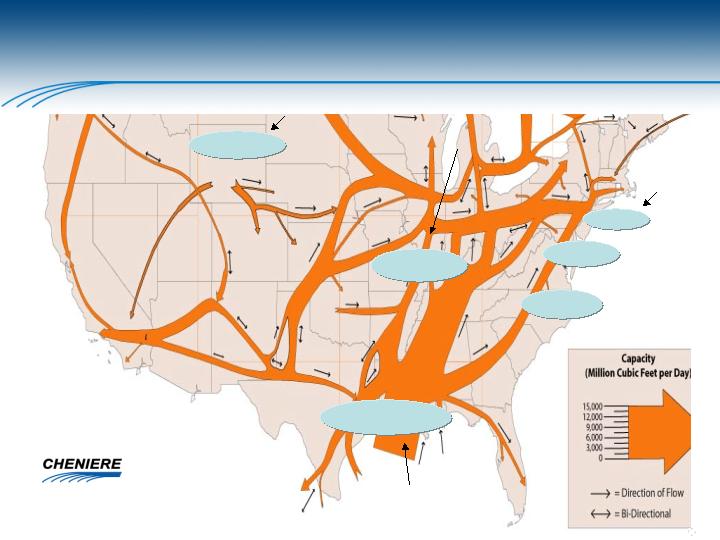
Source: EIA
US Gas Flows - 2001
Into Chicago
Area Hub
Canada to MW
From Gulf Coast
Production
Canada
to NE
Into NY
Metro Area
Into Boston
Metro Area
5.8 Bcf/d
0.5 Bcf/d
0.8 Bcf/d
1.8 Bcf/d
7.2 Bcf/d
19 Bcf/d
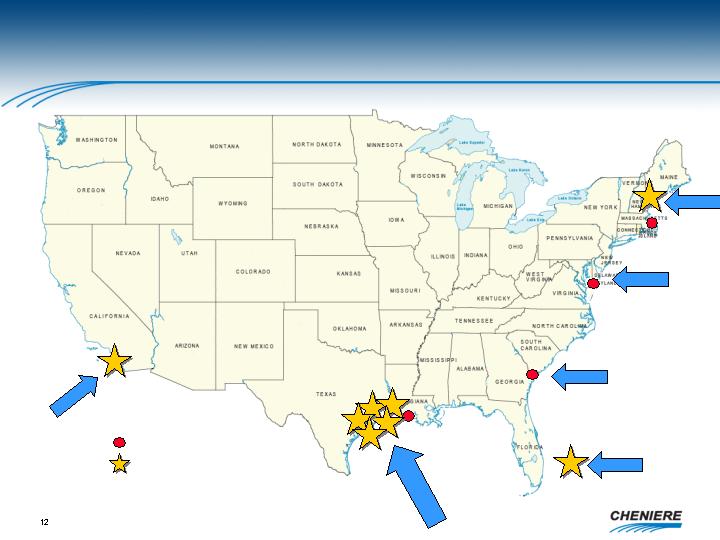
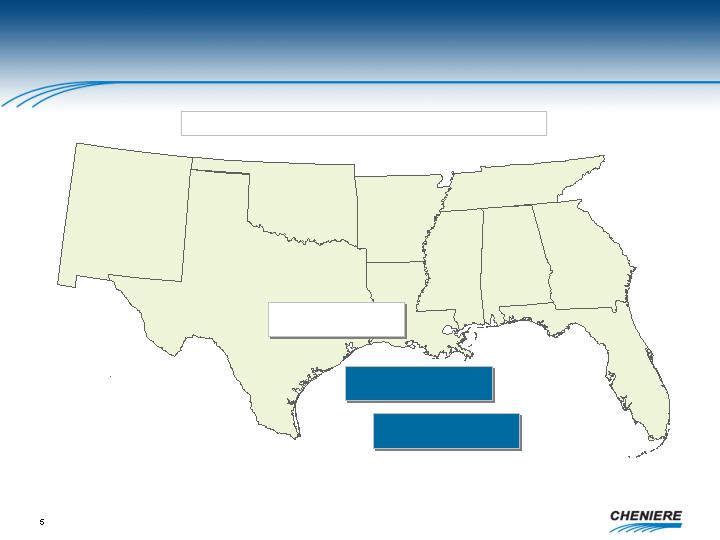
U.S. Regasification Terminal Locations
2010
Existing Facilities
New Terminals
Cheniere Expectation
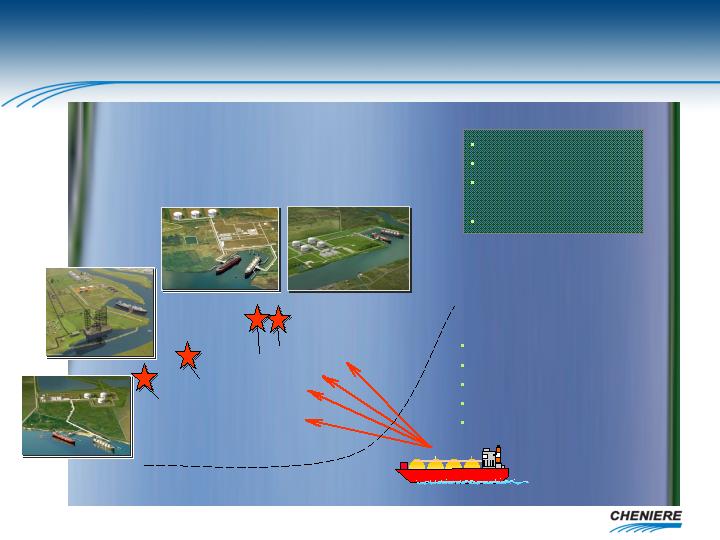
Creole Trail
4 Deepwater Ports
7 Unloading Docks
12 Storage Tanks
(40 Bcf equivalent)
10 Bcf/d Sendout
Cheniere LNG Receipt Network
Optionality
Flexibility
Reliability
Liquidity
Low Cost
Corpus Christi
Freeport LNG L.P.
Sabine Pass
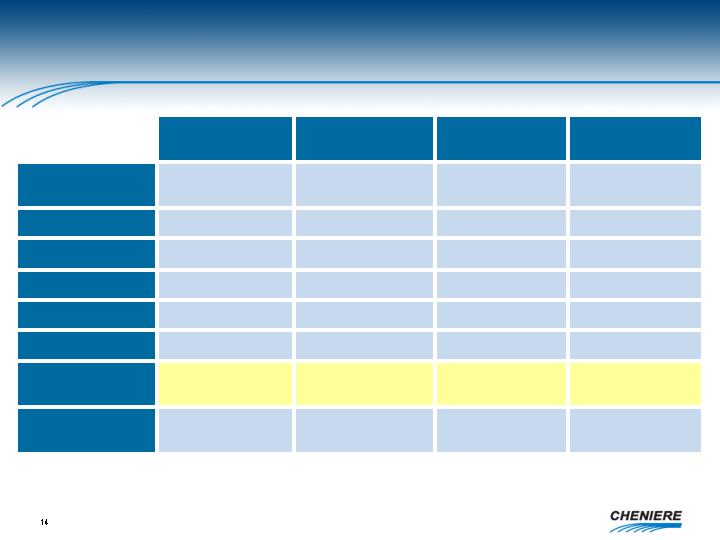
Project Overviews
NEPA Pre-filing
Start Jan 2005
Expected
Q2 2005
December 2004
June 2004
FERC Permit
1463 acres
610 acres
568 acres
233 acres
Land
Q3 2006
Q3 2005
Q1 2005
Q1 2005
Estimated
Ground Breaking
13.5 Bcfe
10.1 Bcfe
10.1 Bcfe
6.7 Bcfe
Storage Capacity
$850 - $950
million
$650 - $750
million
$750 – $850
million
$650 – $750
million
Capex*
4 tanks
3 tanks
3 tanks
2 tanks
Tanks
2 docks
3.3 Bcf/d
Creole Trail
2 docks
2 docks
1 dock
Berths
Initial Capacity
2.6 Bcf/d
2.6 Bcf/d
1.5 Bcf/d
Corpus Christi
Sabine Pass
Freeport LNG**
*Estimated construction costs before financing costs
**Freeport LNG L.P. (Cheniere 30% Limited Partner)
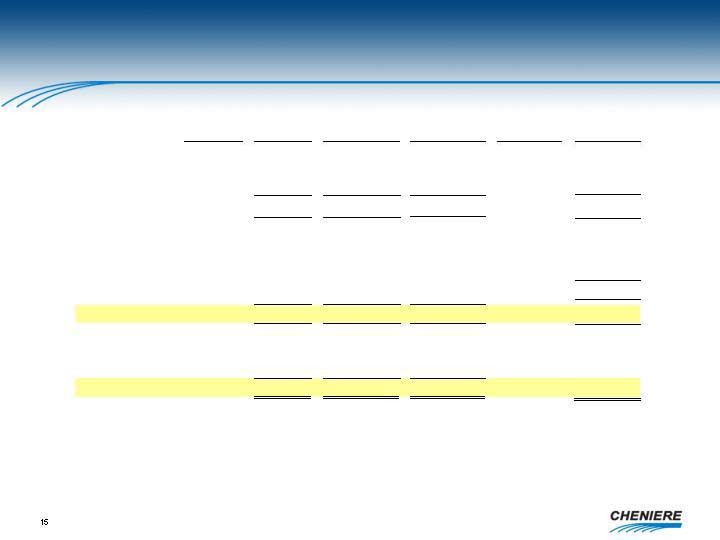
Terminal Capacity Sales & Cheniere Financial Impact
Total
Retained
Long-term
Tariff
*Calculated
TUA
Capacity
Capacity
TUAs
Rate
Revenues to Cheniere
Status
(Bcf/d)
(Bcf/d)
(Bcf/d)
($/Mmbtu)
($MM)
Freeport LNG L.P. (Cheniere 30% Limited Partner)
ConocoPhillips
Contracted
-
1.0
Dow Chemical
Contracted
-
0.5
1.5
-
1.5
15
$
Sabine Pass
Total S.A.
Contracted
-
1.0
0.32
$
125
**ChevronTexaco
-
0.7
0.32
$
90
2.6
0.9
1.7
215
Total to date – Contracted
4.1
0.9
3.2
230
Corpus Christi LNG
(Cheniere 67% Limited Partner)
Marketing
2.6
1.1
1.5
?
Creole Trail
Marketing
3.3
1.3
2.0
?
Total
10.0
3.3
6.7
?
Expansions
Potential
2.0
2.0
-
?
Note: Operating expenses for the Sabine Pass terminal (2.6 Bcf/d capacity) are estimated to be $25-30 MM/year.
Sabine Pass will also retain 2% of throughput for fuel usage.
*Calculated revenues are based solely on TUA’s currently contracted and reflect numerous assumptions. In the case of Freeport LNG L.P.
revenues, they represent the mid-point of the currently estimated pre-tax cash distributions for our minority interest of $10-20 MM/year.
**ChevronTexaco has the option to reduce to 500 MMcf/d until July 2005 or increase to 1 Bcf/d by December 2005.
Contracted
$
Low Risk Base Business
Provider of service for fees
Conventional, proved technology
Anchor customer strategy
Large customers: 500 MMcf/d - 1 Bcf/d each
Credit-worthy
Long-term commitments – take or pay
Covers facility costs, debt service, reasonable equity return
Cheniere’s Competitive Advantage
Early mover = prime real estate
Low cost supplier of LNG regas capacity
Local support
Size of sites
Economies of scale
Existing technology
Transparency: $0.32/MMbtu
Flexibility
Logistics
Marketing
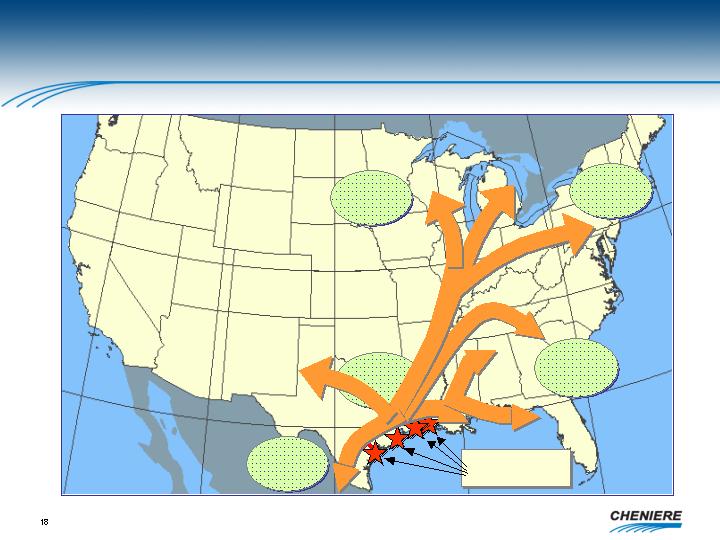
Target Gas Demand Corridor
Market Access – 29 Bcf/d
Cheniere LNG
Receipt Network
Source: Cheniere Research
Mexican
Markets
1.7 Bcf/d
Gulf Coast
Markets
4.9 Bcfd
Southeast
Markets
4.6 Bcfd
Northeast
Markets
5.7 Bcfd
Midwest
Markets
11.8 Bcfd