Exhibit 99.2
Link to searchable text of slide shown above
Link to searchable text of slide shown above
Link to searchable text of slide shown above
Link to searchable text of slide shown above
Link to searchable text of slide shown above
Link to searchable text of slide shown above
Link to searchable text of slide shown above
Link to searchable text of slide shown above
Link to searchable text of slide shown above
Link to searchable text of slide shown above
Link to searchable text of slide shown above
Link to searchable text of slide shown above
Link to searchable text of slide shown above
Link to searchable text of slide shown above
Link to searchable text of slide shown above
Link to searchable text of slide shown above
Link to searchable text of slide shown above
Link to searchable text of slide shown above
Searchable text section of graphics shown above
Cheniere Energy, Inc.
Corporate Presentation
November 2004
[LOGO]
Safe Harbor Act
Safe Harbor Act Statement Under the Private Securities Litigation Reform Act of 1995: Certain information in this presentation are forward looking statements that are based on management’s belief, as well as assumptions made by, and information currently available to management. While the company believes that its expectations are based upon reasonable assumptions, there can be no assurances that the company’s financial goals will be realized. Numerous uncertainties and risk factors may affect the company’s actual results and may cause results to differ materially from those expressed in forward-looking statements made by or on behalf of the company. These uncertainties and risk factors include political, economic, environmental and geological issues, including but not limited to, the continued need for additional capital, the competition within the oil and gas industry, the price of oil and gas, currency fluctuations, and other risks detailed from time to time in the company’s periodic reports filed with the United States Securities and Exchange Commission.
[LOGO]
2
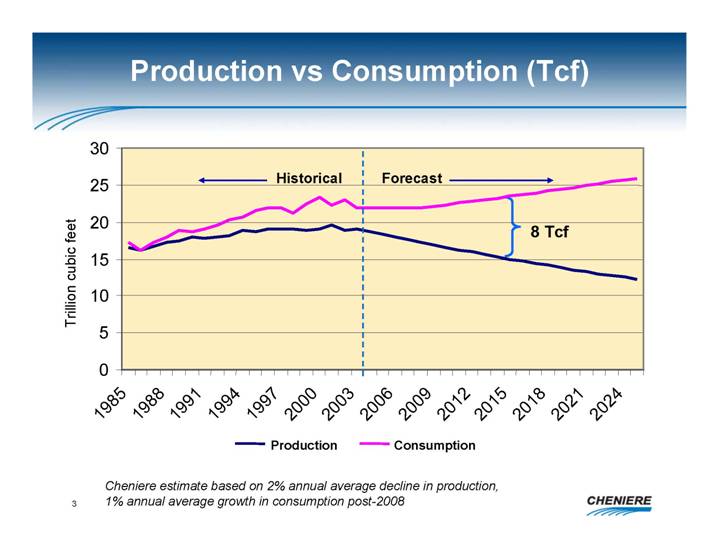
Production vs Consumption (Tcf)
[CHART]
Cheniere estimate based on 2% annual average decline in production, 1% annual average growth in consumption post-2008
3
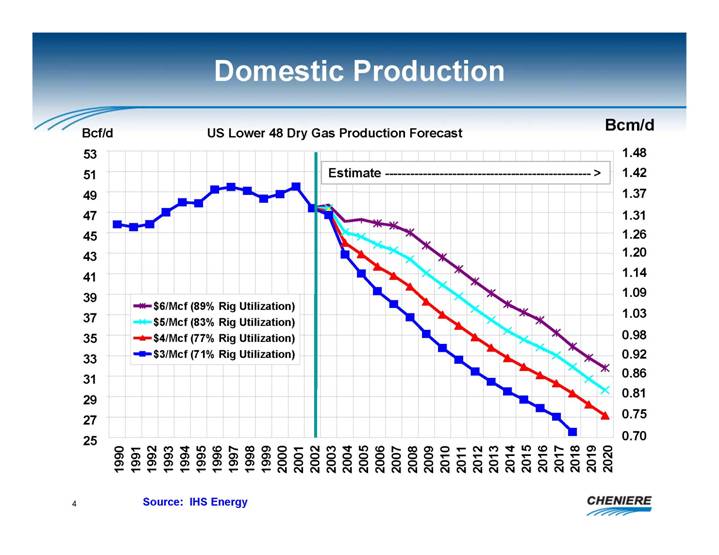
Domestic Production
US Lower 48 Dry Gas Production Forecast
[CHART]
Source: IHS Energy
4
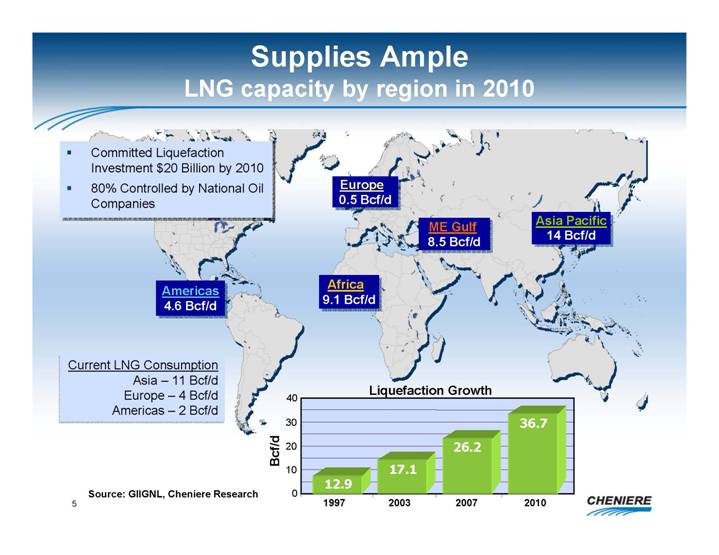
Supplies Ample
LNG
capacity by region in 2010
[GRAPHIC]
• Committed Liquefaction Investment $20 Billion by 2010
• 80% Controlled by National Oil Companies
Current LNG Consumption
Asia – 11 Bcf/d
Europe – 4 Bcf/d
Americas –2 Bcf/d
Liquefaction Growth
[CHART]
Source: GIIGNL, Cheniere Research
5
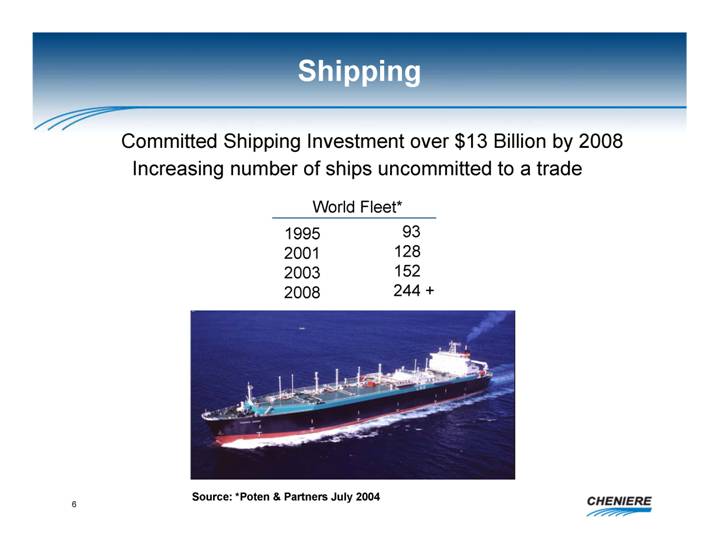
Shipping
Committed Shipping Investment over $13 Billion by 2008
Increasing number of ships uncommitted to a trade
|
World Fleet* |
|
||
|
1995 |
|
93 |
|
|
2001 |
|
128 |
|
|
2003 |
|
152 |
|
|
2008 |
|
244 |
+ |
[GRAPHIC]
Source: *Poten & Partners July 2004
6
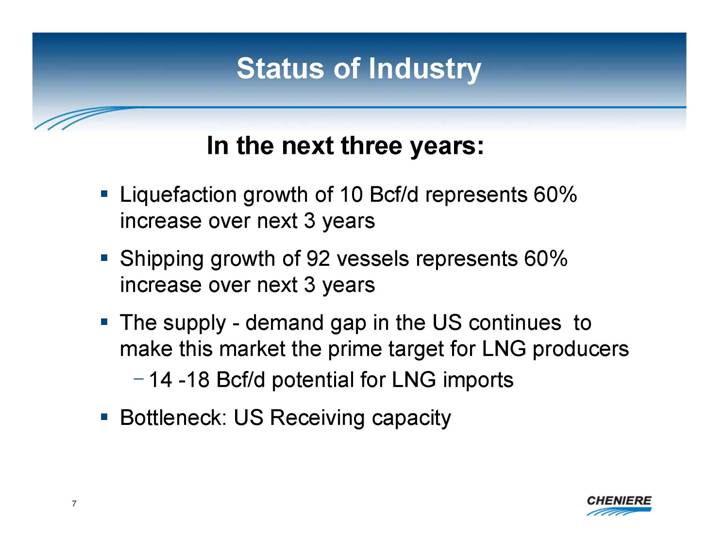
Status of Industry
In the next three years:
• Liquefaction growth of 10 Bcf/d represents 60% increase over next 3 years
• Shipping growth of 92 vessels represents 60% increase over next 3 years
• The supply - demand gap in the US continues to make this market the prime target for LNG producers
• 14 - -18 Bcf/d potential for LNG imports
• Bottleneck: US Receiving capacity
7
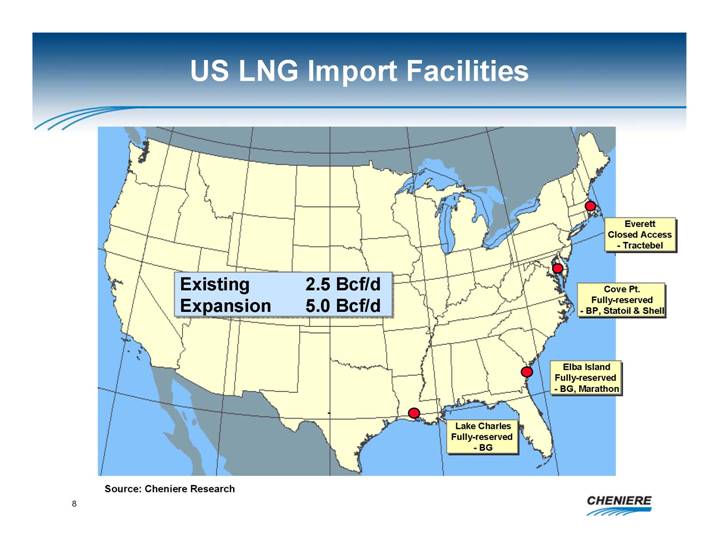
US LNG Import Facilities
[GRAPHIC]
Source: Cheniere Research
8
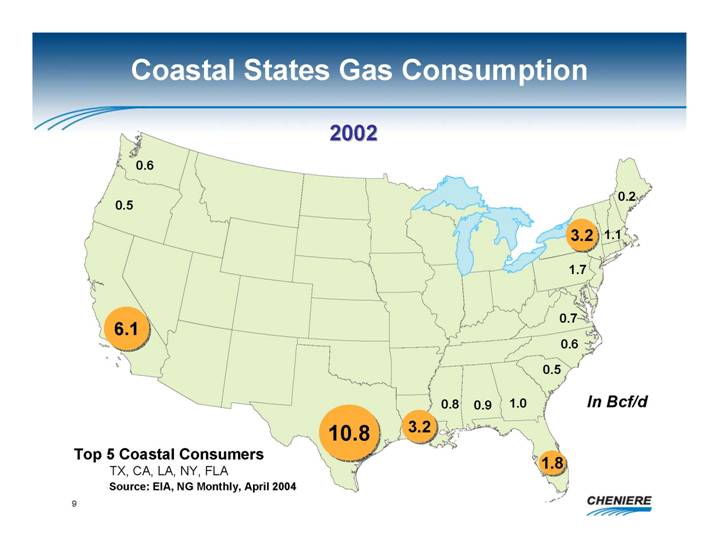
Coastal States Gas Consumption
2002
[GRAPHIC]
Top 5 Coastal Consumers
TX, CA, LA, NY, FLA
Source: EIA, NG Monthly, April 2004
9
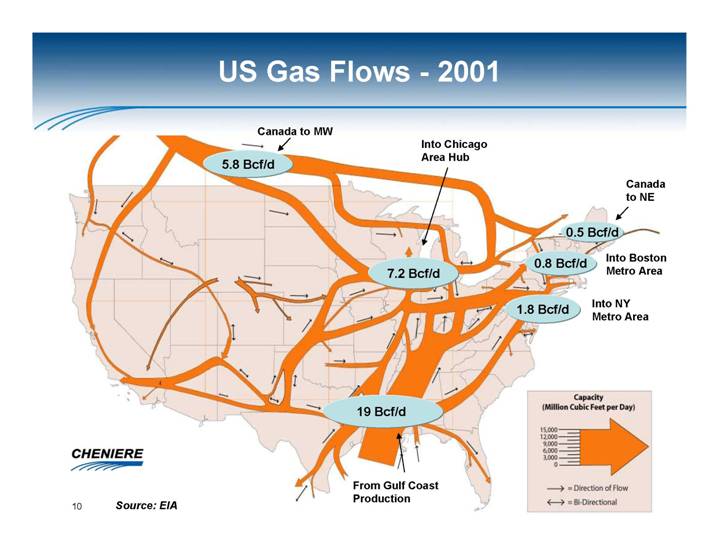
US Gas Flows - 2001
[GRAPHIC]
Capacity
(Million Cubic Feet per Day)
[GRAPHIC]
Source: EIA
10
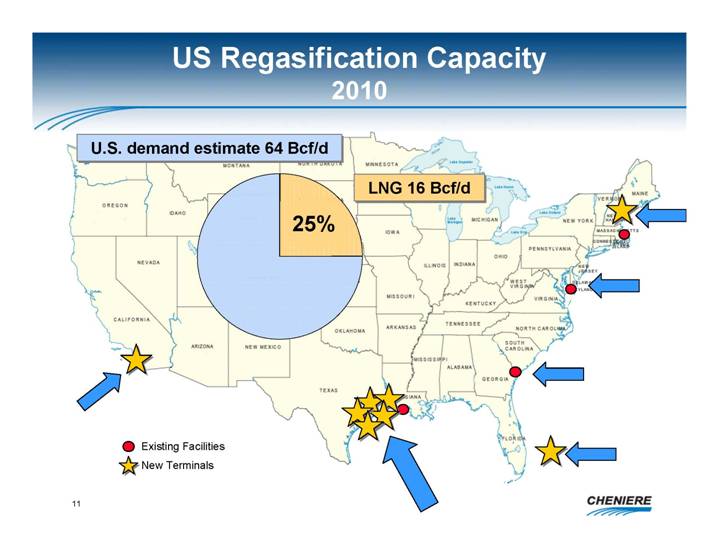
US Regasification Capacity
2010
[GRAPHIC]
11
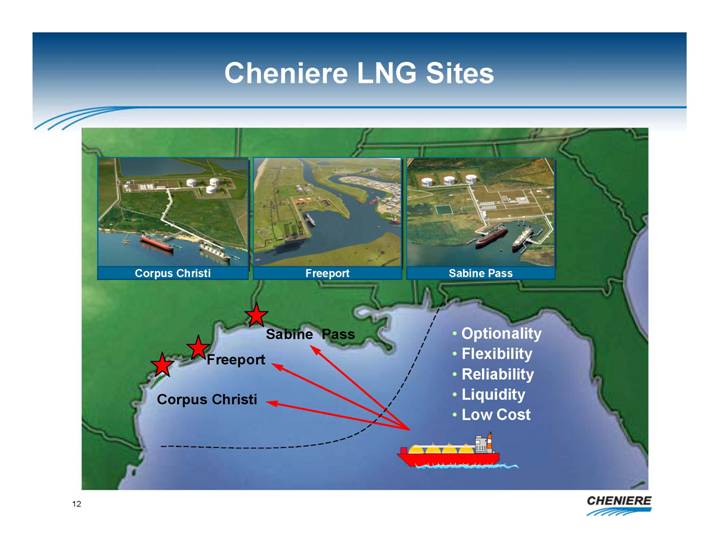
Cheniere LNG Sites
[GRAPHIC]
• Optionality
• Flexibility
• Reliability
• Liquidity
• Low Cost
12
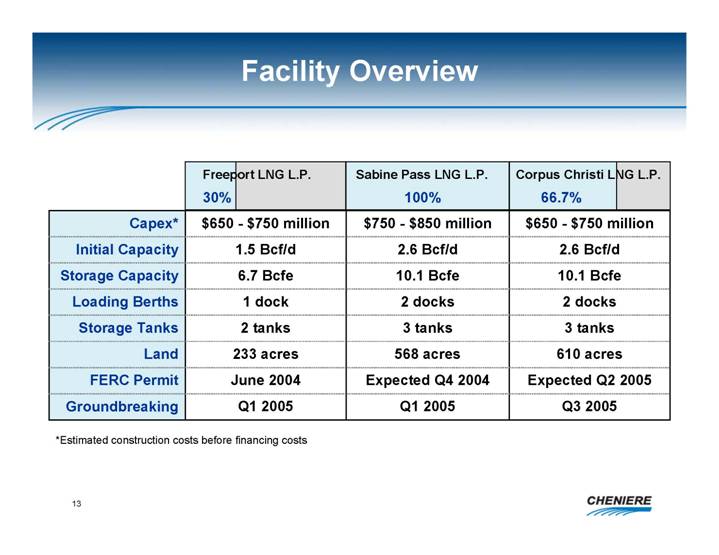
Facility Overview
|
|
|
Freeport LNG L.P. |
|
Sabine Pass LNG L.P. |
|
Corpus Christi LNG L.P. |
|
|
Capex* |
|
$650 - $750 million |
|
$750 - $850 million |
|
$650 - $750 million |
|
|
Initial Capacity |
|
1.5 Bcf/d |
|
2.6 Bcf/d |
|
2.6 Bcf/d |
|
|
Storage Capacity |
|
6.7 Bcfe |
|
10.1 Bcfe |
|
10.1 Bcfe |
|
|
Loading Berths |
|
1 dock |
|
2 docks |
|
2 docks |
|
|
Storage Tanks |
|
2 tanks |
|
3 tanks |
|
3 tanks |
|
|
Land |
|
233 acres |
|
568 acres |
|
610 acres |
|
|
FERC Permit |
|
June 2004 |
|
Expected Q4 2004 |
|
Expected Q2 2005 |
|
|
Groundbreaking |
|
Q1 2005 |
|
Q1 2005 |
|
Q3 2005 |
|
*Estimated construction costs before financing costs
13
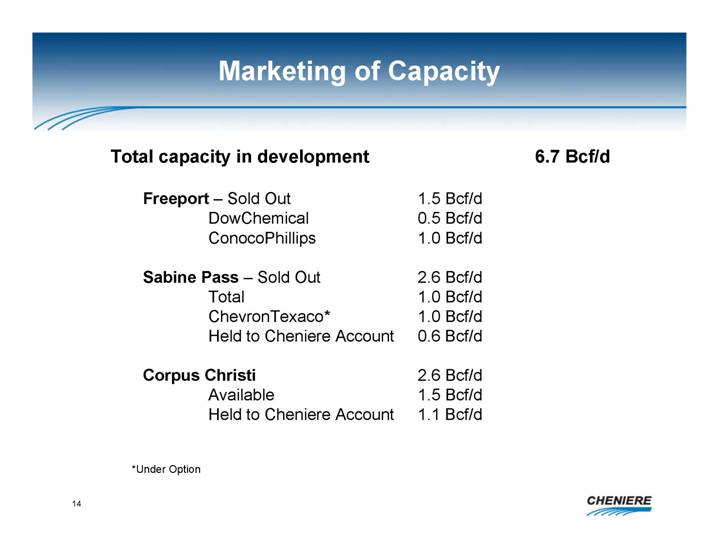
Marketing of Capacity
|
Total capacity in development |
6.7 Bcf/d |
||
|
|
|
||
|
Freeport – Sold Out |
|
1.5 Bcf/d |
|
|
DowChemical |
|
0.5 Bcf/d |
|
|
ConocoPhillips |
|
1.0 Bcf/d |
|
|
|
|
|
|
|
Sabine Pass – Sold Out |
|
2.6 Bcf/d |
|
|
Total |
|
1.0 Bcf/d |
|
|
ChevronTexaco* |
|
1.0 Bcf/d |
|
|
Held to Cheniere Account |
|
0.6 Bcf/d |
|
|
|
|
|
|
|
Corpus Christi |
|
2.6 Bcf/d |
|
|
Available |
|
1.5 Bcf/d |
|
|
Held to Cheniere Account |
|
1.1 Bcf/d |
|
*Under Option
14
Low Risk Base Business
• Provider of service for fees (no gas risk)
• Conventional, proved technology
• Anchor customer strategy
• Large customers – 500 MMcf/d - 1 Bcf/d each
• A rated credit or better
• Long term commitments – 20 years or more – take or pay
• Covers facility costs, debt service, and moderate equity return
15
Service Provider Model Economics
Freeport LNG, L.P – Cheniere 30% Limited Partner
• Capacity: 1.5 Bcf/d
• CAPEX: Estimate $650 - $750 million Financed by ConocoPhillips
• ConocoPhillips – terminal usage fee sufficient to recover financing and pro-rata costs; plus throughput fee $0.05/Mcf on 1 Bcf/d
• Dow Chemical - Long-term capacity fee
Sabine Pass LNG L.P.
• Capacity: 2.6 Bcf/d each
• CAPEX: Estimate $750 - $850 million
• ChevronTexaco and Total - 2 Bcf/d @ $0.32/MMbtu
• Project Financing $741 million debt through HSBC & Société Générale
• Project Equity ChevronTexaco negotiating $200 million for 20% interest
Corpus Christi LNG L.P. – will use Sabine Pass model
16
Cheniere’s Competitive Advantage
• Low cost supplier of LNG regas capacity
• Gulf Coast provides highest market optionality
• Early mover = best sites
• Gulf Coast allows large capacity terminals = low unit cost
• Large sites allow use of existing technology = low capital cost
• Low execution risk
• Conventional proven technology
• Anchor contracts for 40 – 60% of capacity
• Strong public support
• Excellent growth potential
• Flexible use of additional capacity
• Expansion potential
• Future value chain integration
17
Immediate Goals
• Break ground at Freeport
• Finalize Sabine Pass construction turnkey
• Permit for Sabine Pass
• Close financings for Sabine Pass
• Break ground at Sabine Pass
• Sell 1 to 1.5 Bcf/d of capacity at Corpus
• Permit for Corpus
18