0000003570false--12-312025Q3http://fasb.org/us-gaap/2025#Revenueshttp://fasb.org/us-gaap/2025#Revenueshttp://fasb.org/us-gaap/2025#Revenueshttp://fasb.org/us-gaap/2025#Revenueshttp://fasb.org/us-gaap/2025#DerivativeAssetsCurrenthttp://fasb.org/us-gaap/2025#DerivativeAssetsCurrenthttp://fasb.org/us-gaap/2025#DerivativeAssetsNoncurrenthttp://fasb.org/us-gaap/2025#DerivativeAssetsNoncurrenthttp://fasb.org/us-gaap/2025#DerivativeLiabilitiesCurrenthttp://fasb.org/us-gaap/2025#DerivativeLiabilitiesCurrenthttp://fasb.org/us-gaap/2025#DerivativeLiabilitiesNoncurrenthttp://fasb.org/us-gaap/2025#DerivativeLiabilitiesNoncurrenthttp://fasb.org/us-gaap/2025#DerivativeAssetsCurrenthttp://fasb.org/us-gaap/2025#DerivativeAssetsCurrenthttp://fasb.org/us-gaap/2025#DerivativeAssetsNoncurrenthttp://fasb.org/us-gaap/2025#DerivativeAssetsNoncurrenthttp://fasb.org/us-gaap/2025#DerivativeLiabilitiesCurrenthttp://fasb.org/us-gaap/2025#DerivativeLiabilitiesCurrenthttp://fasb.org/us-gaap/2025#DerivativeLiabilitiesNoncurrenthttp://fasb.org/us-gaap/2025#DerivativeLiabilitiesNoncurrentSOFR or base rateSOFR or base rateSOFR or base rateSOFR or base rateSOFR or base rate1xbrli:sharesiso4217:USDiso4217:USDxbrli:shareslng:unitlng:itemutr:mixbrli:purelng:tbtulng:units00000035702025-01-012025-09-3000000035702025-10-240000003570lng:LiquefiedNaturalGasMember2025-07-012025-09-300000003570lng:LiquefiedNaturalGasMember2024-07-012024-09-300000003570lng:LiquefiedNaturalGasMember2025-01-012025-09-300000003570lng:LiquefiedNaturalGasMember2024-01-012024-09-300000003570lng:RegasificationServiceMember2025-07-012025-09-300000003570lng:RegasificationServiceMember2024-07-012024-09-300000003570lng:RegasificationServiceMember2025-01-012025-09-300000003570lng:RegasificationServiceMember2024-01-012024-09-300000003570us-gaap:ProductAndServiceOtherMember2025-07-012025-09-300000003570us-gaap:ProductAndServiceOtherMember2024-07-012024-09-300000003570us-gaap:ProductAndServiceOtherMember2025-01-012025-09-300000003570us-gaap:ProductAndServiceOtherMember2024-01-012024-09-3000000035702025-07-012025-09-3000000035702024-07-012024-09-3000000035702024-01-012024-09-3000000035702025-09-3000000035702024-12-310000003570us-gaap:VariableInterestEntityPrimaryBeneficiaryMember2025-09-300000003570us-gaap:CommonStockMember2024-12-310000003570us-gaap:TreasuryStockCommonMember2024-12-310000003570us-gaap:AdditionalPaidInCapitalMember2024-12-310000003570us-gaap:RetainedEarningsMember2024-12-310000003570us-gaap:NoncontrollingInterestMember2024-12-310000003570lng:RedeemableNoncontrollingInterestMember2024-12-310000003570us-gaap:RetainedEarningsMember2025-01-012025-03-310000003570us-gaap:NoncontrollingInterestMember2025-01-012025-03-3100000035702025-01-012025-03-310000003570lng:RedeemableNoncontrollingInterestMember2025-01-012025-03-310000003570lng:O2025Q1DividendsMember2025-04-012025-06-300000003570us-gaap:CommonStockMember2025-01-012025-03-310000003570us-gaap:TreasuryStockCommonMember2025-01-012025-03-310000003570us-gaap:AdditionalPaidInCapitalMember2025-01-012025-03-310000003570us-gaap:CommonStockMember2025-03-310000003570us-gaap:TreasuryStockCommonMember2025-03-310000003570us-gaap:AdditionalPaidInCapitalMember2025-03-310000003570us-gaap:RetainedEarningsMember2025-03-310000003570us-gaap:NoncontrollingInterestMember2025-03-3100000035702025-03-310000003570lng:RedeemableNoncontrollingInterestMember2025-03-310000003570us-gaap:RetainedEarningsMember2025-04-012025-06-300000003570us-gaap:NoncontrollingInterestMember2025-04-012025-06-3000000035702025-04-012025-06-300000003570lng:RedeemableNoncontrollingInterestMember2025-04-012025-06-300000003570lng:O2025Q21DividendsMember2025-04-012025-06-300000003570lng:O2025Q22DividendsMember2025-04-012025-06-300000003570us-gaap:CommonStockMember2025-04-012025-06-300000003570us-gaap:TreasuryStockCommonMember2025-04-012025-06-300000003570us-gaap:AdditionalPaidInCapitalMember2025-04-012025-06-300000003570us-gaap:CommonStockMember2025-06-300000003570us-gaap:TreasuryStockCommonMember2025-06-300000003570us-gaap:AdditionalPaidInCapitalMember2025-06-300000003570us-gaap:RetainedEarningsMember2025-06-300000003570us-gaap:NoncontrollingInterestMember2025-06-3000000035702025-06-300000003570lng:RedeemableNoncontrollingInterestMember2025-06-300000003570us-gaap:RetainedEarningsMember2025-07-012025-09-300000003570us-gaap:NoncontrollingInterestMember2025-07-012025-09-300000003570lng:RedeemableNoncontrollingInterestMember2025-07-012025-09-300000003570us-gaap:CommonStockMember2025-07-012025-09-300000003570us-gaap:TreasuryStockCommonMember2025-07-012025-09-300000003570us-gaap:AdditionalPaidInCapitalMember2025-07-012025-09-300000003570us-gaap:CommonStockMember2025-09-300000003570us-gaap:TreasuryStockCommonMember2025-09-300000003570us-gaap:AdditionalPaidInCapitalMember2025-09-300000003570us-gaap:RetainedEarningsMember2025-09-300000003570us-gaap:NoncontrollingInterestMember2025-09-300000003570lng:RedeemableNoncontrollingInterestMember2025-09-300000003570us-gaap:CommonStockMember2023-12-310000003570us-gaap:TreasuryStockCommonMember2023-12-310000003570us-gaap:AdditionalPaidInCapitalMember2023-12-310000003570us-gaap:RetainedEarningsMember2023-12-310000003570us-gaap:NoncontrollingInterestMember2023-12-3100000035702023-12-310000003570lng:RedeemableNoncontrollingInterestMember2023-12-310000003570us-gaap:RetainedEarningsMember2024-01-012024-03-310000003570us-gaap:NoncontrollingInterestMember2024-01-012024-03-3100000035702024-01-012024-03-310000003570lng:O2024Q1DividendsMember2024-01-012024-03-310000003570us-gaap:CommonStockMember2024-01-012024-03-310000003570us-gaap:TreasuryStockCommonMember2024-01-012024-03-310000003570lng:RedeemableNoncontrollingInterestMember2024-01-012024-03-310000003570us-gaap:AdditionalPaidInCapitalMember2024-01-012024-03-310000003570us-gaap:CommonStockMember2024-03-310000003570us-gaap:TreasuryStockCommonMember2024-03-310000003570us-gaap:AdditionalPaidInCapitalMember2024-03-310000003570us-gaap:RetainedEarningsMember2024-03-310000003570us-gaap:NoncontrollingInterestMember2024-03-3100000035702024-03-310000003570lng:RedeemableNoncontrollingInterestMember2024-03-310000003570us-gaap:RetainedEarningsMember2024-04-012024-06-300000003570us-gaap:NoncontrollingInterestMember2024-04-012024-06-3000000035702024-04-012024-06-300000003570lng:O2024Q21DividendsMember2024-04-012024-06-300000003570lng:O2024Q22DividendsMember2024-04-012024-06-300000003570us-gaap:CommonStockMember2024-04-012024-06-300000003570us-gaap:TreasuryStockCommonMember2024-04-012024-06-300000003570lng:RedeemableNoncontrollingInterestMember2024-04-012024-06-300000003570us-gaap:AdditionalPaidInCapitalMember2024-04-012024-06-300000003570us-gaap:CommonStockMember2024-06-300000003570us-gaap:TreasuryStockCommonMember2024-06-300000003570us-gaap:AdditionalPaidInCapitalMember2024-06-300000003570us-gaap:RetainedEarningsMember2024-06-300000003570us-gaap:NoncontrollingInterestMember2024-06-3000000035702024-06-300000003570lng:RedeemableNoncontrollingInterestMember2024-06-300000003570us-gaap:RetainedEarningsMember2024-07-012024-09-300000003570us-gaap:NoncontrollingInterestMember2024-07-012024-09-300000003570us-gaap:CommonStockMember2024-07-012024-09-300000003570us-gaap:TreasuryStockCommonMember2024-07-012024-09-300000003570us-gaap:AdditionalPaidInCapitalMember2024-07-012024-09-300000003570us-gaap:CommonStockMember2024-09-300000003570us-gaap:TreasuryStockCommonMember2024-09-300000003570us-gaap:AdditionalPaidInCapitalMember2024-09-300000003570us-gaap:RetainedEarningsMember2024-09-300000003570us-gaap:NoncontrollingInterestMember2024-09-3000000035702024-09-300000003570lng:RedeemableNoncontrollingInterestMember2024-09-300000003570srt:MinimumMember2025-01-012025-09-300000003570lng:UnderConstructionMembersrt:MinimumMember2025-01-012025-09-300000003570lng:OperationalStatusMembersrt:MinimumMemberlng:SabinePassLNGTerminalMember2025-01-012025-09-300000003570lng:SabinePassLNGTerminalMember2025-01-012025-09-300000003570lng:CreoleTrailPipelineMember2025-01-012025-09-300000003570lng:CheniereEnergyPartnersLPMemberus-gaap:GeneralPartnerMember2025-01-012025-09-300000003570lng:CheniereEnergyPartnersLPMember2025-01-012025-09-300000003570srt:MinimumMemberlng:CorpusChristiLNGTerminalMember2025-01-012025-09-300000003570lng:UnderConstructionMembersrt:MinimumMemberlng:CorpusChristiLNGTerminalMember2025-01-012025-09-300000003570lng:CorpusChristiLNGTerminalMember2025-01-012025-09-300000003570lng:CorpusChristiPipelineMember2025-01-012025-09-300000003570lng:CorpusChristiStage3ProjectMember2025-01-012025-09-300000003570srt:MinimumMemberlng:CorpusChristiStage3ProjectMember2025-01-012025-09-300000003570lng:UnderConstructionMemberlng:CorpusChristiStage3ProjectMember2025-01-012025-09-300000003570lng:OperationalStatusMemberlng:CorpusChristiStage3ProjectMember2025-01-012025-09-300000003570lng:MidscaleTrains89ProjectMember2025-01-012025-09-300000003570lng:UnderConstructionMemberlng:MidscaleTrains89ProjectMember2025-01-012025-09-300000003570lng:SabinePassLiquefactionAndCorpusChristiLiquefactionMember2025-09-300000003570lng:SabinePassLiquefactionAndCorpusChristiLiquefactionMember2024-12-310000003570lng:CheniereMarketingLLCMember2025-09-300000003570lng:CheniereMarketingLLCMember2024-12-310000003570lng:OtherSubsidiariesMember2025-09-300000003570lng:OtherSubsidiariesMember2024-12-310000003570lng:IncomeTaxReceivableMember2025-09-300000003570lng:IncomeTaxReceivableMember2024-12-310000003570lng:OtherReceivableMember2025-09-300000003570lng:OtherReceivableMember2024-12-310000003570lng:MaterialsInventoryMember2025-09-300000003570lng:MaterialsInventoryMember2024-12-310000003570lng:LiquefiedNaturalGasInventoryMember2025-09-300000003570lng:LiquefiedNaturalGasInventoryMember2024-12-310000003570lng:LiquefiedNaturalGasInTransitInventoryMember2025-09-300000003570lng:LiquefiedNaturalGasInTransitInventoryMember2024-12-310000003570lng:NaturalGasInventoryMember2025-09-300000003570lng:NaturalGasInventoryMember2024-12-310000003570lng:OtherInventoryMember2025-09-300000003570lng:OtherInventoryMember2024-12-310000003570lng:TerminalAndInterconnectingPipelineFacilitiesMember2025-09-300000003570lng:TerminalAndInterconnectingPipelineFacilitiesMember2024-12-310000003570us-gaap:LandAndLandImprovementsMember2025-09-300000003570us-gaap:LandAndLandImprovementsMember2024-12-310000003570us-gaap:ConstructionInProgressMember2025-09-300000003570us-gaap:ConstructionInProgressMember2024-12-310000003570lng:TerminalAndRelatedAssetsMember2025-09-300000003570lng:TerminalAndRelatedAssetsMember2024-12-310000003570us-gaap:OfficeEquipmentMember2025-09-300000003570us-gaap:OfficeEquipmentMember2024-12-310000003570us-gaap:FurnitureAndFixturesMember2025-09-300000003570us-gaap:FurnitureAndFixturesMember2024-12-310000003570us-gaap:SoftwareAndSoftwareDevelopmentCostsMember2025-09-300000003570us-gaap:SoftwareAndSoftwareDevelopmentCostsMember2024-12-310000003570us-gaap:LeaseholdImprovementsMember2025-09-300000003570us-gaap:LeaseholdImprovementsMember2024-12-310000003570us-gaap:OtherCapitalizedPropertyPlantAndEquipmentMember2025-09-300000003570us-gaap:OtherCapitalizedPropertyPlantAndEquipmentMember2024-12-310000003570lng:FixedAssetsMember2025-09-300000003570lng:FixedAssetsMember2024-12-310000003570us-gaap:AssetsHeldUnderCapitalLeasesMember2025-09-300000003570us-gaap:AssetsHeldUnderCapitalLeasesMember2024-12-310000003570us-gaap:PriceRiskDerivativeMemberus-gaap:FairValueInputsLevel1Member2025-09-300000003570us-gaap:PriceRiskDerivativeMemberus-gaap:FairValueInputsLevel2Member2025-09-300000003570us-gaap:PriceRiskDerivativeMemberus-gaap:FairValueInputsLevel3Member2025-09-300000003570us-gaap:PriceRiskDerivativeMember2025-09-300000003570us-gaap:PriceRiskDerivativeMemberus-gaap:FairValueInputsLevel1Member2024-12-310000003570us-gaap:PriceRiskDerivativeMemberus-gaap:FairValueInputsLevel2Member2024-12-310000003570us-gaap:PriceRiskDerivativeMemberus-gaap:FairValueInputsLevel3Member2024-12-310000003570us-gaap:PriceRiskDerivativeMember2024-12-310000003570lng:LNGTradingDerivativeMemberus-gaap:FairValueInputsLevel1Member2025-09-300000003570lng:LNGTradingDerivativeMemberus-gaap:FairValueInputsLevel2Member2025-09-300000003570lng:LNGTradingDerivativeMemberus-gaap:FairValueInputsLevel3Member2025-09-300000003570lng:LNGTradingDerivativeMember2025-09-300000003570lng:LNGTradingDerivativeMemberus-gaap:FairValueInputsLevel1Member2024-12-310000003570lng:LNGTradingDerivativeMemberus-gaap:FairValueInputsLevel2Member2024-12-310000003570lng:LNGTradingDerivativeMemberus-gaap:FairValueInputsLevel3Member2024-12-310000003570lng:LNGTradingDerivativeMember2024-12-310000003570us-gaap:ForeignExchangeContractMemberus-gaap:FairValueInputsLevel1Member2025-09-300000003570us-gaap:ForeignExchangeContractMemberus-gaap:FairValueInputsLevel2Member2025-09-300000003570us-gaap:ForeignExchangeContractMemberus-gaap:FairValueInputsLevel3Member2025-09-300000003570us-gaap:ForeignExchangeContractMember2025-09-300000003570us-gaap:ForeignExchangeContractMemberus-gaap:FairValueInputsLevel1Member2024-12-310000003570us-gaap:ForeignExchangeContractMemberus-gaap:FairValueInputsLevel2Member2024-12-310000003570us-gaap:ForeignExchangeContractMemberus-gaap:FairValueInputsLevel3Member2024-12-310000003570us-gaap:ForeignExchangeContractMember2024-12-310000003570us-gaap:PriceRiskDerivativeMemberus-gaap:FairValueInputsLevel3Memberus-gaap:MarketApproachValuationTechniqueMembersrt:MinimumMember2025-01-012025-09-300000003570us-gaap:PriceRiskDerivativeMemberus-gaap:FairValueInputsLevel3Memberus-gaap:MarketApproachValuationTechniqueMembersrt:MaximumMember2025-01-012025-09-300000003570us-gaap:PriceRiskDerivativeMemberus-gaap:FairValueInputsLevel3Memberus-gaap:MarketApproachValuationTechniqueMembersrt:WeightedAverageMember2025-01-012025-09-300000003570us-gaap:PriceRiskDerivativeMemberus-gaap:FairValueInputsLevel3Memberus-gaap:ValuationTechniqueOptionPricingModelMembersrt:MinimumMember2025-01-012025-09-300000003570us-gaap:PriceRiskDerivativeMemberus-gaap:FairValueInputsLevel3Memberus-gaap:ValuationTechniqueOptionPricingModelMembersrt:MaximumMember2025-01-012025-09-300000003570us-gaap:PriceRiskDerivativeMemberus-gaap:FairValueInputsLevel3Memberus-gaap:ValuationTechniqueOptionPricingModelMembersrt:WeightedAverageMember2025-01-012025-09-300000003570us-gaap:PriceRiskDerivativeMember2025-06-300000003570us-gaap:PriceRiskDerivativeMember2024-06-300000003570us-gaap:PriceRiskDerivativeMember2023-12-310000003570us-gaap:PriceRiskDerivativeMember2025-07-012025-09-300000003570us-gaap:PriceRiskDerivativeMember2024-07-012024-09-300000003570us-gaap:PriceRiskDerivativeMember2025-01-012025-09-300000003570us-gaap:PriceRiskDerivativeMember2024-01-012024-09-300000003570us-gaap:PriceRiskDerivativeMember2024-09-300000003570us-gaap:PriceRiskDerivativeMembersrt:MaximumMember2025-01-012025-09-300000003570lng:LNGTradingDerivativeMembersrt:MaximumMember2025-01-012025-09-300000003570us-gaap:CommodityContractMember2025-01-012025-09-300000003570lng:LNGTradingDerivativeMemberus-gaap:SalesMember2025-07-012025-09-300000003570lng:LNGTradingDerivativeMemberus-gaap:SalesMember2024-07-012024-09-300000003570lng:LNGTradingDerivativeMemberus-gaap:SalesMember2025-01-012025-09-300000003570lng:LNGTradingDerivativeMemberus-gaap:SalesMember2024-01-012024-09-300000003570lng:LNGTradingDerivativeMemberus-gaap:CostOfSalesMember2025-07-012025-09-300000003570lng:LNGTradingDerivativeMemberus-gaap:CostOfSalesMember2024-07-012024-09-300000003570lng:LNGTradingDerivativeMemberus-gaap:CostOfSalesMember2025-01-012025-09-300000003570lng:LNGTradingDerivativeMemberus-gaap:CostOfSalesMember2024-01-012024-09-300000003570us-gaap:PriceRiskDerivativeMemberus-gaap:SalesMember2025-07-012025-09-300000003570us-gaap:PriceRiskDerivativeMemberus-gaap:SalesMember2024-07-012024-09-300000003570us-gaap:PriceRiskDerivativeMemberus-gaap:SalesMember2025-01-012025-09-300000003570us-gaap:PriceRiskDerivativeMemberus-gaap:SalesMember2024-01-012024-09-300000003570us-gaap:PriceRiskDerivativeMemberus-gaap:CostOfSalesMember2025-07-012025-09-300000003570us-gaap:PriceRiskDerivativeMemberus-gaap:CostOfSalesMember2024-07-012024-09-300000003570us-gaap:PriceRiskDerivativeMemberus-gaap:CostOfSalesMember2025-01-012025-09-300000003570us-gaap:PriceRiskDerivativeMemberus-gaap:CostOfSalesMember2024-01-012024-09-300000003570us-gaap:ForeignExchangeContractMembersrt:MaximumMember2025-01-012025-09-300000003570us-gaap:ForeignExchangeContractMember2025-01-012025-09-300000003570us-gaap:ForeignExchangeContractMember2024-07-012024-09-300000003570us-gaap:ForeignExchangeContractMember2025-07-012025-09-300000003570us-gaap:ForeignExchangeContractMember2024-01-012024-09-300000003570lng:PriceRiskDerivativeAssetMember2025-09-300000003570lng:LNGTradingDerivativeAssetMember2025-09-300000003570lng:ForeignExchangeContractAssetMember2025-09-300000003570lng:PriceRiskDerivativeLiabilityMember2025-09-300000003570lng:LNGTradingDerivativesLiabilityMember2025-09-300000003570lng:ForeignExchangeContractLiabilityMember2025-09-300000003570lng:PriceRiskDerivativeAssetMember2024-12-310000003570lng:LNGTradingDerivativeAssetMember2024-12-310000003570lng:ForeignExchangeContractAssetMember2024-12-310000003570lng:PriceRiskDerivativeLiabilityMember2024-12-310000003570lng:LNGTradingDerivativesLiabilityMember2024-12-310000003570lng:ForeignExchangeContractLiabilityMember2024-12-310000003570lng:BlackstoneInc.AndBrookfieldAssetManagementInc.AndThePublicMember2025-01-012025-09-300000003570us-gaap:VariableInterestEntityPrimaryBeneficiaryMember2025-01-012025-09-300000003570us-gaap:VariableInterestEntityPrimaryBeneficiaryMember2024-12-310000003570lng:A2025SabinePassLiquefactionSeniorNotesMember2025-09-300000003570lng:A2025SabinePassLiquefactionSeniorNotesMember2024-12-310000003570lng:A2026SabinePassLiquefactionSeniorNotesMember2025-09-300000003570lng:A2026SabinePassLiquefactionSeniorNotesMember2024-12-310000003570lng:A2027SabinePassLiquefactionSeniorNotesMember2025-09-300000003570lng:A2027SabinePassLiquefactionSeniorNotesMember2024-12-310000003570lng:A2028SabinePassLiquefactionSeniorNotesMember2025-09-300000003570lng:A2028SabinePassLiquefactionSeniorNotesMember2024-12-310000003570lng:A2030SabinePassLiquefactionSeniorNotesMember2025-09-300000003570lng:A2030SabinePassLiquefactionSeniorNotesMember2024-12-310000003570lng:A2037SabinePassLiquefactionNotesMembersrt:WeightedAverageMember2025-09-300000003570lng:A2037SabinePassLiquefactionNotesMembersrt:WeightedAverageMember2024-12-310000003570lng:A2037SabinePassLiquefactionNotesMember2025-09-300000003570lng:A2037SabinePassLiquefactionNotesMember2024-12-310000003570lng:SabinePassLiquefactionSeniorNotesMember2025-09-300000003570lng:SabinePassLiquefactionSeniorNotesMember2024-12-310000003570lng:SPLRevolvingCreditFacilityMember2025-09-300000003570lng:SPLRevolvingCreditFacilityMember2024-12-310000003570lng:SabinePassLiquefactionMember2025-09-300000003570lng:SabinePassLiquefactionMember2024-12-310000003570lng:A2029CheniereEnergyPartnersSeniorNotesMember2025-09-300000003570lng:A2029CheniereEnergyPartnersSeniorNotesMember2024-12-310000003570lng:A2031CheniereEnergyPartnersSeniorNotesMember2025-09-300000003570lng:A2031CheniereEnergyPartnersSeniorNotesMember2024-12-310000003570lng:A2032CheniereEnergyPartnersSeniorNotesMember2025-09-300000003570lng:A2032CheniereEnergyPartnersSeniorNotesMember2024-12-310000003570lng:A2033CheniereEnergyPartnersSeniorNotesMember2025-09-300000003570lng:A2033CheniereEnergyPartnersSeniorNotesMember2024-12-310000003570lng:A2034CheniereEnergyPartnersSeniorNotesMember2025-09-300000003570lng:A2034CheniereEnergyPartnersSeniorNotesMember2024-12-310000003570lng:A2035CheniereEnergyPartnersSeniorNotesMember2025-09-300000003570lng:A2035CheniereEnergyPartnersSeniorNotesMember2024-12-310000003570lng:CheniereEnergyPartnersSeniorNotesMember2025-09-300000003570lng:CheniereEnergyPartnersSeniorNotesMember2024-12-310000003570lng:CQPRevolvingCreditFacilityMember2025-09-300000003570lng:CQPRevolvingCreditFacilityMember2024-12-310000003570lng:CheniereEnergyPartnersLPMember2025-09-300000003570lng:CheniereEnergyPartnersLPMember2024-12-310000003570lng:A2027CorpusChristiHoldingsSeniorNotesMember2025-09-300000003570lng:A2027CorpusChristiHoldingsSeniorNotesMember2024-12-310000003570lng:A2029CorpusChristiHoldingsSeniorNotesMember2025-09-300000003570lng:A2029CorpusChristiHoldingsSeniorNotesMember2024-12-310000003570lng:A2039CorpusChristiHoldingsSeniorNotesMembersrt:WeightedAverageMember2025-09-300000003570lng:A2039CorpusChristiHoldingsSeniorNotesMember2025-09-300000003570lng:A2039CorpusChristiHoldingsSeniorNotesMember2024-12-310000003570lng:CorpusChristiHoldingsSeniorNotesMember2025-09-300000003570lng:CorpusChristiHoldingsSeniorNotesMember2024-12-310000003570lng:A2015CCHTermLoanFacilityMember2025-09-300000003570lng:A2015CCHTermLoanFacilityMember2024-12-310000003570lng:CorpusChristiHoldingsWorkingCapitalFacilityMember2025-09-300000003570lng:CorpusChristiHoldingsWorkingCapitalFacilityMember2024-12-310000003570lng:CheniereCorpusChristiHoldingsLLCMember2025-09-300000003570lng:CheniereCorpusChristiHoldingsLLCMember2024-12-310000003570lng:A2028CheniereSeniorSecuredNotesMember2025-09-300000003570lng:A2028CheniereSeniorSecuredNotesMember2024-12-310000003570lng:A2034CheniereSeniorNotesMember2025-09-300000003570lng:A2034CheniereSeniorNotesMember2024-12-310000003570lng:CheniereSeniorNotesMember2025-09-300000003570lng:CheniereSeniorNotesMember2024-12-310000003570lng:CheniereRevolvingCreditFacilityMember2025-09-300000003570lng:CheniereRevolvingCreditFacilityMember2024-12-310000003570srt:ParentCompanyMember2025-09-300000003570srt:ParentCompanyMember2024-12-310000003570lng:SPLRevolvingCreditFacilityMemberus-gaap:SecuredOvernightFinancingRateSofrOvernightIndexSwapRateMember2025-01-012025-09-300000003570us-gaap:SecuredOvernightFinancingRateSofrOvernightIndexSwapRateMemberlng:SPLRevolvingCreditFacilityMembersrt:MinimumMember2025-01-012025-09-300000003570us-gaap:SecuredOvernightFinancingRateSofrOvernightIndexSwapRateMemberlng:SPLRevolvingCreditFacilityMembersrt:MaximumMember2025-01-012025-09-300000003570us-gaap:BaseRateMemberlng:SPLRevolvingCreditFacilityMembersrt:MinimumMember2025-01-012025-09-300000003570us-gaap:BaseRateMemberlng:SPLRevolvingCreditFacilityMembersrt:MaximumMember2025-01-012025-09-300000003570lng:CQPRevolvingCreditFacilityMemberus-gaap:SecuredOvernightFinancingRateSofrOvernightIndexSwapRateMember2025-01-012025-09-300000003570us-gaap:SecuredOvernightFinancingRateSofrOvernightIndexSwapRateMemberlng:CQPRevolvingCreditFacilityMembersrt:MinimumMember2025-01-012025-09-300000003570us-gaap:SecuredOvernightFinancingRateSofrOvernightIndexSwapRateMemberlng:CQPRevolvingCreditFacilityMembersrt:MaximumMember2025-01-012025-09-300000003570us-gaap:BaseRateMemberlng:CQPRevolvingCreditFacilityMembersrt:MinimumMember2025-01-012025-09-300000003570us-gaap:BaseRateMemberlng:CQPRevolvingCreditFacilityMembersrt:MaximumMember2025-01-012025-09-300000003570lng:A2015CCHTermLoanFacilityMemberus-gaap:SecuredOvernightFinancingRateSofrOvernightIndexSwapRateMember2025-01-012025-09-300000003570lng:A2015CCHTermLoanFacilityMemberus-gaap:BaseRateMember2025-01-012025-09-300000003570lng:CorpusChristiHoldingsWorkingCapitalFacilityMemberus-gaap:SecuredOvernightFinancingRateSofrOvernightIndexSwapRateMember2025-01-012025-09-300000003570us-gaap:SecuredOvernightFinancingRateSofrOvernightIndexSwapRateMemberlng:CorpusChristiHoldingsWorkingCapitalFacilityMembersrt:MinimumMember2025-01-012025-09-300000003570us-gaap:SecuredOvernightFinancingRateSofrOvernightIndexSwapRateMemberlng:CorpusChristiHoldingsWorkingCapitalFacilityMembersrt:MaximumMember2025-01-012025-09-300000003570us-gaap:BaseRateMemberlng:CorpusChristiHoldingsWorkingCapitalFacilityMembersrt:MinimumMember2025-01-012025-09-300000003570us-gaap:BaseRateMemberlng:CorpusChristiHoldingsWorkingCapitalFacilityMembersrt:MaximumMember2025-01-012025-09-300000003570us-gaap:SecuredOvernightFinancingRateSofrOvernightIndexSwapRateMemberlng:CheniereRevolvingCreditFacilityMembersrt:MinimumMember2025-01-012025-09-300000003570us-gaap:SecuredOvernightFinancingRateSofrOvernightIndexSwapRateMemberlng:CheniereRevolvingCreditFacilityMembersrt:MaximumMember2025-01-012025-09-300000003570us-gaap:BaseRateMemberlng:CheniereRevolvingCreditFacilityMembersrt:MinimumMember2025-01-012025-09-300000003570us-gaap:BaseRateMemberlng:CheniereRevolvingCreditFacilityMembersrt:MaximumMember2025-01-012025-09-300000003570lng:SPLRevolvingCreditFacilityMembersrt:MinimumMember2025-01-012025-09-300000003570lng:SPLRevolvingCreditFacilityMembersrt:MaximumMember2025-01-012025-09-300000003570lng:CQPRevolvingCreditFacilityMembersrt:MinimumMember2025-01-012025-09-300000003570lng:CQPRevolvingCreditFacilityMembersrt:MaximumMember2025-01-012025-09-300000003570lng:A2015CCHTermLoanFacilityMember2025-01-012025-09-300000003570lng:CorpusChristiHoldingsWorkingCapitalFacilityMembersrt:MinimumMember2025-01-012025-09-300000003570lng:CorpusChristiHoldingsWorkingCapitalFacilityMembersrt:MaximumMember2025-01-012025-09-300000003570lng:CheniereRevolvingCreditFacilityMembersrt:MinimumMember2025-01-012025-09-300000003570lng:CheniereRevolvingCreditFacilityMembersrt:MaximumMember2025-01-012025-09-300000003570us-gaap:LetterOfCreditMemberlng:SPLRevolvingCreditFacilityMembersrt:MinimumMember2025-09-300000003570us-gaap:LetterOfCreditMemberlng:SPLRevolvingCreditFacilityMembersrt:MaximumMember2025-09-300000003570us-gaap:LetterOfCreditMemberlng:CQPRevolvingCreditFacilityMembersrt:MinimumMember2025-09-300000003570us-gaap:LetterOfCreditMemberlng:CQPRevolvingCreditFacilityMembersrt:MaximumMember2025-09-300000003570us-gaap:LetterOfCreditMemberlng:CorpusChristiHoldingsWorkingCapitalFacilityMembersrt:MinimumMember2025-09-300000003570us-gaap:LetterOfCreditMemberlng:CorpusChristiHoldingsWorkingCapitalFacilityMembersrt:MaximumMember2025-09-300000003570us-gaap:LetterOfCreditMemberlng:CheniereRevolvingCreditFacilityMembersrt:MinimumMember2025-09-300000003570us-gaap:LetterOfCreditMemberlng:CheniereRevolvingCreditFacilityMembersrt:MaximumMember2025-09-300000003570lng:SPLRevolvingCreditFacilityMember2025-01-012025-09-300000003570lng:CQPRevolvingCreditFacilityMember2025-01-012025-09-300000003570lng:CorpusChristiHoldingsWorkingCapitalFacilityMember2025-01-012025-09-300000003570lng:CheniereRevolvingCreditFacilityMember2025-01-012025-09-300000003570lng:A2015CCHTermLoanFacilityMembersrt:MaximumMember2025-01-012025-09-300000003570lng:SabinePassLiquefactionAndCheniereCorpusChristiHoldingsMember2025-01-012025-09-300000003570us-gaap:CarryingReportedAmountFairValueDisclosureMemberlng:FairValueInputsLevel2AndLevel3Memberus-gaap:SeniorNotesMember2025-09-300000003570us-gaap:EstimateOfFairValueFairValueDisclosureMemberlng:FairValueInputsLevel2AndLevel3Memberus-gaap:SeniorNotesMember2025-09-300000003570us-gaap:CarryingReportedAmountFairValueDisclosureMemberlng:FairValueInputsLevel2AndLevel3Memberus-gaap:SeniorNotesMember2024-12-310000003570us-gaap:EstimateOfFairValueFairValueDisclosureMemberlng:FairValueInputsLevel2AndLevel3Memberus-gaap:SeniorNotesMember2024-12-310000003570us-gaap:EstimateOfFairValueFairValueDisclosureMemberus-gaap:FairValueInputsLevel3Memberus-gaap:SeniorNotesMember2025-09-300000003570us-gaap:EstimateOfFairValueFairValueDisclosureMemberus-gaap:FairValueInputsLevel3Memberus-gaap:SeniorNotesMember2024-12-310000003570srt:MaximumMember2025-09-300000003570lng:LiquefiedNaturalGasMember2025-10-012025-09-300000003570lng:LiquefiedNaturalGasMember2025-01-012024-12-310000003570lng:RegasificationServiceMember2025-10-012025-09-300000003570lng:RegasificationServiceMember2025-01-012024-12-3100000035702025-10-012025-09-3000000035702025-01-012024-12-310000003570us-gaap:ProductAndServiceOtherMemberus-gaap:EquityMethodInvesteeMemberlng:OperationAgreementAndConstructionManagementAgreementMember2025-07-012025-09-300000003570us-gaap:ProductAndServiceOtherMemberus-gaap:EquityMethodInvesteeMemberlng:OperationAgreementAndConstructionManagementAgreementMember2024-07-012024-09-300000003570us-gaap:ProductAndServiceOtherMemberus-gaap:EquityMethodInvesteeMemberlng:OperationAgreementAndConstructionManagementAgreementMember2025-01-012025-09-300000003570us-gaap:ProductAndServiceOtherMemberus-gaap:EquityMethodInvesteeMemberlng:OperationAgreementAndConstructionManagementAgreementMember2024-01-012024-09-300000003570lng:NaturalGasTransportationAndStorageAgreementsMemberus-gaap:EquityMethodInvesteeMember2025-07-012025-09-300000003570lng:NaturalGasTransportationAndStorageAgreementsMemberus-gaap:EquityMethodInvesteeMember2024-07-012024-09-300000003570lng:NaturalGasTransportationAndStorageAgreementsMemberus-gaap:EquityMethodInvesteeMember2025-01-012025-09-300000003570lng:NaturalGasTransportationAndStorageAgreementsMemberus-gaap:EquityMethodInvesteeMember2024-01-012024-09-300000003570lng:NaturalGasTransportationAndStorageAgreementsMemberus-gaap:RelatedPartyMember2025-07-012025-09-300000003570lng:NaturalGasTransportationAndStorageAgreementsMemberus-gaap:RelatedPartyMember2024-07-012024-09-300000003570lng:NaturalGasTransportationAndStorageAgreementsMemberus-gaap:RelatedPartyMember2025-01-012025-09-300000003570lng:NaturalGasTransportationAndStorageAgreementsMemberus-gaap:RelatedPartyMember2024-01-012024-09-300000003570us-gaap:ProductAndServiceOtherMemberlng:EquityMethodInvesteeSoldMemberlng:OperationAgreementAndConstructionManagementAgreementMember2025-01-012025-09-300000003570lng:NaturalGasTransportationAndStorageAgreementsMemberlng:EquityMethodInvesteeSoldMember2025-01-012025-09-300000003570us-gaap:ProductAndServiceOtherMemberlng:EquityMethodInvesteeSoldMemberlng:OperationAgreementAndConstructionManagementAgreementMember2024-07-012024-09-300000003570us-gaap:ProductAndServiceOtherMemberlng:EquityMethodInvesteeSoldMemberlng:OperationAgreementAndConstructionManagementAgreementMember2024-01-012024-09-300000003570lng:NaturalGasTransportationAndStorageAgreementsMemberlng:EquityMethodInvesteeSoldMember2024-07-012024-09-300000003570lng:NaturalGasTransportationAndStorageAgreementsMemberlng:EquityMethodInvesteeSoldMember2024-01-012024-09-300000003570us-gaap:RelatedPartyMember2025-09-300000003570us-gaap:RelatedPartyMember2024-12-3100000035702025-01-192025-09-300000003570us-gaap:SubsequentEventMember2025-10-282025-10-280000003570lng:CustomerAMemberus-gaap:CustomerConcentrationRiskMemberlng:AccountsReceivableAndContractAssetsMember2025-01-012025-09-300000003570lng:CustomerAMemberus-gaap:CustomerConcentrationRiskMemberlng:AccountsReceivableAndContractAssetsMember2024-01-012024-12-310000003570lng:CustomerBMemberus-gaap:CustomerConcentrationRiskMemberus-gaap:SalesRevenueNetMember2024-07-012024-09-30
UNITED STATES
SECURITIES AND EXCHANGE COMMISSION
Washington, D.C. 20549
FORM 10-Q
☒ QUARTERLY REPORT PURSUANT TO SECTION 13 OR 15(d) OF THE SECURITIES EXCHANGE ACT OF 1934
For the quarterly period ended September 30, 2025
or
☐ TRANSITION REPORT PURSUANT TO SECTION 13 OR 15(d) OF THE SECURITIES EXCHANGE ACT OF 1934
For the transition period from to
Commission file number 001-16383
CHENIERE ENERGY, INC.
(Exact name of registrant as specified in its charter)
| | | | | |
| Delaware | 95-4352386 |
| (State or other jurisdiction of incorporation or organization) | (I.R.S. Employer Identification No.) |
845 Texas Avenue, Suite 1250
Houston, Texas 77002
(Address of principal executive offices) (Zip Code)
(713) 375-5000
(Registrant’s telephone number, including area code)
Securities registered pursuant to Section 12(b) of the Act:
| | | | | | | | |
| Title of each class | Trading Symbol | Name of each exchange on which registered |
| Common Stock, $ 0.003 par value | LNG | New York Stock Exchange |
Indicate by check mark whether the registrant (1) has filed all reports required to be filed by Section 13 or 15(d) of the Securities Exchange Act of 1934 during the preceding 12 months (or for such shorter period that the registrant was required to file such reports), and (2) has been subject to such filing requirements for the past 90 days. Yes ☒ No ☐
Indicate by check mark whether the registrant has submitted electronically every Interactive Data File required to be submitted pursuant to Rule 405 of Regulation S-T (§232.405 of this chapter) during the preceding 12 months (or for such shorter period that the registrant was required to submit such files). Yes ☒ No ☐
Indicate by check mark whether the registrant is a large accelerated filer, an accelerated filer, a non-accelerated filer, a smaller reporting company, or an emerging growth company. See the definitions of “large accelerated filer,” “accelerated filer,” “smaller reporting company” and “emerging growth company” in Rule 12b-2 of the Exchange Act.
| | | | | | | | | | | | | | | | | |
| Large accelerated filer | ☒ | | Accelerated filer | ☐ |
| Non-accelerated filer | ☐ | | Smaller reporting company | ☐ |
| | | | Emerging growth company | ☐ |
If an emerging growth company, indicate by check mark if the registrant has elected not to use the extended transition period for complying with any new or revised financial accounting standards provided pursuant to Section 13(a) of the Exchange Act. ☐
Indicate by check mark whether the registrant is a shell company (as defined in Rule 12b-2 of the Exchange Act). Yes ☐ No ☒
As of October 24, 2025, the issuer had 215,234,776 shares of Common Stock outstanding.
CHENIERE ENERGY, INC.
TABLE OF CONTENTS
DEFINITIONS
As used in this quarterly report, the terms listed below have the following meanings:
Common Industry and Other Terms
| | | | | | | | |
| ASU | | Accounting Standards Update |
| | |
| | |
| Bcf/d | | billion cubic feet per day |
| | |
| Bcfe | | billion cubic feet equivalent |
| CAMT | | corporate alternative minimum tax |
| | |
| DOE | | U.S. Department of Energy |
| EPC | | engineering, procurement and construction |
| | |
| FASB | | Financial Accounting Standards Board |
| FERC | | Federal Energy Regulatory Commission |
| FID | | final investment decision |
| | |
| FTA countries | | countries with which the United States has a free trade agreement providing for national treatment for trade in natural gas |
| GAAP | | generally accepted accounting principles in the United States |
| Henry Hub | | the final settlement price (in U.S. dollars per MMBtu) for the New York Mercantile Exchange’s Henry Hub natural gas futures contract for the month in which a relevant cargo’s delivery window is scheduled to begin |
| IPM agreements | | integrated production marketing agreements in which the gas producer sells to us gas on a global LNG or natural gas index price, less a fixed liquefaction fee, shipping and other costs |
| LNG | | liquefied natural gas, a product of natural gas that, through a refrigeration process, has been cooled to a liquid state, which occupies a volume that is approximately 1/600th of its gaseous state |
| MMBtu | | million British thermal units; one British thermal unit measures the amount of energy required to raise the temperature of one pound of water by one degree Fahrenheit |
| mtpa | | million tonnes per annum |
| NGA | | Natural Gas Act of 1938, as amended |
| NCI | | non-controlling interests |
| non-FTA countries | | countries with which the United States does not have a free trade agreement providing for national treatment for trade in natural gas and with which trade is permitted |
| | |
| SEC | | U.S. Securities and Exchange Commission |
| SOFR | | Secured Overnight Financing Rate |
| SPA | | LNG sale and purchase agreement |
| TBtu | | trillion British thermal units; one British thermal unit measures the amount of energy required to raise the temperature of one pound of water by one degree Fahrenheit |
| | |
| Train | | an industrial facility comprised of a series of refrigerant compressor loops used to cool natural gas into LNG |
| TUA | | terminal use agreement |
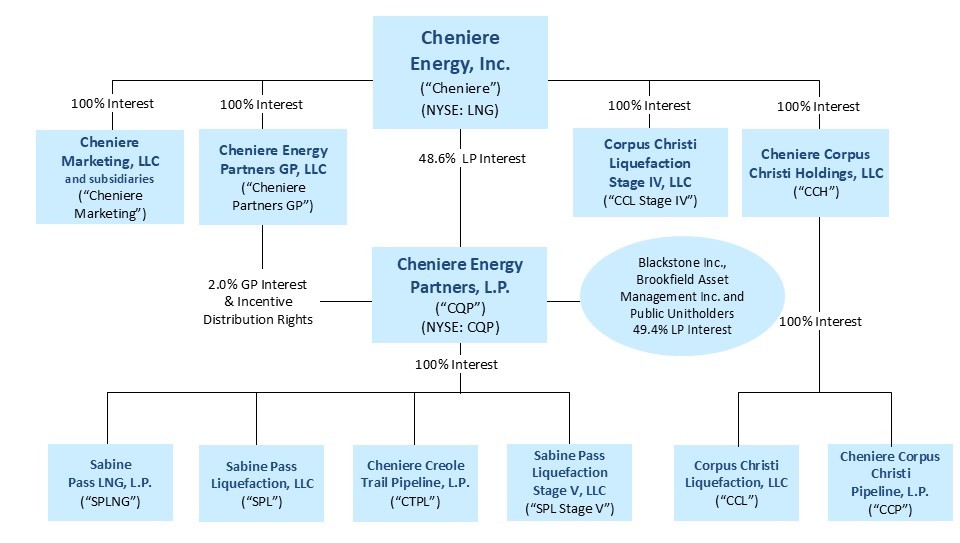
Abbreviated Legal Entity Structure
The following diagram depicts our abbreviated legal entity structure as of September 30, 2025, including our ownership of certain subsidiaries, and the references to these entities used in this quarterly report:
Unless the context requires otherwise, references to the “Company,” “we,” “us” and “our” refer to Cheniere Energy, Inc. and its consolidated subsidiaries, including our publicly traded subsidiary, CQP.
PART I. FINANCIAL INFORMATION
ITEM 1. CONSOLIDATED FINANCIAL STATEMENTS
CHENIERE ENERGY, INC. AND SUBSIDIARIES
CONSOLIDATED STATEMENTS OF OPERATIONS
(in millions, except per share data)
(unaudited) | | | | | | | | | | | | | | | | | | | | | | | | | |
| Three Months Ended September 30, | | Nine Months Ended September 30, | | |
| 2025 | | 2024 | | 2025 | | 2024 | | |
| Revenues | | | | | | | | | |
| LNG revenues | $ | 4,302 | | | $ | 3,554 | | | $ | 14,122 | | | $ | 10,633 | | | |
| Regasification revenues | 34 | | | 34 | | | 102 | | | 102 | | | |
| Other revenues | 105 | | | 175 | | | 302 | | | 532 | | | |
| | | | | | | | | |
| Total revenues | 4,441 | | | 3,763 | | | 14,526 | | | 11,267 | | | |
| | | | | | | | | |
| Operating costs and expenses | | | | | | | | | |
| Cost of sales (excluding operating and maintenance expense and depreciation, amortization and accretion expense shown separately below) | 1,750 | | | 1,255 | | | 6,438 | | | 4,275 | | | |
| | | | | | | | | |
| Operating and maintenance expense | 447 | | | 450 | | | 1,479 | | | 1,364 | | | |
| | | | | | | | | |
| Selling, general and administrative expense | 81 | | | 99 | | | 296 | | | 299 | | | |
| Depreciation, amortization and accretion expense | 338 | | | 306 | | | 979 | | | 912 | | | |
| | | | | | | | | |
| | | | | | | | | |
| | | | | | | | | |
| Other operating costs and expenses | 8 | | | 6 | | | 26 | | | 28 | | | |
| | | | | | | | | |
| Total operating costs and expenses | 2,624 | | | 2,116 | | | 9,218 | | | 6,878 | | | |
| | | | | | | | | |
| Income from operations | 1,817 | | | 1,647 | | | 5,308 | | | 4,389 | | | |
| | | | | | | | | |
| Other income (expense) | | | | | | | | | |
| Interest expense, net of capitalized interest | (236) | | | (247) | | | (702) | | | (770) | | | |
| Loss on modification or extinguishment of debt | (7) | | | — | | | (7) | | | (9) | | | |
| | | | | | | | | |
| Interest and dividend income | 23 | | | 41 | | | 91 | | | 149 | | | |
| Other income (expense), net | 2 | | | (3) | | | 21 | | | (1) | | | |
| Total other expense | (218) | | | (209) | | | (597) | | | (631) | | | |
| | | | | | | | | |
Income before income taxes and NCI | 1,599 | | | 1,438 | | | 4,711 | | | 3,758 | | | |
| Less: income tax provision | 303 | | | 231 | | | 850 | | | 550 | | | |
| Net income | 1,296 | | | 1,207 | | | 3,861 | | | 3,208 | | | |
| Less: net income attributable to NCI | 247 | | | 314 | | | 833 | | | 933 | | | |
| Net income attributable to Cheniere | $ | 1,049 | | | $ | 893 | | | $ | 3,028 | | | $ | 2,275 | | | |
| | | | | | | | | |
Net income per share attributable to common stockholders—basic (1) | $ | 4.76 | | | $ | 3.95 | | | $ | 13.63 | | | $ | 9.91 | | | |
Net income per share attributable to common stockholders—diluted (1) | $ | 4.75 | | | $ | 3.93 | | | $ | 13.59 | | | $ | 9.88 | | | |
| | | | | | | | | |
| Weighted average number of common shares outstanding—basic | 219.3 | | | 226.3 | | | 221.5 | | | 229.6 | | | |
| Weighted average number of common shares outstanding—diluted | 219.9 | | | 227.0 | | | 222.1 | | | 230.3 | | | |
| ___________________ | | | | | | | | | |
| | | | | | | | | |
(1)In computing basic and diluted net income per share attributable to common stockholders, net income attributable to Cheniere is adjusted for the remeasurement of the redeemable NCI, net of tax, to its redemption value, as required under the two-class method. See Note 13—Net Income per Share Attributable to Common Stockholders for the full computation. The accompanying notes are an integral part of these consolidated financial statements.
3
CHENIERE ENERGY, INC. AND SUBSIDIARIES
CONSOLIDATED BALANCE SHEETS (1)
(in millions, except share data)
(unaudited)
| | | | | | | | | | | |
| September 30, | | December 31, |
| | | |
| 2025 | | 2024 |
| | | |
| ASSETS |
| Current assets | | | |
| Cash and cash equivalents | $ | 1,075 | | | $ | 2,638 | |
| Restricted cash and cash equivalents | 323 | | | 552 | |
| Trade and other receivables, net of current expected credit losses | 1,324 | | | 727 | |
| | | |
| Inventory | 458 | | | 501 | |
| Current derivative assets | 89 | | | 155 | |
| Margin deposits | 103 | | | 128 | |
| | | |
| Other current assets, net | 129 | | | 100 | |
| Total current assets | 3,501 | | | 4,801 | |
| | | |
| | | |
| Property, plant and equipment, net of accumulated depreciation | 35,345 | | | 33,552 | |
| Operating lease assets | 2,627 | | | 2,684 | |
| | | |
| Derivative assets | 2,565 | | | 1,903 | |
| | | |
| Deferred tax assets | 17 | | | 19 | |
| Other non-current assets, net | 1,047 | | | 899 | |
| Total assets | $ | 45,102 | | | $ | 43,858 | |
| | | |
LIABILITIES, REDEEMABLE NCI AND STOCKHOLDERS’ EQUITY |
| Current liabilities | | | |
| Accounts payable | $ | 279 | | | $ | 171 | |
| Accrued liabilities | 1,492 | | | 2,179 | |
| | | |
| Current debt, net of unamortized discount and debt issuance costs | 605 | | | 351 | |
| Deferred revenue | 176 | | | 163 | |
| Current operating lease liabilities | 539 | | | 592 | |
| Current derivative liabilities | 556 | | | 902 | |
| Other current liabilities | 92 | | | 83 | |
| Total current liabilities | 3,739 | | | 4,441 | |
| | | |
| Long-term debt, net of unamortized discount and debt issuance costs | 21,957 | | | 22,554 | |
| Operating lease liabilities | 2,091 | | | 2,090 | |
| | | |
| | | |
| Derivative liabilities | 1,464 | | | 1,865 | |
| Deferred tax liabilities | 3,075 | | | 1,856 | |
| Other non-current liabilities | 1,315 | | | 992 | |
| Total liabilities | 33,641 | | | 33,798 | |
| | | |
| | | |
| | | |
| Redeemable NCI | 118 | | | 7 | |
| | | |
| Stockholders’ equity | | | |
Preferred stock: $0.0001 par value, 5.0 million shares authorized, none issued | — | | | — | |
Common stock: $0.003 par value, 480.0 million shares authorized; 279.3 million shares and 278.7 million shares issued at September 30, 2025 and December 31, 2024, respectively | 1 | | | 1 | |
| | | |
| | | |
| | | |
Treasury stock: 62.1 million shares and 54.7 million shares at September 30, 2025 and December 31, 2024, respectively, at cost | (7,826) | | | (6,136) | |
| Additional paid-in-capital | 4,507 | | | 4,452 | |
Retained earnings | 10,067 | | | 7,382 | |
Total Cheniere stockholders’ equity | 6,749 | | | 5,699 | |
| NCI | 4,594 | | | 4,354 | |
| Total stockholders’ equity | 11,343 | | | 10,053 | |
Total liabilities, redeemable NCI and stockholders’ equity | $ | 45,102 | | | $ | 43,858 | |
(1)Amounts presented include balances held by our consolidated variable interest entities (“VIEs”), substantially all of which are related to CQP, as further discussed in Note 6—Non-Controlling Interests and Variable Interest Entities. As of September 30, 2025, total assets and liabilities of our VIEs were $16.7 billion and $17.1 billion, respectively, including $121 million of cash and cash equivalents and $61 million of restricted cash and cash equivalents. The accompanying notes are an integral part of these consolidated financial statements.
4
CHENIERE ENERGY, INC. AND SUBSIDIARIES
CONSOLIDATED STATEMENTS OF STOCKHOLDERS’ EQUITY AND REDEEMABLE NON-CONTROLLING INTEREST
(in millions)
(unaudited) | | | | | | | | | | | | | | | | | | | | | | | | | | | | | | | | | | | | | | | | | | | | | | | | | | | | | |
| Three and Nine Months Ended September 30, 2025 | | | | | | | | | | | | | | |
| Total Stockholders’ Equity | | |
| | Common Stock | | Treasury Stock | | Additional Paid-in Capital | | Retained Earnings | | NCI | | Total Equity | | Redeemable NCI (1) |
| | Shares | | Par Value Amount | | Shares | | Amount | | | | | |
| | | | | | | | | | | | | | | | | |
| | | | | | | | | | | | | | | | | |
| | | | | | | | | | | | | | | | | |
| | | | | | | | | | | | | | | | | |
| | | | | | | | | | | | | | | | | |
| | | | | | | | | | | | | | | | | |
| | | | | | | | | | | | | | | | | |
| | | | | | | | | | | | | | | | | |
| | | | | | | | | | | | | | | | | |
| | | | | | | | | | | | | | | | | |
| | | | | | | | | | | | | | | | | |
| | | | | | | | | | | | | | | | | |
| | | | | | | | | | | | | | | | | |
| | | | | | | | | | | | | | | | | |
| | | | | | | | | | | | | | | | | |
| | | | | | | | | | | | | | | | | |
| | | | | | | | | | | | | | | | | |
| | | | | | | | | | | | | | | | | |
| | | | | | | | | | | | | | | | | |
| | | | | | | | | | | | | | | | | |
| | | | | | | | | | | | | | | | | |
| Balance at December 31, 2024 | 224.0 | | | $ | 1 | | | 54.7 | | | $ | (6,136) | | | $ | 4,452 | | | $ | 7,382 | | | $ | 4,354 | | | $ | 10,053 | | | $ | 7 | |
| Net income (loss) | — | | | — | | | — | | | — | | | — | | | 353 | | | 317 | | | 670 | | | (2) | |
Dividends declared ($0.500 per common share) and dividend equivalents accrued | — | | | — | | | — | | | — | | | — | | | (113) | | | — | | | (113) | | | — | |
| Shares repurchased, at cost and inclusive of excise taxes | (1.6) | | | — | | | 1.6 | | | (352) | | | — | | | — | | | — | | | (352) | | | — | |
Accretion of redeemable NCI (2) | — | | | — | | | — | | | — | | | — | | | (2) | | | — | | | (2) | | | 2 | |
Distributions to NCI | — | | | — | | | — | | | — | | | — | | | — | | | (200) | | | (200) | | | — | |
Contributions from redeemable NCI | — | | | — | | | — | | | — | | | — | | | — | | | — | | | — | | | 38 | |
| Vesting of share-based compensation awards | 0.4 | | | — | | | — | | | — | | | — | | | — | | | — | | | — | | | — | |
| Share-based compensation | — | | | — | | | — | | | — | | | 40 | | | — | | | — | | | 40 | | | — | |
| Issued shares withheld from employees related to share-based compensation, at cost | — | | | — | | | — | | | — | | | (44) | | | — | | | — | | | (44) | | | — | |
| | | | | | | | | | | | | | | | | |
| Balance at March 31, 2025 | 222.8 | | | 1 | | | 56.3 | | | (6,488) | | | 4,448 | | | 7,620 | | | 4,471 | | | 10,052 | | | 45 | |
| Net income (loss) | — | | | — | | | — | | | — | | | — | | | 1,626 | | | 273 | | | 1,899 | | | (2) | |
Dividends declared ($0.500 per common share declared each on April 29, 2025 and on June 17, 2025) and dividend equivalents accrued | — | | | — | | | — | | | — | | | — | | | (222) | | | — | | | (222) | | | — | |
| Shares repurchased, at cost and inclusive of excise taxes | (1.4) | | | — | | | 1.4 | | | (310) | | | — | | | — | | | — | | | (310) | | | — | |
Accretion of redeemable NCI (2) | — | | | — | | | — | | | — | | | — | | | (3) | | | — | | | (3) | | | 4 | |
Distributions to NCI | — | | | — | | | — | | | — | | | — | | | — | | | (200) | | | (200) | | | — | |
Contributions from redeemable NCI | — | | | — | | | — | | | — | | | — | | | — | | | — | | | — | | | 11 | |
| Vesting of share-based compensation awards | 0.1 | | | — | | | — | | | — | | | — | | | — | | | — | | | — | | | — | |
| Share-based compensation | — | | | — | | | — | | | — | | | 37 | | | — | | | — | | | 37 | | | — | |
| Issued shares withheld from employees related to share-based compensation, at cost | — | | | — | | | — | | | — | | | (2) | | | — | | | — | | | (2) | | | — | |
| Balance at June 30, 2025 | 221.5 | | | 1 | | | 57.7 | | | (6,798) | | | 4,483 | | | 9,021 | | | 4,544 | | | 11,251 | | | 58 | |
| Net income (loss) | — | | | — | | | — | | | — | | | — | | | 1,049 | | | 250 | | | 1,299 | | | (3) | |
| | | | | | | | | | | | | | | | | |
| Shares repurchased, at cost and inclusive of excise taxes | (4.4) | | | — | | | 4.4 | | | (1,028) | | | — | | | — | | | — | | | (1,028) | | | — | |
Accretion of redeemable NCI (2) | — | | | — | | | — | | | — | | | — | | | (3) | | | — | | | (3) | | | 4 | |
Distributions to NCI | — | | | — | | | — | | | — | | | — | | | — | | | (200) | | | (200) | | | — | |
Contributions from redeemable NCI | — | | | — | | | — | | | — | | | — | | | — | | | — | | | — | | | 59 | |
| Vesting of share-based compensation awards | 0.1 | | | — | | | — | | | — | | | — | | | — | | | — | | | — | | | — | |
| Share-based compensation | — | | | — | | | — | | | — | | | 28 | | | — | | | — | | | 28 | | | — | |
| Issued shares withheld from employees related to share-based compensation, at cost | — | | | — | | | — | | | — | | | (4) | | | — | | | — | | | (4) | | | — | |
| Balance at September 30, 2025 | 217.2 | | | $ | 1 | | | 62.1 | | | $ | (7,826) | | | $ | 4,507 | | | $ | 10,067 | | | $ | 4,594 | | | $ | 11,343 | | | $ | 118 | |
| | | | | | | | | | | | | | | | | |
| | | | | | | | | | | | | | | | | |
| | | | | | | | | | | | | | | | | |
| | | | | | | | | | | | | | | | | |
| | | | | | | | | | | | | | | | | |
| | | | | | | | | | | | | | | | | |
| | | | | | | | | | | | | | | | | |
| | | | | | | | | | | | | | | | | |
| | | | | | | | | | | | | | | | | |
| | | | | | | | | | | | | | | | | |
| | | | | | | | | | | | | | | | | |
(1)Redeemable NCI represents the economic interest held by a third party in one of our consolidated VIEs that is redeemable for cash under certain circumstances, including those that are outside of our control. As such, the economic interest is not a component of permanent equity on our Consolidated Balance Sheets.
(2)Amount in retained earnings presented net of tax.
The accompanying notes are an integral part of these consolidated financial statements.
5
| | | | | | | | | | | | | | | | | | | | | | | | | | | | | | | | | | | | | | | | | | | | | | | | | | | | | |
| Three and Nine Months Ended September 30, 2024 | | | | | | | | | | | | | | |
| Total Stockholders’ Equity | | |
| | Common Stock | | Treasury Stock | | Additional Paid-in Capital | | Retained Earnings | | NCI | | Total Equity | | Redeemable NCI (1) |
| | Shares | | Par Value Amount | | Shares | | Amount | | | | | |
| Balance at December 31, 2023 | 237.0 | | | $ | 1 | | | 40.9 | | | $ | (3,864) | | | $ | 4,377 | | | $ | 4,546 | | | $ | 3,960 | | | $ | 9,020 | | | $ | — | |
| Net income | — | | | — | | | — | | | — | | | — | | | 502 | | | 337 | | | 839 | | | — | |
Dividends declared ($0.435 per common share) and dividend equivalents accrued | — | | | — | | | — | | | — | | | — | | | (103) | | | — | | | (103) | | | — | |
| Shares repurchased, at cost and inclusive of excise taxes | (7.5) | | | — | | | 7.5 | | | (1,203) | | | — | | | — | | | — | | | (1,203) | | | — | |
Distributions to NCI | — | | | — | | | — | | | — | | | — | | | — | | | (253) | | | (253) | | | — | |
Contributions from redeemable NCI | — | | | — | | | — | | | — | | | — | | | — | | | — | | | — | | | 4 | |
| Vesting of share-based compensation awards | 0.6 | | | — | | | — | | | — | | | — | | | — | | | — | | | — | | | — | |
| Share-based compensation | — | | | — | | | — | | | — | | | 34 | | | — | | | — | | | 34 | | | — | |
| Issued shares withheld from employees related to share-based compensation, at cost | — | | | — | | | — | | | — | | | (40) | | | — | | | — | | | (40) | | | — | |
| | | | | | | | | | | | | | | | | |
| Balance at March 31, 2024 | 230.1 | | | 1 | | | 48.4 | | | (5,067) | | | 4,371 | | | 4,945 | | | 4,044 | | | 8,294 | | | 4 | |
| | | | | | | | | | | | | | | | | |
| Net income | — | | | — | | | — | | | — | | | — | | | 880 | | | 282 | | | 1,162 | | | — | |
Dividends declared ($0.435 per common share declared each on April 26, 2024 and on June 17, 2024) and dividend equivalents accrued | — | | | — | | | — | | | — | | | — | | | (200) | | | — | | | (200) | | | — | |
| Shares repurchased, at cost and inclusive of excise taxes | (3.1) | | | — | | | 3.1 | | | (501) | | | — | | | — | | | — | | | (501) | | | — | |
Distributions to NCI | — | | | — | | | — | | | — | | | — | | | — | | | (198) | | | (198) | | | — | |
Contributions from redeemable NCI | — | | | — | | | — | | | — | | | — | | | — | | | — | | | — | | | 2 | |
| Share-based compensation | — | | | — | | | — | | | — | | | 36 | | | — | | | — | | | 36 | | | — | |
| Issued shares withheld from employees related to share-based compensation, at cost | — | | | — | | | — | | | — | | | (1) | | | — | | | — | | | (1) | | | — | |
| Balance at June 30, 2024 | 227.0 | | | 1 | | | 51.5 | | | (5,568) | | | 4,406 | | | 5,625 | | | 4,128 | | | 8,592 | | | 6 | |
| Net income | — | | | — | | | — | | | — | | | — | | | 893 | | | 314 | | | 1,207 | | | — | |
| Shares repurchased, at cost and inclusive of excise taxes | (1.6) | | | — | | | 1.6 | | | (285) | | | — | | | — | | | — | | | (285) | | | — | |
Distributions to NCI | — | | | — | | | — | | | — | | | — | | | — | | | (197) | | | (197) | | | — | |
| Share-based compensation | — | | | — | | | — | | | — | | | 34 | | | — | | | — | | | 34 | | | — | |
| Issued shares withheld from employees related to share-based compensation, at cost | — | | | — | | | — | | | — | | | (4) | | | — | | | — | | | (4) | | | — | |
| | | | | | | | | | | | | | | | | |
| Balance at September 30, 2024 | 225.4 | | | $ | 1 | | | 53.1 | | | $ | (5,853) | | | $ | 4,436 | | | $ | 6,518 | | | $ | 4,245 | | | $ | 9,347 | | | $ | 6 | |
| | | | | | | | | | | | | | | | | |
| | | | | | | | | | | | | | | | | |
| | | | | | | | | | | | | | | | | |
| | | | | | | | | | | | | | | | | |
| | | | | | | | | | | | | | | | | |
| | | | | | | | | | | | | | | | | |
| | | | | | | | | | | | | | | | | |
| | | | | | | | | | | | | | | | | |
| | | | | | | | | | | | | | | | | |
| | | | | | | | | | | | | | | | | |
| | | | | | | | | | | | | | | | | |
| | | | | | | | | | | | | | | | | |
| | | | | | | | | | | | | | | | | |
| | | | | | | | | | | | | | | | | |
| | | | | | | | | | | | | | | | | |
| | | | | | | | | | | | | | | | | |
| | | | | | | | | | | | | | | | | |
| | | | | | | | | | | | | | | | | |
| | | | | | | | | | | | | | | | | |
| | | | | | | | | | | | | | | | | |
| | | | | | | | | | | | | | | | | |
| | | | | | | | | | | | | | | | | |
| | | | | | | | | | | | | | | | | |
| | | | | | | | | | | | | | | | | |
| | | | | | | | | | | | | | | | | |
| | | | | | | | | | | | | | | | | |
| | | | | | | | | | | | | | | | | |
| | | | | | | | | | | | | | | | | |
(1)Redeemable NCI represents the economic interest held by a third party in one of our consolidated VIEs that is redeemable for cash under certain circumstances, including those that are outside of our control. As such, the economic interest is not a component of permanent equity on our Consolidated Balance Sheets.
The accompanying notes are an integral part of these consolidated financial statements.
6
CHENIERE ENERGY, INC. AND SUBSIDIARIES
CONSOLIDATED STATEMENTS OF CASH FLOWS
(in millions)
(unaudited)
| | | | | | | | | | | | | |
| Nine Months Ended September 30, |
| 2025 | | 2024 | | |
| Cash flows from operating activities | | | | | |
Net income | $ | 3,861 | | | $ | 3,208 | | | |
| Adjustments to reconcile net income to net cash provided by operating activities: | | | | | |
| | | | | |
| Depreciation, amortization and accretion expense | 979 | | | 912 | | | |
| Share-based compensation expense | 140 | | | 140 | | | |
| | | | | |
| Amortization of discount and debt issuance costs | 29 | | | 32 | | | |
| Reduction of right-of-use assets | 465 | | | 500 | | | |
| | | | | |
Total gains on derivative instruments, net | (1,629) | | | (861) | | | |
Net cash provided by settlement of derivative instruments | 286 | | | — | | | |
| | | | | |
| | | | | |
| Deferred taxes | 1,227 | | | 93 | | | |
| Other, net | 11 | | | 27 | | | |
| Changes in operating assets and liabilities: | | | | | |
| Trade and other receivables | (587) | | | 427 | | | |
| | | | | |
| Inventory | 42 | | | 50 | | | |
| Margin deposits | 25 | | | (85) | | | |
| | | | | |
| Other non-current assets | (148) | | | (55) | | | |
| Accounts payable and accrued liabilities | (672) | | | (207) | | | |
| | | | | |
| Total deferred revenue | (10) | | | 24 | | | |
| Total operating lease liabilities | (459) | | | (489) | | | |
| | | | | |
| Other, net | (76) | | | 37 | | | |
Net cash provided by operating activities | 3,484 | | | 3,753 | | | |
| | | | | |
| Cash flows from investing activities | | | | | |
Property, plant and equipment, net of proceeds on commissioning sales of LNG of $94 million and zero, respectively | (2,334) | | | (1,669) | | | |
| | | | | |
| | | | | |
| | | | | |
| Other, net | 71 | | | (37) | | | |
Net cash used in investing activities | (2,263) | | | (1,706) | | | |
| | | | | |
| Cash flows from financing activities | | | | | |
| Proceeds from issuances of debt and borrowings | 1,262 | | | 2,725 | | | |
| Redemptions and repayments of debt | (1,617) | | | (3,171) | | | |
| | | | | |
| | | | | |
| | | | | |
Distributions to NCI | (600) | | | (648) | | | |
Contributions from redeemable NCI | 108 | | | 6 | | | |
| Payments related to tax withholdings for share-based compensation | (50) | | | (45) | | | |
| Repurchase of common stock, inclusive of excise taxes paid | (1,687) | | | (1,981) | | | |
| Dividends to stockholders | (332) | | | (300) | | | |
| | | | | |
| | | | | |
| Other, net | (94) | | | (79) | | | |
Net cash used in financing activities | (3,010) | | | (3,493) | | | |
| | | | | |
| Effect of exchange rate changes on cash, cash equivalents and restricted cash and cash equivalents | (3) | | | (3) | | | |
| | | | | |
Net decrease in cash, cash equivalents and restricted cash and cash equivalents | (1,792) | | | (1,449) | | | |
| Cash, cash equivalents and restricted cash and cash equivalents—beginning of period | 3,190 | | | 4,525 | | | |
| Cash, cash equivalents and restricted cash and cash equivalents—end of period | $ | 1,398 | | | $ | 3,076 | | | |
The accompanying notes are an integral part of these consolidated financial statements.
7
CHENIERE ENERGY, INC. AND SUBSIDIARIES
NOTES TO CONSOLIDATED FINANCIAL STATEMENTS
(unaudited)
NOTE 1—NATURE OF OPERATIONS AND BASIS OF PRESENTATION
We operate natural gas liquefaction and export facilities located in Cameron Parish, Louisiana at Sabine Pass and near Corpus Christi, Texas (respectively, the “Sabine Pass LNG Terminal” and “Corpus Christi LNG Terminal”), with total expected production capacity of over 60 mtpa of LNG, inclusive of estimated debottlenecking opportunities, of which over 12 mtpa was under construction and the remainder was in operation as of September 30, 2025, comprised of the following:
•over 30 mtpa of total production capacity in operation from natural gas liquefaction facilities at the Sabine Pass LNG Terminal owned by CQP (the “SPL Project”). The Sabine Pass LNG Terminal also has five LNG storage tanks, vaporizers and three marine berths. CQP also owns and operates a 94-mile natural gas supply pipeline that interconnects the Sabine Pass LNG Terminal with several large interstate and intrastate pipelines (the “Creole Trail Pipeline”). As of September 30, 2025, we owned 100% of the general partner interest, a 48.6% limited partner interest and 100% of the incentive distribution rights of CQP.
•over 30 mtpa of total expected production capacity, inclusive of estimated debottlenecking opportunities, including over 12 mtpa under construction and the remainder in operation as of September 30, 2025, from natural gas liquefaction facilities at the Corpus Christi LNG Terminal, of which we have 100% ownership interest. The Corpus Christi LNG Terminal also has three LNG storage tanks and two marine berths. We also own an approximately 21-mile natural gas supply pipeline that interconnects the Corpus Christi LNG Terminal with several large interstate and intrastate natural gas pipelines (the “Corpus Christi Pipeline”). The projects under construction at the Corpus Christi LNG Terminal include:
◦a project consisting of seven midscale Trains that is expected to add total production capacity of over 10 mtpa of LNG once fully completed (the “Corpus Christi Stage 3 Project”), with approximately 7 mtpa under construction and the remainder in operation from the first two midscale Trains that have reached substantial completion as of September 30, 2025 (subsequently, in October 2025, the third midscale Train reached substantial completion); and
◦a project consisting of two additional midscale Trains that is expected to add total production capacity of approximately 5 mtpa of LNG once fully completed, inclusive of estimated debottlenecking opportunities (the “CCL Midscale Trains 8 & 9 Project” and together with the existing assets at the Corpus Christi LNG Terminal, the Corpus Christi Stage 3 Project and the Corpus Christi Pipeline, the “CCL Project”), which was under construction as of September 30, 2025. Our board of directors (the “Board”) made a positive FID with respect to the CCL Midscale Trains 8 & 9 Project on June 17, 2025, and issued a full notice to proceed with construction to Bechtel Energy Inc. effective June 18, 2025.
In addition to the above, we are developing expansion projects to provide additional liquefaction capacity at both the Sabine Pass LNG Terminal and the Corpus Christi LNG Terminal and are commercializing to support the additional liquefaction capacity associated with these potential expansion projects. These projects or other projects, including infrastructure projects in support of natural gas supply and LNG demand, will require, among other things, acceptable commercial and financing arrangements before the Board makes a positive FID.
Basis of Presentation
The accompanying unaudited Consolidated Financial Statements of Cheniere have been prepared in accordance with GAAP for interim financial information and in accordance with Rule 10-01 of Regulation S-X and reflect all normal recurring adjustments, which are, in the opinion of management, necessary for a fair statement of the financial results for the interim periods presented. Accordingly, these Consolidated Financial Statements do not include all of the information and footnotes required by GAAP for complete financial statements and should be read in conjunction with the Consolidated Financial Statements and accompanying notes included in our annual report on Form 10-K for the fiscal year ended December 31, 2024.
Results of operations for the three and nine months ended September 30, 2025 are not necessarily indicative of the results of operations that will be realized for the year ending December 31, 2025.
CHENIERE ENERGY, INC. AND SUBSIDIARIES
NOTES TO CONSOLIDATED FINANCIAL STATEMENTS—CONTINUED
(unaudited)
Recent Accounting Standards
ASU 2023-09
In December 2023, the FASB issued ASU No. 2023-09, Income Taxes (Topic 740). This guidance further enhances income tax disclosures, primarily through standardization and disaggregation of rate reconciliation categories and income taxes paid by jurisdiction. The adoption of this guidance will not have an impact on our results of operations and financial condition but will have an impact on the annual disclosures required in the relevant notes to the consolidated financial statements. This guidance applies prospectively, with retrospective application permitted. We are progressing on the implementation and evaluating the method of adoption. We will adopt this guidance and conform with the disclosure requirements when it becomes mandatorily effective for our annual report for the year ending December 31, 2025.
ASU 2024-03
In November 2024, the FASB issued ASU No. 2024-03, Income Statement – Reporting Comprehensive Income – Expense Disaggregation Disclosures (Subtopic 220-40): Disaggregation of Income Statement Expenses, as clarified by ASU No. 2025-01 in January 2025. This guidance requires disaggregated disclosures about certain income statement expense line items on an annual and interim basis. We continue to evaluate the impact of the provisions of this guidance on our disclosures, but plan to adopt this guidance prospectively and conform with the disclosure requirements when it becomes mandatorily effective for our annual report for the year ending December 31, 2027.
NOTE 2—TRADE AND OTHER RECEIVABLES, NET OF CURRENT EXPECTED CREDIT LOSSES
Trade and other receivables, net of current expected credit losses, consisted of the following (in millions):
| | | | | | | | | | | | | | |
| | September 30, | | December 31, |
| | | | |
| | 2025 | | 2024 |
| Trade receivables | | | | |
SPL and CCL | | $ | 518 | | | $ | 548 | |
| | | | |
Cheniere Marketing | | 274 | | | 109 | |
| Other subsidiaries | | 7 | | | 4 | |
| Total trade receivables | | 799 | | | 661 | |
| Other receivables | | | | |
| Tax-related receivables | | 441 | | | 29 | |
| Other | | 84 | | | 37 | |
| Total other receivables | | 525 | | | 66 | |
| Total trade and other receivables, net of current expected credit losses | | $ | 1,324 | | | $ | 727 | |
NOTE 3—INVENTORY
Inventory consisted of the following (in millions):
| | | | | | | | | | | | | | |
| | September 30, | | December 31, |
| | | | |
| | 2025 | | 2024 |
| Materials | | $ | 256 | | | $ | 226 | |
| LNG | | 85 | | | 93 | |
| LNG in-transit | | 79 | | | 137 | |
| Natural gas | | 19 | | | 30 | |
| Other | | 19 | | | 15 | |
| Total inventory | | $ | 458 | | | $ | 501 | |
CHENIERE ENERGY, INC. AND SUBSIDIARIES
NOTES TO CONSOLIDATED FINANCIAL STATEMENTS—CONTINUED
(unaudited)
NOTE 4—PROPERTY, PLANT AND EQUIPMENT, NET OF ACCUMULATED DEPRECIATION
Property, plant and equipment, net of accumulated depreciation consisted of the following (in millions):
| | | | | | | | | | | | | | |
| | | | |
| | September 30, | | December 31, |
| | 2025 | | 2024 |
| Terminal and related assets | | | | |
| Terminal and interconnecting pipeline facilities | | $ | 36,492 | | | $ | 34,282 | |
| Land | | 618 | | | 465 | |
| Construction-in-process | | 5,396 | | | 5,486 | |
| Accumulated depreciation | | (8,115) | | | (7,231) | |
| Total terminal and related assets, net of accumulated depreciation | | 34,391 | | | 33,002 | |
| Fixed assets and other | | | | |
| Computer and office equipment | | 39 | | | 36 | |
| Furniture and fixtures | | 33 | | | 31 | |
| Computer software | | 124 | | | 122 | |
| Leasehold improvements | | 47 | | | 47 | |
| | | | |
| Other | | 24 | | | 24 | |
| Accumulated depreciation | | (200) | | | (188) | |
| Total fixed assets and other, net of accumulated depreciation | | 67 | | | 72 | |
| Assets under finance leases | | | | |
| Marine assets | | 1,060 | | | 587 | |
| Accumulated depreciation | | (173) | | | (109) | |
| Total assets under finance leases, net of accumulated depreciation | | 887 | | | 478 | |
| Property, plant and equipment, net of accumulated depreciation | | $ | 35,345 | | | $ | 33,552 | |
The following table shows depreciation expense and offsets to LNG terminal costs (in millions):
| | | | | | | | | | | | | | | | | | | | | | | | | | |
| | Three Months Ended September 30, | | Nine Months Ended September 30, | | |
| | 2025 | | 2024 | | 2025 | | 2024 | | |
| Depreciation expense | | $ | 337 | | | $ | 304 | | | $ | 973 | | | $ | 907 | | | |
| Offsets to LNG terminal costs (1) | | 47 | | | — | | | 102 | | | — | | | |
(1)We recognized offsets to LNG terminal costs related to the sale of commissioning volumes because these amounts were earned or loaded prior to the start of commercial operations of the respective Trains of the CCL Project and the SPL Project (collectively, the “Liquefaction Projects”) during the testing phase for its construction.
NOTE 5—DERIVATIVE INSTRUMENTS
We have the following derivative instruments:
•commodity derivatives consisting of the following (collectively, “Commodity Derivatives”):
◦natural gas and power supply contracts, including our IPM agreements, for the development, commissioning and operation of the Liquefaction Projects and expansion projects, as well as the associated economic hedges (collectively, the “Liquefaction Supply Derivatives”); and,
◦LNG derivatives in which we have contractual net settlement and economic hedges on the exposure to the commodity markets in which we have contractual arrangements to purchase or sell physical LNG (collectively, “LNG Trading Derivatives”); and
•Foreign currency exchange (“FX”) contracts to hedge exposure to currency risk associated with cash flows denominated in currencies other than U.S. dollar (“FX Derivatives”), associated with both LNG Trading Derivatives and operations in countries outside of the United States.
CHENIERE ENERGY, INC. AND SUBSIDIARIES
NOTES TO CONSOLIDATED FINANCIAL STATEMENTS—CONTINUED
(unaudited)
The following table shows the fair value of our derivative instruments that are required to be measured at fair value on a recurring basis, distinguished by the fair value hierarchy levels prescribed by GAAP (in millions):
| | | | | | | | | | | | | | | | | | | | | | | | | | | | | | | | | | | | | | | | | | | | | | | |
| Fair Value Measurements as of |
| September 30, 2025 | | December 31, 2024 |
| Quoted Prices in Active Markets
(Level 1) | | Significant Other Observable Inputs
(Level 2) | | Significant Unobservable Inputs
(Level 3) | | Total | | Quoted Prices in Active Markets
(Level 1) | | Significant Other Observable Inputs
(Level 2) | | Significant Unobservable Inputs
(Level 3) | | Total |
| | | | | | | | | | | | | | | |
| | | | | | | | | | | | | | | |
Liquefaction Supply Derivatives asset (liability) | $ | — | | | $ | 35 | | | $ | 589 | | | $ | 624 | | | $ | — | | | $ | 59 | | | $ | (801) | | | $ | (742) | |
LNG Trading Derivatives asset | — | | | 14 | | | — | | | 14 | | | — | | | 17 | | | — | | | 17 | |
FX Derivatives asset (liability) | — | | | (4) | | | — | | | (4) | | | — | | | 16 | | | — | | | 16 | |
| | | | | | | | | | | | | | | |
We value the Liquefaction Supply Derivatives and LNG Trading Derivatives using a market or option-based approach incorporating present value techniques, as needed, which incorporates observable commodity price curves, when available, and other relevant data. We value our FX Derivatives with a market approach using observable FX rates and other relevant data.
We include a significant portion of the Liquefaction Supply Derivatives as Level 3 within the valuation hierarchy as the fair value is developed through the use of internal models, which incorporate significant unobservable inputs. In instances where observable data is unavailable, consideration is given to the assumptions that market participants may use in valuing the asset or liability. To the extent valued using an option pricing model, we consider the future prices of energy units for unobservable periods to be a significant unobservable input to estimated net fair value. In estimating the future prices of energy units, we make judgments about market risk related to liquidity of commodity indices and volatility utilizing available market data. Changes in facts and circumstances or additional information may result in revised estimates and judgments, and actual results may differ from these estimates and judgments. We derive our volatility assumptions based on observed historical settled global LNG market pricing or accepted proxies for global LNG market pricing as well as settled domestic natural gas pricing. Such volatility assumptions also contemplate, as of the balance sheet date, observable forward curve data of such indices, as well as evolving available industry data and independent studies.
In developing our volatility assumptions, we acknowledge that the global LNG industry is inherently influenced by events such as unplanned supply constraints, geopolitical incidents, unusual climate events including drought and uncommonly mild, by historical standards, winters and summers, and real or threatened disruptive operational impacts to global energy infrastructure. Our current estimate of volatility includes the impact of otherwise rare events unless we believe market participants would exclude such events on account of their assertion that those events were specific to our company and deemed within our control. As applicable to our natural gas supply contracts, our fair value estimates incorporate market participant-based assumptions pertaining to certain contractual uncertainties, including those related to the availability of market information for delivery points, as well as the timing of satisfaction of certain events or development of infrastructure to support natural gas gathering and transport. We may recognize changes in fair value through earnings that could significantly impact our results of operations if and when such uncertainties are resolved.
The Level 3 fair value measurements of our natural gas positions within the Liquefaction Supply Derivatives could be materially impacted by a significant change in certain natural gas and international LNG prices. The following table includes quantitative information for the unobservable inputs for the Level 3 Liquefaction Supply Derivatives as of September 30, 2025:
| | | | | | | | | | | | | | | | | | | | | | | | | | |
| | Net Fair Value Asset (in millions) | | Valuation Approach | | Significant Unobservable Input | | Range of Significant Unobservable Inputs / Weighted Average (1) |
| Liquefaction Supply Derivatives | | $589 | | Market approach incorporating present value techniques | | Henry Hub basis spread | | $(0.638) - $0.295 / $(0.087) |
| | | | Option pricing model | | International LNG pricing spread, relative to Henry Hub (2) | | 66% - 391% / 177% |
(1)Unobservable inputs were weighted by the relative fair value of the instruments.
CHENIERE ENERGY, INC. AND SUBSIDIARIES
NOTES TO CONSOLIDATED FINANCIAL STATEMENTS—CONTINUED
(unaudited)
(2)Spread contemplates U.S. dollar-denominated pricing.
Increases or decreases in basis or pricing spreads, in isolation, would decrease or increase, respectively, the fair value of the Liquefaction Supply Derivatives.
The following table shows the changes in the fair value of the Level 3 Liquefaction Supply Derivatives (in millions):
| | | | | | | | | | | | | | | | | | | | | | | | | | | | |
| | Three Months Ended September 30, | | Nine Months Ended September 30, |
| | 2025 | | 2024 | | 2025 | | 2024 | | |
| Balance, beginning of period | | $ | (10) | | | $ | (1,729) | | | $ | (801) | | | $ | (2,178) | | | |
Realized and change in fair value gains (losses) included in net income (1): | | | | | | | | | | |
| Included in cost of sales, existing deals (2) | | 413 | | | 256 | | | 786 | | | 470 | | | |
| Included in cost of sales, new deals (3) | | (3) | | | (4) | | | (13) | | | 11 | | | |
| Purchases and settlements: | | | | | | | | | | |
| Purchases (4) | | — | | | — | | | — | | | — | | | |
| Settlements (5) | | 190 | | | 204 | | | 623 | | | 426 | | | |
| | | | | | | | | | |
| | | | | | | | | | |
| Transfers out of level 3 (6) | | (1) | | | 5 | | | (6) | | | 3 | | | |
| Balance, end of period | | $ | 589 | | | $ | (1,268) | | | $ | 589 | | | $ | (1,268) | | | |
Favorable changes in fair value relating to instruments still held at the end of the period | | $ | 410 | | | $ | 252 | | | $ | 773 | | | $ | 481 | | | |
(1)Does not include the realized value associated with derivative instruments that settle through physical delivery, as settlement is equal to the contractually fixed price from trade date multiplied by contractual volume. See settlements line item in this table.
(2)Impact to earnings on deals that existed at the beginning of the period and continue to exist at the end of the period.
(3)Impact to earnings on deals that were entered into during the reporting period and continue to exist at the end of the period.
(4)Includes any day one gain (loss) recognized during the reporting period on deals that were entered into during the reporting period, which continue to exist at the end of the period.
(5)Roll-off in the current period of amounts recognized in our Consolidated Balance Sheets at the end of the previous period due to settlement of the underlying instruments in the current period.
(6)Transferred out of Level 3 as a result of observable market for the underlying natural gas purchase agreements.
Commodity Derivatives
We hold Liquefaction Supply Derivatives, which are indexed to Henry Hub, global LNG or other natural gas price indices. As of September 30, 2025, the remaining fixed terms of the Liquefaction Supply Derivatives ranged up to approximately 15 years, some of which commence or accelerate upon the satisfaction of certain events or development of infrastructure to support natural gas gathering and transport.
Cheniere Marketing has historically entered into, and may from time to time enter into, LNG transactions that provide for contractual net settlement. Such transactions are accounted for as LNG Trading Derivatives along with financial commodity contracts in the form of swaps or futures. The terms of LNG Trading Derivatives range up to approximately one year.
The following table shows the notional amounts of our Commodity Derivatives:
| | | | | | | | | | | | | | | | | | | | | | | |
| September 30, 2025 | | December 31, 2024 |
| Liquefaction Supply Derivatives (1) | | LNG Trading Derivatives | | Liquefaction Supply Derivatives (1) | | LNG Trading Derivatives |
| Notional amount, net (in TBtu) | 12,625 | | | (9) | | | 12,503 | | | (8) | |
| | | | | | | |
(1)Inclusive of amounts under contracts with unsatisfied contractual conditions and exclusive of extension options that were uncertain to be taken as of both September 30, 2025 and December 31, 2024.
CHENIERE ENERGY, INC. AND SUBSIDIARIES
NOTES TO CONSOLIDATED FINANCIAL STATEMENTS—CONTINUED
(unaudited)
The following table shows the effect and location of our Commodity Derivatives recorded on our Consolidated Statements of Operations (in millions):
| | | | | | | | | | | | | | | | | | | | | | | | | | | | | | | |
| | | Gain (Loss) Recognized in Consolidated Statements of Operations |
| Consolidated Statements of Operations Location (1) | | Three Months Ended September 30, | | Nine Months Ended September 30, |
| | 2025 | | 2024 | | 2025 | | 2024 | | |
| | | | | | | | | | | |
| LNG Trading Derivatives | LNG revenues | | $ | 96 | | | $ | (3) | | | $ | 373 | | | $ | 14 | | | |
| LNG Trading Derivatives | Cost of sales | | (67) | | | (7) | | | (64) | | | (27) | | | |
| Liquefaction Supply Derivatives (2) | LNG revenues | | — | | | (2) | | | 2 | | | — | | | |
| Liquefaction Supply Derivatives (2) | Cost of sales | | 636 | | | 490 | | | 1,373 | | | 869 | | | |
| | | | | | | | | | | |
| | | | | | | | | | | |
(1)Fair value fluctuations associated with activities of our Commodity Derivatives are classified and presented consistently with the item economically hedged and the nature and intent of the derivative instrument.
(2)Does not include the realized value associated with the Liquefaction Supply Derivatives that settle through physical delivery.
FX Derivatives
Cheniere Marketing holds FX Derivatives to protect against the volatility in future cash flows attributable to changes in international currency exchange rates. The FX Derivatives are executed primarily to economically hedge the foreign currency exposure arising from cash flows expended for both physical and financial LNG transactions that are denominated in a currency other than the U.S. dollar. The terms of FX Derivatives range up to approximately one year.
The total notional amount of our FX Derivatives was $1,150 million and $642 million as of September 30, 2025 and December 31, 2024, respectively.
The following table shows the effect and location of our FX Derivatives recorded on our Consolidated Statements of Operations (in millions):
| | | | | | | | | | | | | | | | | | | | | | | | | | | | | | | |
| | | Gain (Loss) Recognized in Consolidated Statements of Operations |
| Consolidated Statements of Operations Location | | Three Months Ended September 30, | | Nine Months Ended September 30, |
| | 2025 | | 2024 | | 2025 | | 2024 | | |
FX Derivatives | LNG revenues | | $ | 6 | | | $ | (10) | | | $ | (55) | | | $ | 5 | | | |
| | | | | | | | | | | |
CHENIERE ENERGY, INC. AND SUBSIDIARIES
NOTES TO CONSOLIDATED FINANCIAL STATEMENTS—CONTINUED
(unaudited)
The following table shows the fair value and location of our derivative instruments on our Consolidated Balance Sheets (in millions):
| | | | | | | | | | | | | | | | | | | | | | | |
| September 30, 2025 |
| Liquefaction Supply Derivatives | | LNG Trading Derivatives | | FX Derivatives | | Total |
| Consolidated Balance Sheets Location | | | | | | | |
| Current derivative assets | $ | 42 | | | $ | 47 | | | $ | — | | | $ | 89 | |
| Derivative assets | 2,564 | | | — | | | 1 | | | 2,565 | |
| Total derivative assets | 2,606 | | | 47 | | | 1 | | | 2,654 | |
| | | | | | | |
| Current derivative liabilities | (518) | | | (33) | | | (5) | | | (556) | |
| Derivative liabilities | (1,464) | | | — | | | — | | | (1,464) | |
| Total derivative liabilities | (1,982) | | | (33) | | | (5) | | | (2,020) | |
| | | | | | | |
| Derivative asset (liability), net | $ | 624 | | | $ | 14 | | | $ | (4) | | | $ | 634 | |
| | | | | | | |
| December 31, 2024 |
| Liquefaction Supply Derivatives | | LNG Trading Derivatives | | FX Derivatives | | Total |
| Consolidated Balance Sheets Location | | | | | | | |
| Current derivative assets | $ | 105 | | | $ | 32 | | | $ | 18 | | | $ | 155 | |
| Derivative assets | 1,903 | | | — | | | — | | | 1,903 | |
| Total derivative assets | 2,008 | | | 32 | | | 18 | | | 2,058 | |
| | | | | | | |
| Current derivative liabilities | (885) | | | (15) | | | (2) | | | (902) | |
| Derivative liabilities | (1,865) | | | — | | | — | | | (1,865) | |
| Total derivative liabilities | (2,750) | | | (15) | | | (2) | | | (2,767) | |
| | | | | | | |
| Derivative asset (liability), net | $ | (742) | | | $ | 17 | | | $ | 16 | | | $ | (709) | |
CHENIERE ENERGY, INC. AND SUBSIDIARIES
NOTES TO CONSOLIDATED FINANCIAL STATEMENTS—CONTINUED
(unaudited)
Consolidated Balance Sheets Presentation
The following table reconciles the fair value of our derivative assets and liabilities on a gross basis, by contract, to net amounts as presented on our Consolidated Balance Sheets after offsetting for any balances with the same counterparty under master netting arrangements or other relevant netting criteria under GAAP (in millions):
| | | | | | | | | | | | | | | | | | | | |
| | Liquefaction Supply Derivatives | | LNG Trading Derivatives | | FX Derivatives |
| | | |
| As of September 30, 2025 | | | | | | |
| Gross assets | | $ | 3,972 | | | $ | 48 | | | $ | 2 | |
| Offsetting amounts | | (1,366) | | | (1) | | | (1) | |
| Net assets (1) | | $ | 2,606 | | | $ | 47 | | | $ | 1 | |
| | | | | | |
| Gross liabilities | | $ | (2,044) | | | $ | (51) | | | $ | (7) | |
| Offsetting amounts | | 62 | | | 18 | | | 2 | |
| Net liabilities (2) | | $ | (1,982) | | | $ | (33) | | | $ | (5) | |
| | | | | | |
| As of December 31, 2024 | | | | | | |
| Gross assets | | $ | 3,064 | | | $ | 42 | | | $ | 25 | |
| Offsetting amounts | | (1,056) | | | (10) | | | (7) | |
| Net assets (1) | | $ | 2,008 | | | $ | 32 | | | $ | 18 | |
| | | | | | |
| Gross liabilities | | $ | (2,790) | | | $ | (16) | | | $ | (3) | |
| Offsetting amounts | | 40 | | | 1 | | | 1 | |
| Net liabilities (2) | | $ | (2,750) | | | $ | (15) | | | $ | (2) | |
(1)Includes current and non-current derivative assets of $89 million and $2,565 million, respectively, as of September 30, 2025 and $155 million and $1,903 million, respectively, as of December 31, 2024.
(2)Includes current and non-current derivative liabilities of $556 million and $1,464 million, respectively, as of September 30, 2025 and $902 million and $1,865 million, respectively, as of December 31, 2024.
The table below shows the collateral balances that are recorded within margin deposits and other current liabilities that are not netted on our Consolidated Balance Sheets (in millions):
| | | | | | | | | | | | | | | | | |
| Consolidated Balance Sheets Location | | September 30, | | December 31, |
| | 2025 | | 2024 |
| Liquefaction Supply Derivatives | Margin deposits | | $ | 23 | | | $ | 18 | |
| Liquefaction Supply Derivatives | Other current liabilities | | 1 | | | — | |
| LNG Trading Derivatives | Margin deposits | | 80 | | | 110 | |
| | | | | |
NOTE 6—NON-CONTROLLING INTERESTS AND VARIABLE INTEREST ENTITIES
Substantially all of our consolidated VIEs’ assets and liabilities relate to CQP. We own a 48.6% limited partner interest in CQP, and we also own all of the 2% general partner interest and 100% of the incentive distribution rights in CQP. The remaining 49.4% non-controlling limited partner interest in CQP is held by affiliates of Blackstone Inc. and Brookfield Asset Management, Inc. as well as the public.
CHENIERE ENERGY, INC. AND SUBSIDIARIES
NOTES TO CONSOLIDATED FINANCIAL STATEMENTS—CONTINUED
(unaudited)
The following table presents the summarized consolidated assets and liabilities (in millions) of our consolidated VIEs, which are included in our Consolidated Balance Sheets. The assets in the table below may only be used to settle obligations of the respective VIEs. In addition, there is no recourse to us for the consolidated VIEs’ liabilities. The assets and liabilities in the table below exclude intercompany balances between the respective VIEs and Cheniere that eliminate in our Consolidated Financial Statements.
| | | | | | | | | | | | | | |
| | September 30, | | December 31, |
| | | | |
| | 2025 | | 2024 |
| ASSETS | | | | |
| Current assets | | | | |
| Cash and cash equivalents | | $ | 121 | | | $ | 270 | |
| Restricted cash and cash equivalents | | 61 | | | 125 | |
| Trade and other receivables, net of current expected credit losses | | 360 | | | 381 | |
| Inventory | | 152 | | | 154 | |
| Current derivative assets | | 15 | | | 84 | |
| Margin deposits | | 14 | | | 13 | |
| Other current assets, net | | 61 | | | 54 | |
| Total current assets | | 784 | | | 1,081 | |
| | | | |
| | | | |
| Property, plant and equipment, net of accumulated depreciation | | 15,532 | | | 15,880 | |
| Operating lease assets | | 79 | | | 80 | |
| Derivative assets | | 14 | | | 98 | |
| Other non-current assets, net | | 282 | | | 206 | |
| | | | |
| Total assets | | $ | 16,691 | | | $ | 17,345 | |
| | | | |
| LIABILITIES | | | | |
| Current liabilities | | | | |
| Accounts payable | | $ | 73 | | | $ | 70 | |
| Accrued liabilities | | 701 | | | 881 | |
| Current debt, net of unamortized discount and debt issuance costs | | 605 | | | 351 | |
| Deferred revenue | | 148 | | | 120 | |
| Current operating lease liabilities | | 5 | | | 4 | |
| Current derivative liabilities | | 139 | | | 250 | |
| Other current liabilities | | 8 | | | 16 | |
| | | | |
| Total current liabilities | | 1,679 | | | 1,692 | |
| | | | |
| Long-term debt, net of unamortized discount and debt issuance costs | | 14,156 | | | 14,761 | |
| Operating lease liabilities | | 74 | | | 76 | |
| | | | |
| Derivative liabilities | | 1,069 | | | 1,213 | |
| Other non-current liabilities | | 163 | | | 176 | |
| Total liabilities | | $ | 17,141 | | | $ | 17,918 | |
| | | | |
| | | | |
| | | | |
| | | | |
| | | | |
NOTE 7—ACCRUED LIABILITIES
Accrued liabilities consisted of the following (in millions):
| | | | | | | | | | | | | | | | |
| | September 30, | | December 31, | | |
| | | | | | |
| | 2025 | | 2024 | | |
| Natural gas purchases | | $ | 676 | | | $ | 886 | | | |
| | | | | | |
| Terminal and related asset costs | | 219 | | | 272 | | | |
| Interest costs and related debt fees | | 266 | | | 214 | | | |
| Compensation and benefits | | 176 | | | 283 | | | |
| | | | | | |
| | | | | | |
| Tax-related liabilities | | 115 | | | 472 | | | |
| Other accrued liabilities | | 40 | | | 52 | | | |
| Total accrued liabilities | | $ | 1,492 | | | $ | 2,179 | | | |
CHENIERE ENERGY, INC. AND SUBSIDIARIES
NOTES TO CONSOLIDATED FINANCIAL STATEMENTS—CONTINUED
(unaudited)
NOTE 8—DEBT
Debt consisted of the following (in millions):
| | | | | | | | | | | | | | |
| | September 30, | | December 31, |
| | | | |
| | 2025 | | 2024 |
SPL: | | | | |
| Senior Secured Notes: | | | | |
| | | | |
| | | | |
| | | | |
5.625% due 2025 | | $ | — | | | $ | 300 | |
5.875% due 2026 | | 500 | | | 1,500 | |
5.00% due 2027 | | 1,500 | | | 1,500 | |
4.200% due 2028 | | 1,350 | | | 1,350 | |
4.500% due 2030 | | 2,000 | | | 2,000 | |
due 2037 with weighted average rate of 4.747% and 4.746% at September 30, 2025 and December 31, 2024, respectively (1) | | 1,730 | | | 1,782 | |
Total SPL Senior Secured Notes | | 7,080 | | | 8,432 | |
Revolving credit and guaranty agreement (the “SPL Revolving Credit Facility”) | | — | | | — | |
Total debt - SPL | | 7,080 | | | 8,432 | |
| | | | |
CQP: | | | | |
| Senior Notes: | | | | |
| | | | |
| | | | |
4.500% due 2029 | | 1,500 | | | 1,500 | |
4.000% due 2031 | | 1,500 | | | 1,500 | |
3.25% due 2032 | | 1,200 | | | 1,200 | |
5.950% due 2033 | | 1,400 | | | 1,400 | |
5.750% due 2034 | | 1,200 | | | 1,200 | |
5.550% due 2035 (2) | | 1,000 | | | — | |
Total CQP Senior Notes | | 7,800 | | | 6,800 | |
Revolving credit and guaranty agreement (the “CQP Revolving Credit Facility”) | | — | | | — | |
Total debt - CQP | | 7,800 | | | 6,800 | |
| | | | |
CCH: | | | | |
| Senior Secured Notes: | | | | |
| | | | |
| | | | |
5.125% due 2027 | | 1,201 | | | 1,201 | |
3.700% due 2029 | | 1,125 | | | 1,125 | |
3.788% weighted average rate due 2039 (1) | | 2,539 | | | 2,539 | |
Total CCH Senior Secured Notes | | 4,865 | | | 4,865 | |
Term loan facility agreement (the “CCH Credit Facility”) | | — | | | — | |
Working capital facility agreement (the “CCH Working Capital Facility”) | | — | | | — | |
Total debt - CCH | | 4,865 | | | 4,865 | |
| | | | |
Cheniere: | | | | |
4.625% Senior Notes due 2028 | | 1,500 | | | 1,500 | |
5.650% Senior Notes due 2034 | | 1,500 | | | 1,500 | |
Total Cheniere Senior Notes | | 3,000 | | | 3,000 | |
Revolving credit agreement (the “Cheniere Revolving Credit Facility”) | | — | | | — | |
| | | | |
Total debt - Cheniere | | 3,000 | | | 3,000 | |
| | | | |
| | | | |
| Total debt | | 22,745 | | | 23,097 | |
| | | | |
| Current debt, net of unamortized discount and debt issuance costs (1) | | (605) | | | (351) | |
| | | | |
| Unamortized discount and debt issuance costs | | (183) | | | (192) | |
| Total long-term debt, net of unamortized discount and debt issuance costs | | $ | 21,957 | | | $ | 22,554 | |
(1)Includes notes that amortize based on a fixed amortization schedule as set forth in their respective indentures.
CHENIERE ENERGY, INC. AND SUBSIDIARIES
NOTES TO CONSOLIDATED FINANCIAL STATEMENTS—CONTINUED
(unaudited)
Credit Facilities
Below is a summary of our committed credit facilities outstanding as of September 30, 2025 (in millions):
| | | | | | | | | | | | | | | | | | | | | | | | | | | | | | | | | | | | | | |
| | | | | | | | SPL Revolving Credit Facility | | CQP Revolving Credit Facility | | CCH Credit Facility | | CCH Working Capital Facility | | Cheniere Revolving Credit Facility (1) | | |
| Total facility size | | | | | | | | $ | 1,000 | | | $ | 1,000 | | | $ | 3,260 | | | $ | 1,500 | | | $ | 1,250 | | | |
| | | | | | | | | | | | | | | | | | |
| Less: | | | | | | | | | | | | | | | | | | |
| Outstanding balance | | | | | | | | — | | | — | | | — | | | — | | | — | | | |
| | | | | | | | | | | | | | | | | | |
| Letters of credit issued | | | | | | | | 185 | | | — | | | — | | | 110 | | | — | | | |
| Available commitment | | | | | | | | $ | 815 | | | $ | 1,000 | | | $ | 3,260 | | | $ | 1,390 | | | $ | 1,250 | | | |
| | | | | | | | | | | | | | | | | | |
| Priority ranking | | | | | | | | Senior secured | | Senior unsecured | | Senior secured | | Senior secured | | Senior unsecured | | |
| Interest rate on available balance (2) | | | | | | | | SOFR plus credit spread adjustment of 0.1%, plus margin of 1.0% - 1.75% or base rate plus 0.0% - 0.75% | | SOFR plus credit spread adjustment of 0.1%, plus margin of 1.125% - 2.0% or base rate plus 0.125% - 1.0% | | SOFR plus credit spread adjustment of 0.1%, plus margin of 1.5% or base rate plus 0.5% | | SOFR plus credit spread adjustment of 0.1%, plus margin of 1.0% - 1.5% or base rate plus 0.0% - 0.5% | | SOFR plus margin of 1.075% - 2.00% or base rate plus 0.075% - 1.00% | | |
| | | | | | | | | | | | | | | | | | |
| Commitment fees on undrawn balance (2) | | | | | | | | 0.075% - 0.30% | | 0.10% - 0.30% | | 0.525% | | 0.10% - 0.20% | | 0.090% - 0.290% | | |
| Letter of credit fees (2) | | | | | | | | 1.0% - 1.75% | | 1.125% - 2.0% | | N/A | | 1.0% - 1.5% | | 1.075% - 2.00% | | |
| Maturity date | | | | | | | | June 23, 2028 | | June 23, 2028 | | (3) | | June 15, 2027 | | August 1, 2030 | | |
(1)In August 2025, we entered into an amendment and restatement of the Cheniere Revolving Credit Facility, resulting in an extended maturity date, reduced rate of interest and commitment fees applicable thereunder and certain other changes to terms and conditions.
(2)The margin on the interest rate, the commitment fees and the letter of credit fees is subject to change based on the applicable entity’s credit rating. The interest rate and the commitment fees of the Cheniere Revolving Credit Facility are also based on the achievement of certain methane emissions management standards.
(3)The CCH Credit Facility matures the earlier of June 15, 2029 or two years after the substantial completion of the last Train of the Corpus Christi Stage 3 Project.
Restrictive Debt Covenants
The agreements governing our and our subsidiaries’ indebtedness contain customary terms and events of default and certain covenants that, among other things, may limit our and our subsidiaries’ ability to make certain investments or pay dividends or distributions. For example, SPL and CCH are restricted from making distributions under agreements governing their respective indebtedness generally until, among other requirements, appropriate reserves have been established for debt service using cash or letters of credit and a historical and projected debt service coverage ratio of at least 1.25:1.00 is satisfied.
As of September 30, 2025, we were, and each of our subsidiaries was, in compliance with all covenants related to our respective debt agreements.
Interest Expense
Total interest expense, net of capitalized interest, consisted of the following (in millions):
| | | | | | | | | | | | | | | | | | | | | | | | | | | | |
| | | Three Months Ended September 30, | | Nine Months Ended September 30, |
| | 2025 | | 2024 | | 2025 | | 2024 | | |
| Total interest cost | | $ | 301 | | | $ | 304 | | | $ | 894 | | | $ | 924 | | | |
| Capitalized interest | | (65) | | | (57) | | | (192) | | | (154) | | | |
| Total interest expense, net of capitalized interest | | $ | 236 | | | $ | 247 | | | $ | 702 | | | $ | 770 | | | |
CHENIERE ENERGY, INC. AND SUBSIDIARIES
NOTES TO CONSOLIDATED FINANCIAL STATEMENTS—CONTINUED
(unaudited)
Fair Value Disclosures
The following table shows the carrying amount and estimated fair value of our senior notes (in millions):
| | | | | | | | | | | | | | | | | | | | | | | | | | |
| | | September 30, 2025 | | December 31, 2024 |
| | | Carrying
Amount (1) | | Estimated
Fair Value (2) | | Carrying
Amount (1) | | Estimated
Fair Value (2) |
Senior notes | | $ | 22,745 | | | $ | 22,513 | | | $ | 23,097 | | | $ | 22,220 | |
| | | | | | | | |
| | | | | | | | |
| | | | | | | | |
| | | | | | | | |
| | | | | | | | |
(1)Carrying amounts exclude unamortized discount and debt issuance costs.
(2)As of September 30, 2025 and December 31, 2024, $3.1 billion and $3.0 billion, respectively, of the fair value of our senior notes were classified as Level 3 since these senior notes were valued by applying an unobservable illiquidity adjustment to the price derived from trades or indicative bids of instruments with similar terms, maturities and credit standing. The remainder of the fair value of our senior notes was classified as Level 2, based on prices derived from trades or indicative bids of the instruments.
The estimated fair value of our credit facilities approximates the principal amount outstanding because the interest rates are indexed to market rates and the debt may be repaid, in full or in part, at any time without penalty.
NOTE 9—LEASES
We are the lessee of LNG vessels leased under time charters (“vessel charters”) as well as tug vessels, office space and facilities, land sites and equipment.
Future annual minimum lease payments for operating and finance leases as of September 30, 2025 are as follows (in millions):
| | | | | | | | | | | |
| Years Ending December 31, | Operating Leases | | Finance Leases |
| 2025 | $ | 181 | | | $ | 37 | |
| 2026 | 639 | | | 141 | |
| 2027 | 545 | | | 143 | |
| 2028 | 376 | | | 146 | |
| 2029 | 287 | | | 146 | |
| Thereafter | 1,172 | | | 646 | |
| Total lease payments (1) | 3,200 | | | 1,259 | |
| Less: Interest | (570) | | | (307) | |
| Present value of lease liabilities | $ | 2,630 | | | $ | 952 | |
(1)Does not include approximately $3.0 billion of legally binding minimum payments for leases executed as of September 30, 2025 that will commence in future periods, consisting primarily of vessel charters, with fixed minimum lease terms of up to 15 years.
The following table shows the weighted-average remaining lease term and the weighted-average discount rate for our operating leases and finance leases:
| | | | | | | | | | | | | | | | | | | | | | | |
| September 30, 2025 | | December 31, 2024 |
| Operating Leases | | Finance Leases | | Operating Leases | | Finance Leases |
| Weighted-average remaining lease term (in years) | 7.3 | | 8.8 | | 7.0 | | 8.8 |
| Weighted-average discount rate (1) | 5.2% | | 6.6% | | 5.0% | | 7.4% |
(1)The weighted average discount rate is impacted by certain finance leases that commenced prior to the adoption of the current leasing standard under GAAP. In accordance with previous accounting guidance, the implied rate is based on the fair value of the underlying assets.
CHENIERE ENERGY, INC. AND SUBSIDIARIES
NOTES TO CONSOLIDATED FINANCIAL STATEMENTS—CONTINUED
(unaudited)
The following table includes other quantitative information for our operating and finance leases (in millions):
| | | | | | | | | | | | | |
| Nine Months Ended September 30, |
| 2025 | | 2024 | | |
| | | | | |
| | | | | |
| | | | | |
| | | | | |
| Right-of-use assets obtained in exchange for operating lease liabilities (1) | $ | 408 | | | $ | 718 | | | |
| Right-of-use assets obtained in exchange for finance lease liabilities (2) | 472 | | | 59 | | | |
(1)Net of $33 million reclassified from operating leases to finance leases during the nine months ended September 30, 2024, as a result of modifications of the underlying tug vessel leases.
(2)Net of $15 million reclassified from finance leases to operating leases during the nine months ended September 30, 2024, as a result of modifications of the underlying tug vessel leases.
LNG Vessel Subleases
We sublease certain LNG vessels under charter to third parties while retaining our existing obligation to the original lessor. All of our sublease arrangements have been assessed as operating leases. The following table shows the sublease income recognized in other revenues on our Consolidated Statements of Operations (in millions):
| | | | | | | | | | | | | | | | | | | | | | | | | | |
| | Three Months Ended September 30, | | Nine Months Ended September 30, |
| | 2025 | | 2024 | | 2025 | | 2024 | | |
| Fixed income | | $ | 25 | | | $ | 72 | | | $ | 66 | | | $ | 238 | | | |
| Variable income | | 14 | | | 11 | | | 36 | | | 28 | | | |
| Total sublease income | | $ | 39 | | | $ | 83 | | | $ | 102 | | | $ | 266 | | | |
Future annual minimum sublease payments to be received from LNG vessel subleases as of September 30, 2025 are as follows (in millions):
| | | | | |
| Years Ending December 31, | Sublease Payments |
| 2025 | $ | 8 | |
| 2026 | 1 | |
| Total sublease payments | $ | 9 | |
NOTE 10—REVENUES
The following table represents a disaggregation of revenue earned (in millions):
| | | | | | | | | | | | | | | | | | | | | | | | | | | | |
| | Three Months Ended September 30, | | Nine Months Ended September 30, |
| | 2025 | | 2024 | | 2025 | | 2024 | | |
| Revenues from contracts with customers | | | | | | | | | | |
LNG revenues (excluding net derivative gain (loss) below) | | $ | 4,200 | | | $ | 3,569 | | | $ | 13,802 | | | $ | 10,614 | | | |
| Regasification revenues | | 34 | | | 34 | | | 102 | | | 102 | | | |
| Other revenues (1) | | 59 | | | 80 | | | 185 | | | 231 | | | |
| | | | | | | | | | |
| Total revenues from contracts with customers | | 4,293 | | | 3,683 | | | 14,089 | | | 10,947 | | | |
Net derivative gain (loss) (see Note 5) | | 102 | | | (15) | | | 320 | | | 19 | | | |
| | 39 | | | 83 | | | 102 | | | 266 | | | |
| Other revenues | | 7 | | | 12 | | | 15 | | | 35 | | | |
| Total revenues | | $ | 4,441 | | | $ | 3,763 | | | $ | 14,526 | | | $ | 11,267 | | | |
(1)Includes revenues from LNG vessel subcharters that do not qualify as leases for accounting purposes.
For the three and nine months ended September 30, 2025 and 2024, we did not have any material revenue arrangements that were presented within our Consolidated Statements of Operations on a net basis.
CHENIERE ENERGY, INC. AND SUBSIDIARIES
NOTES TO CONSOLIDATED FINANCIAL STATEMENTS—CONTINUED
(unaudited)
Contract Assets and Liabilities
The following table shows our contract assets, net of current expected credit losses, which are included in other current assets, net and other non-current assets, net on our Consolidated Balance Sheets (in millions):
| | | | | | | | | | | | | | |
| | September 30, | | December 31, |
| | | | |
| | 2025 | | 2024 |
| Contract assets, net of current expected credit losses | | $ | 401 | | | $ | 331 | |
The following table reflects the changes in our contract liabilities, which are included in deferred revenue and other non-current liabilities on our Consolidated Balance Sheets (in millions):
| | | | | | | | | | |
| | |
| | Nine Months Ended September 30, 2025 | | |
| Deferred revenue, beginning of period | | $ | 318 | | | |
| Cash received but not yet recognized in revenue | | 149 | | | |
| Revenue recognized from prior period deferral | | (162) | | | |
| Deferred revenue, end of period | | $ | 305 | | | |
Transaction Price Allocated to Future Performance Obligations
Because many of our sales contracts have long-term durations, we are contractually entitled to significant future consideration, which we have not yet recognized as revenue. The following table discloses the aggregate amount of the transaction price that is allocated to performance obligations that have not yet been satisfied:
| | | | | | | | | | | | | | | | | | | | | | | | | | |
| | September 30, 2025 | | December 31, 2024 |
| | Unsatisfied Transaction Price (in billions) | | Weighted Average Recognition Timing (years) (1) | | Unsatisfied Transaction Price (in billions) | | Weighted Average Recognition Timing (years) (1) |
| LNG revenues | | $ | 107.6 | | | 8 | | $ | 104.7 | | | 8 |
| Regasification revenues | | 0.4 | | | 2 | | 0.5 | | | 3 |
| Total revenues | | $ | 108.0 | | | | | $ | 105.2 | | | |
(1)The weighted average recognition timing represents an estimate of the number of years during which we shall have recognized half of the unsatisfied transaction price.
The following potential future sources of revenue are omitted from the table above under exemptions we have elected: (1) all performance obligations that are part of a contract that has an original expected duration of one year or less and (2) substantially all variable consideration under our SPAs and TUAs that is allocated entirely to a wholly unsatisfied performance obligation or to a wholly unsatisfied promise to transfer a distinct good or service that forms part of a single performance obligation when that performance obligation qualifies as a series. The amount of revenue from variable fees that is not included in the transaction price, and allocable to wholly unsatisfied future performance obligations or otherwise constrained, will vary based on (1) the future prices of the underlying variable index, primarily Henry Hub, throughout the contract terms, to the extent customers elect to take delivery of their LNG, (2) adjustments to the consumer price index and (3) the outcome of certain contingent events, including the achievement of milestones upon which delivery of LNG under certain contracts is conditioned.
The following table summarizes the percentage of variable consideration earned under contracts with customers included in the table above:
| | | | | | | | | | | | | | | | | | | | | | | | | |
| Three Months Ended September 30, | | Nine Months Ended September 30, | | |
| | | | | | | |
| 2025 | | 2024 | | 2025 | | 2024 | | |
| LNG revenues | 64 | % | | 60 | % | | 67 | % | | 57 | % | | |
| Regasification revenues | 8 | % | | 8 | % | | 8 | % | | 8 | % | | |
CHENIERE ENERGY, INC. AND SUBSIDIARIES
NOTES TO CONSOLIDATED FINANCIAL STATEMENTS—CONTINUED
(unaudited)
NOTE 11—RELATED PARTY TRANSACTIONS
Below is a summary of our related party transactions, all in the ordinary course of business, as reported on our Consolidated Statements of Operations (in millions):
| | | | | | | | | | | | | | | | | | | | | | | | | |
| Three Months Ended September 30, | | Nine Months Ended September 30, |
| 2025 | | 2024 | | 2025 | | 2024 | | |
| | | | | | | | | |
| | | | | | | | | |
| | | | | | | | | |
| Other revenues | | | | | | | | | |
| Operating agreement and construction management agreement with equity method investee (1) | $ | — | | | $ | 3 | | | $ | 1 | | | $ | 7 | | | |
| | | | | | | | | |
| | | | | | | | | |
| | | | | | | | | |
| | | | | | | | | |
| | | | | | | | | |
| | | | | | | | | |
| | | | | | | | | |
| Operating and maintenance expense | | | | | | | | | |
| Natural gas transportation and storage agreements with equity method investees (1) | 8 | | | 10 | | | 24 | | | 15 | | | |
| Natural gas transportation and storage agreements with other related party (2) | — | | | 15 | | | 28 | | | 44 | | | |
| | | | | | | | | |
| | | | | | | | | |
(1)On February 13, 2025, we sold all of our equity interests in one of our equity method investments to a third party. Additionally, we assigned certain operating and construction management agreements to the purchaser of such interests. Included in the table above are $1 million of other revenues and $1 million of operating and maintenance expense from the investee during the nine months ended September 30, 2025 and $3 million and $7 million of other revenues and $2 million and $7 million of operating and maintenance expense from the investee during the three and nine months ended September 30, 2024, respectively.
(2)These arrangements were with a party that was related to the entity that indirectly owns a portion of CQP’s limited partner interests. Due to the sale of such interests by that entity effective May 13, 2025, this party is no longer considered a related party as of that date.
Below is a summary of our related party balances, all in the ordinary course of business, as reported on our Consolidated Balance Sheets (in millions):
| | | | | | | | | | | | | | |
| | September 30, | | December 31, |
| | | |
| 2025 | | 2024 |
| Trade and other receivables, net of current expected credit losses | $ | — | | | $ | 4 | |
| | | | |
| Accrued liabilities | 3 | | | 8 | |
| | | |
| | | |
| | | | |
| | | |
| | | |
NOTE 12—INCOME TAXES
We recorded an income tax provision of $303 million and $850 million during the three and nine months ended September 30, 2025, respectively, and an income tax provision of $231 million and $550 million for the same periods of 2024, respectively, which was calculated using the annual effective tax rate method.
Our effective tax rate was 18.9% and 18.0% during the three and nine months ended September 30, 2025, respectively, as compared to 16.1% and 14.6% for the same periods of 2024, respectively. Our effective tax rate increased between the comparable periods primarily due to: (1) decreased ratio of pre-tax income attributable to CQP, which is partially not taxable to us, (2) increased tax expense due to a valuation allowance on a capital loss carryover generated on the sale of all of our equity interests in an equity method investment during the three months ended March 31, 2025 and (3) a reduced Foreign Derived Intangible Income (“FDII”) deduction. The effective tax rate for the comparable three and nine month periods was lower than the statutory rate of 21.0% primarily due to CQP’s income that is partially not taxable to us.
On July 4, 2025, the One Big Beautiful Bill Act (“OBBBA”) was signed into law with significant changes to the Internal Revenue Code that impact us, including, among other provisions, reinstating 100% accelerated tax bonus depreciation on qualifying assets acquired after January 19, 2025 and modifying the export-promoting FDII deduction rules, renamed to the Foreign Derived Deduction Eligible Income (“FDDEI”) under the OBBBA beginning in 2026.
CHENIERE ENERGY, INC. AND SUBSIDIARIES
NOTES TO CONSOLIDATED FINANCIAL STATEMENTS—CONTINUED
(unaudited)
We initially applied the relevant and effective provisions of the OBBBA in the third quarter of 2025, including provisions related to bonus depreciation. The legislation did not have a material impact on our income tax expense for the three months ended September 30, 2025, and we do not expect it to materially change our effective income tax rate for 2025. However, the 100% bonus depreciation provision under the OBBBA is expected to defer our tax liability, ultimately reducing our 2025 income taxes payable to a nominal amount, primarily due to the accelerated tax deduction on qualifying Corpus Christi Stage 3 Project assets.
On September 30, 2025, the Internal Revenue Service (the “IRS”) issued Notice 2025-49, which includes, among other provisions, revised interim rules for calculating CAMT adjusted financial statement income, including rules allowing us to utilize and benefit from our existing net operating loss carryovers for both CAMT and regular tax in the same period. As a result, our cash tax obligations have been deferred and we are entitled to a refund of $380 million of previously paid CAMT, which has been recognized as a receivable within trade and other receivables, net of current expected credit losses on our Consolidated Balance Sheets as of September 30, 2025.
NOTE 13—NET INCOME PER SHARE ATTRIBUTABLE TO COMMON STOCKHOLDERS
We utilize the two-class method for computing earnings per share, which requires an allocation of earnings as if all earnings were distributed during the period to the common stockholders and participating securities. The redeemable NCI held by a third party in one of our consolidated VIEs is considered participating because, under certain circumstances, it is redeemable for cash at a return. Therefore, the accretion of the redeemable NCI to its redemption value, net of tax, which is recognized as a deemed dividend within retained earnings, is deducted from net income in computing net income per share attributable to common stockholders.
The following table provides a reconciliation of net income attributable to common stockholders and basic and diluted weighted average common shares outstanding (in millions, except per share data):
| | | | | | | | | | | | | | | | | | | | | | | | | | | | |
| | Three Months Ended September 30, | | Nine Months Ended September 30, |
| | 2025 | | 2024 | | 2025 | | 2024 | | |
| Net income attributable to Cheniere | | $ | 1,049 | | | $ | 893 | | | $ | 3,028 | | | $ | 2,275 | | | |
Less: accretion of redeemable NCI, net of tax | | 4 | | | — | | | 10 | | | — | | | |
| Net income attributable to common stockholders | | $ | 1,045 | | | $ | 893 | | | $ | 3,018 | | | $ | 2,275 | | | |
| | | | | | | | | | |
| Weighted average common shares outstanding: | | | | | | | | | | |
| Basic | | 219.3 | | | 226.3 | | | 221.5 | | | 229.6 | | | |
| Dilutive unvested stock | | 0.6 | | | 0.7 | | | 0.6 | | | 0.7 | | | |
| | | | | | | | | | |
| Diluted | | 219.9 | | | 227.0 | | | 222.1 | | | 230.3 | | | |
| | | | | | | | | | |
Net income per share attributable to common stockholders—basic (1) | | $ | 4.76 | | | $ | 3.95 | | | $ | 13.63 | | | $ | 9.91 | | | |
Net income per share attributable to common stockholders—diluted (1) | | $ | 4.75 | | | $ | 3.93 | | | $ | 13.59 | | | $ | 9.88 | | | |
| | | | | | | | | | |
| | | | | | | | | | |
(1)Earnings per share in the table may not recalculate exactly due to rounding because it is calculated based on whole numbers, not the rounded numbers presented.
On October 28, 2025, we declared a quarterly dividend of $0.555 per share of common stock that is payable on November 18, 2025 to stockholders of record as of the close of business on November 7, 2025.
CHENIERE ENERGY, INC. AND SUBSIDIARIES
NOTES TO CONSOLIDATED FINANCIAL STATEMENTS—CONTINUED
(unaudited)
NOTE 14—SHARE REPURCHASE PROGRAMS
The following table presents information with respect to common stock repurchased under our share repurchase program (in millions, except per share data):
| | | | | | | | | | | | | | | | | | | | | | | | | |
| Three Months Ended September 30, | | Nine Months Ended September 30, |
| 2025 | | 2024 | | 2025 | | 2024 | | |
| Total shares repurchased | 4.37 | | | 1.58 | | | 7.37 | | | 12.24 | | | |
| Weighted average price paid per share | $ | 233.14 | | | $ | 178.84 | | | $ | 227.05 | | | $ | 160.96 | | | |
| Total cost of repurchases (1) | $ | 1,018 | | | $ | 282 | | | $ | 1,674 | | | $ | 1,970 | | | |
(1)Amount excludes associated commission fees and excise taxes incurred, which are excluded costs under the repurchase program.
As of September 30, 2025, we had approximately $2.2 billion remaining under our share repurchase program. Our share repurchase program authorization is effective through December 31, 2027.
NOTE 15—SEGMENT INFORMATION AND CUSTOMER CONCENTRATION
We have determined that we operate as a single operating and reportable segment. The measure of profit and loss regularly provided to the chief operating decision maker (“CODM”) that is most consistent with GAAP is net income attributable to Cheniere, as presented in our Consolidated Statements of Operations. This measure contributes to the CODM’s assessment of performance and resource allocation, which includes monitoring of budget versus actual results, establishing compensation and deciding on capital allocation priorities. Significant expenses regularly provided to the CODM, and included in the measure of profit and loss, are cost of sales, operating and maintenance expense and selling, general and administrative expense, as reported in our Consolidated Statements of Operations. Also provided regularly to the CODM are changes in the fair value of our derivative instruments, which are inclusive of significant noncash items, which were $574 million and $506 million in gains for the three months ended September 30, 2025 and 2024, respectively, and $1.5 billion and $826 million in gains for the nine months ended September 30, 2025 and 2024, respectively. Interest income, which is included in interest and dividend income on our Consolidated Statements of Operations, was $23 million and $41 million for the three months ended September 30, 2025 and 2024, respectively, and $88 million and $149 million for the nine months ended September 30, 2025 and 2024, respectively.
The measure of segment assets is reported on our Consolidated Balance Sheets as total assets. Substantially all of our tangible long-lived assets, which consist of property, plant and equipment, are located in the United States. Total expenditures for additions to long-lived assets is reported on our Consolidated Statements of Cash Flows.
The concentration of our customer credit risk in excess of 10% of total revenues and/or trade and other receivables, net of current expected credit losses and contract assets, net of current expected credit losses was as follows:
| | | | | | | | | | | | | | | | | | | | | | | | | | | | | | | | | | | | | | | | |
| | Percentage of Total Revenues from External Customers | | Percentage of Trade and Other Receivables, Net and Contract Assets, Net from External Customers |
| | Three Months Ended September 30, | | Nine Months Ended September 30, | | | | September 30, | | December 31, |
| | 2025 | | 2024 | | 2025 | | 2024 | | | | 2025 | | 2024 |
| | | | | | | | | | | | | | |
| Customer A | | * | | * | | * | | * | | | | 14% | | 20% |
| Customer B | | * | | 10% | | * | | * | | | | * | | * |
| | | | | | | | | | | | | | |
| | | | | | | | | | | | | | |
| | | | | | | | | | | | | | |
| | | | | | | | | | | | | | |
| | | | | | | | | | | | | | |
| | | | | | | | | | | | | | |
| | | | | | | | | | | | | | |
| | | | | | | | | | | | | | |
* Less than 10%
CHENIERE ENERGY, INC. AND SUBSIDIARIES
NOTES TO CONSOLIDATED FINANCIAL STATEMENTS—CONTINUED
(unaudited)
NOTE 16—SUPPLEMENTAL CASH FLOW INFORMATION
The following table provides supplemental disclosure of substantive cash flow information (in millions):
| | | | | | | | | | | | | |
| Nine Months Ended September 30, |
| 2025 | | 2024 | | |
| Cash paid during the period for interest on debt, net of amounts capitalized | $ | 640 | | | $ | 823 | | | |
| Cash paid (refunded) for income taxes, net (1) | 415 | | | (72) | | | |
| Non-cash investing activities: | | | | | |
| Unpaid purchases of property, plant and equipment (2)(3) | 241 | | | 175 | | | |
| | | | | |
| | | | | |
| | | | | |
| | | | | |
| Conveyance of other non-current assets to equity method investee in exchange for infrastructure support | — | | | 34 | | | |
| Non-cash financing activities (2): | | | | | |
| | | | | |
| Unpaid excise tax on stock repurchased | 15 | | | 18 | | | |
| Unpaid repurchase of common stock | 20 | | | — | | | |
| | | | | |
| | | | | |
| | | | | |
(1)Amount for nine months ended September 30, 2025 includes $380 million of previously paid CAMT, which has been recognized as a tax-related receivable as of September 30, 2025. See Note 12—Income Taxes for additional information. (2)Reflects unpaid portion, as of the end of each period, of assets and liabilities recognized during the respective periods.
(3)Net of proceeds not yet collected on commissioning sales of LNG of $8 million and zero, respectively.
See Note 9—Leases for supplemental cash flow information related to our leases.
ITEM 2. MANAGEMENT’S DISCUSSION AND ANALYSIS OF FINANCIAL CONDITION AND RESULTS OF OPERATIONS
Information Regarding Forward-Looking Statements
This quarterly report contains certain statements that are, or may be deemed to be, “forward-looking statements” within the meaning of Section 27A of the Securities Act of 1933, as amended, and Section 21E of the Securities Exchange Act of 1934, as amended (the “Exchange Act”). All statements, other than statements of historical or present facts or conditions, included herein or incorporated herein by reference are “forward-looking statements.” Included among “forward-looking statements” are, among other things:
•statements that we expect to commence or complete construction of our proposed LNG terminals, liquefaction facilities, pipeline facilities or other projects, or any expansions or portions thereof, by certain dates, or at all;
•statements regarding future levels of domestic and international natural gas production, supply or consumption or future levels of LNG imports into or exports from North America and other countries worldwide or purchases of natural gas, regardless of the source of such information, or the transportation or other infrastructure or demand for and prices related to natural gas, LNG or other hydrocarbon products;
•statements regarding any financing transactions or arrangements, or our ability to enter into such transactions;
•statements relating to Cheniere’s capital deployment, including intent, ability, extent and timing of capital expenditures, debt repayment, dividends, share repurchases and execution on the capital allocation plan;
•statements regarding our future sources of liquidity and cash requirements;
•statements relating to the construction of our Trains and pipelines, including statements concerning the engagement of any EPC contractor or other contractor and the anticipated terms and provisions of any agreement with any EPC or other contractor, and anticipated costs related thereto;
•statements regarding any SPA or other agreement to be entered into or performed substantially in the future, including any revenues anticipated to be received and the anticipated timing thereof, and statements regarding the amounts of total LNG regasification, natural gas liquefaction or storage capacities that are, or may become, subject to contracts;
•statements regarding counterparties to our commercial contracts, construction contracts and other contracts;
•statements regarding our planned development and construction of additional Trains or pipelines, including the financing of such Trains or pipelines;
•statements that our Trains, when completed, will have certain characteristics, including amounts of liquefaction capacities;
•statements regarding our business strategy, our strengths, our business and operation plans or any other plans, forecasts, projections, or objectives, including anticipated revenues, capital expenditures, maintenance and operating costs and cash flows, any or all of which are subject to change;
•statements relating to our goals, commitments and strategies in relation to environmental matters;
•statements regarding legislative, governmental, regulatory, administrative or other public body actions, approvals, requirements, permits, applications, filings, investigations, proceedings or decisions;
•statements regarding our anticipated LNG and natural gas marketing activities; and
•any other statements that relate to non-historical or future information.
All of these types of statements, other than statements of historical or present facts or conditions, are forward-looking statements. In some cases, forward-looking statements can be identified by terminology such as “may,” “will,” “could,” “should,” “achieve,” “anticipate,” “believe,” “contemplate,” “continue,” “estimate,” “expect,” “intend,” “plan,” “potential,” “predict,” “project,” “pursue,” “target,” the negative of such terms or other comparable terminology. The forward-looking statements contained in this quarterly report are largely based on our expectations, which reflect estimates and assumptions made by our management. These estimates and assumptions reflect our best judgment based on currently known market conditions and other factors. Although we believe that such estimates are reasonable, they are inherently uncertain and involve a number of risks and uncertainties beyond our control. In addition, assumptions may prove to be inaccurate. We caution that
the forward-looking statements contained in this quarterly report are not guarantees of future performance and that such statements may not be realized or the forward-looking statements or events may not occur. Actual results may differ materially from those anticipated or implied in forward-looking statements as a result of a variety of factors described in this quarterly report and in the other reports and other information that we file with the SEC, including those discussed under “Risk Factors” in our annual report on Form 10-K for the fiscal year ended December 31, 2024 and our quarterly report on Form 10-Q for the quarterly period ended March 31, 2025. All forward-looking statements attributable to us or persons acting on our behalf are expressly qualified in their entirety by these risk factors. These forward-looking statements speak only as of the date made, and other than as required by law, we undertake no obligation to update or revise any forward-looking statement or provide reasons why actual results may differ, whether as a result of new information, future events or otherwise.
Introduction
The following discussion and analysis presents management’s view of our business, financial condition and overall performance and should be read in conjunction with our Consolidated Financial Statements and the accompanying notes. This information is intended to provide investors with an understanding of our past performance, current financial condition and outlook for the future.
Our discussion and analysis includes the following subjects:
Overview
Cheniere, a Delaware corporation, is a Houston-based energy infrastructure company primarily engaged in LNG-related businesses. We provide clean, secure and affordable LNG to integrated energy companies, utilities and energy trading companies around the world. We aspire to conduct our business in a safe and responsible manner, delivering a reliable, competitive and integrated source of LNG to our customers.
LNG is natural gas (primarily methane) in liquid form and is a cleaner dispatchable fuel for power generation. The LNG we produce is shipped all over the world, converted back into natural gas (called “regasification”) and then transported via pipeline to homes and businesses and used as an energy source that is essential for heating, cooking and other industrial uses.
We are the largest producer of LNG in the United States and we were the second largest LNG operator globally, based on the total production capacity of our liquefaction facilities as of September 30, 2025. Our total production capacity is expected to be over 60 mtpa of LNG, inclusive of estimated debottlenecking opportunities, of which over 12 mtpa was under construction and the remainder was in operation as of September 30, 2025, comprised of the following:
•over 30 mtpa of total production capacity in operation from natural gas liquefaction facilities located in Cameron Parish, Louisiana at Sabine Pass (the “SPL Project”). We own and operate the SPL Project and export facility (the “Sabine Pass LNG Terminal”), one of the largest LNG production facilities in the world, through our ownership interest in and management agreements with CQP, which is a publicly traded limited partnership. As of September 30, 2025, we owned 100% of the general partner interest, a 48.6% limited partner interest and 100% of the incentive distribution rights of CQP. The Sabine Pass LNG Terminal also has five LNG storage tanks with aggregate capacity of approximately 17 Bcfe and vaporizers with regasification capacity of approximately 4 Bcf/d, as well as three marine berths, two of which can accommodate vessels with nominal capacity of up to 266,000 cubic meters and the third berth, which can accommodate vessels with nominal capacity of up to 200,000 cubic meters. We also own and operate through CQP a 94-mile natural gas supply pipeline that interconnects the Sabine Pass LNG Terminal with several large interstate and intrastate pipelines (the “Creole Trail Pipeline”).
•over 30 mtpa of total expected production capacity, inclusive of estimated debottlenecking opportunities, including over 12 mtpa under construction and the remainder in operation as of September 30, 2025, from our natural gas liquefaction and export facility located near Corpus Christi, Texas (the “Corpus Christi LNG Terminal”), of which we have 100% ownership interest. The Corpus Christi LNG Terminal also has three LNG storage tanks with aggregate capacity of approximately 10 Bcfe and two marine berths that can each accommodate vessels with nominal capacity of up to 266,000 cubic meters. We also own and operate through CCP an approximately 21-mile natural gas supply pipeline that interconnects the Corpus Christi LNG Terminal with several large interstate and intrastate natural gas pipelines (the “Corpus Christi Pipeline”). The projects under construction at the Corpus Christi LNG Terminal include:
◦a project consisting of seven midscale Trains that is expected to add total production capacity of over 10 mtpa of LNG once fully completed (the “Corpus Christi Stage 3 Project”), with approximately 7 mtpa under construction and the remainder in operation from the first two midscale Trains that have reached substantial completion as of September 30, 2025, (subsequently, in October 2025, the third midscale Train reached substantial completion); and
◦a project consisting of two additional midscale Trains that is expected to add total production capacity of approximately 5 mtpa of LNG once fully completed, inclusive of estimated debottlenecking opportunities (the “CCL Midscale Trains 8 & 9 Project” and together with the existing assets at the Corpus Christi LNG Terminal, the Corpus Christi Stage 3 Project and the Corpus Christi Pipeline, the “CCL Project”), which was under construction as of September 30, 2025. Our board of directors (the “Board”) made a positive FID with respect to the CCL Midscale Trains 8 & 9 Project on June 17, 2025, and issued a full notice to proceed with construction to Bechtel Energy Inc. (“Bechtel”) effective June 18, 2025. Non-FTA export authorization on the CCL Midscale Trains 8 & 9 Project is pending with the DOE.
Our long-term counterparty arrangements form the foundation of our business and provide us with significant, stable, long-term cash flows, and include SPAs, in which our customers are generally required to pay a fixed fee with respect to the contracted volumes irrespective of their election to cancel or suspend deliveries of LNG cargoes, and IPM agreements, in which a gas producer sells natural gas to us on a global LNG or natural gas index price, less a fixed liquefaction fee, shipping and other costs. The SPAs also have a variable fee component, which is primarily indexed to Henry Hub and generally structured to cover the cost of natural gas purchases, transportation and liquefaction fuel consumed to produce LNG. Since we procure most of our feedstock for LNG production from the U.S., the structure of these contracts helps limit our exposure to fluctuations in U.S. natural gas prices. Through our SPAs and IPM agreements currently in effect, with approximately 15 years of weighted average remaining life as of September 30, 2025, we have contracted approximately 90% of the total anticipated production from the CCL Project and the SPL Project (collectively, the “Liquefaction Projects”) through the mid-2030s, excluding volumes from contracts with terms less than 10 years and volumes that are contractually subject to additional liquefaction capacity beyond what is currently in construction or operation. LNG produced by the Liquefaction Projects that is not contracted under long-term contracts is available for Cheniere Marketing, our integrated marketing function, to sell in the global market under spot sales or other short-term agreements.
Disciplined Accretive Growth
We remain focused on safety, operational excellence and customer satisfaction. Increasing demand for LNG has allowed us to expand our liquefaction infrastructure in a financially disciplined manner. Our capital allocation plan is designed, in part, to invest in financially disciplined growth accretive to our common stock. Capital investment parameters are the foundation of our disciplined, accretive growth, and include consideration to:
•Achieve value accretive returns through long-term commercial contracts: We aim to contract approximately 90% of our current and planned liquefaction capacity under long-term SPAs and IPM agreements with creditworthy counterparties under the pricing structures described above, with financial parameters that consider, among other things, targeted unlevered returns that exceed our cost of equity and return on stock at prevailing stock prices and project leverage.
•Achieve credit accretive returns: We aim to conservatively fund our projects through financing structures that sustain our long-term, run-rate leverage and credit metrics.
We have increased available liquefaction capacity at our Liquefaction Projects as a result of debottlenecking and other optimization projects. We believe these factors provide a foundation for additional growth in our portfolio of customer contracts in the future. We hold significant land positions at both the Sabine Pass LNG Terminal and the Corpus Christi LNG Terminal, which provide opportunity for further liquefaction capacity expansion. We are developing an expansion adjacent to the SPL Project with an expected total peak production capacity of up to approximately 20 mtpa of LNG, inclusive of estimated debottlenecking opportunities, and supporting infrastructure (the “SPL Expansion Project”), and we are commercializing to support the additional liquefaction capacity associated with this project. This project and any future expansions at our sites require, among other things, regulatory approvals and acceptable commercial and financing arrangements before we make a positive FID. Risks associated with cost overruns and delays in the completion of our expansion projects are described in the risk factors of our annual report on Form 10-K for the fiscal year ended December 31, 2024 and our quarterly report on Form 10-Q for the quarterly period ended March 31, 2025.
The following table summarizes pre-FID development efforts and certain key milestones associated with the SPL Expansion Project:
| | | | | | | | | | | | | | | |
| | | | | SPL Expansion Project | | |
| Expected total peak production capacity of LNG (1) | | | | Up to ~ 20 mtpa | | |
| | | | | | | |
| Milestone | | | | | | |
| Regulatory (2) | FERC authorizations: | | | | | | |
| Positive environmental assessment | | | | Pending | | |
| Order under Section 3 of NGA | | | | Pending | | |
| Certification to commence construction (3) | | | | | | |
| DOE export authorization: | | | | | | |
| FTA countries | | | | ü | | |
| Non-FTA countries | | | | Pending | | |
| | | | | | | |
| Financing | Financing (4) | | | | | | |
| | | | | | | |
| Commercialization and Other Contracting | Definitive commercial agreements (5) | | | | In process | | |
| Definitive full-scope EPC contract | | | | | | |
| | | | | | | |
| Critical Milestone | Target FID (6) | | | | 2026/2027 | | |
ü indicates receipt of authorization, subject to ongoing conditionality
(1)Anticipated based on capacity, scale, location and infrastructure. Subject to regulatory review and approval and may change based on design considerations, engagement with contractors and other factors. Subject to adjustment for planned maintenance, production reliability, potential overdesign and debottlenecking opportunities.
(2)Our activities, including our expansion activities, are highly regulated and require regulatory approvals at various stages, including approvals of the FERC and DOE under Sections 3 and 7 of the NGA, as well as several other material governmental and regulatory approvals and permits. The progression of our expansion projects is dependent on receiving all regulatory approvals required within the respective stages. See our annual report on Form 10-K for the fiscal year ended December 31, 2024 and our quarterly report on Form 10-Q for the quarterly period ended March 31, 2025 for further discussion of the regulations under federal, state and local statutes, rules, regulations and laws to which we are subject and associated risk factors relating to regulations.
(3)Based on letter from the FERC granting our request to commence with site preparation. The FERC orders require us to comply with certain ongoing conditions and obtain certain additional FERC and other regulatory agency approvals as construction progresses.
(4)We anticipate drawing on current committed facilities and/or incurring additional debt to finance the construction of the SPL Expansion Project, if we reach a positive FID.
(5)Liquefaction capacity partially contracted by Cheniere Marketing and SPL Stage V through SPA or IPM agreements conditioned on additional liquefaction capacity beyond what is currently in construction or operation.
(6)Expected to be subject to phased FID. Any positive FID is subject to achievement of or consideration to relevant milestones and capital investment parameters described herein.
We have excluded from the table above a potential further expansion of the CCL Project with an expected total peak production capacity of up to 24 mtpa of LNG, inclusive of estimated debottlenecking opportunities, and supporting infrastructure (the “CCL Stage 4 Expansion Project”), for which we commenced the pre-filing process with the FERC in July 2025, as none of the milestones within the table have yet been achieved.
Overview of Significant Events
Our significant events since January 1, 2025 and through the filing date of this Form 10-Q include the following:
Strategic
•In August 2025, Cheniere announced the execution of a long-term LNG SPA between Cheniere Marketing and JERA Co., Inc. (“JERA”), under which JERA has agreed to purchase approximately 1 mtpa of LNG from Cheniere Marketing on an FOB basis from 2029 through 2050. The purchase price for LNG under the SPA is indexed to the Henry Hub price, plus a fixed liquefaction fee.
•In July 2025, we submitted a request to initiate the pre-filing review process with the FERC under the National Environmental Policy Act for the CCL Stage 4 Expansion Project, a potential further expansion of the Corpus Christi LNG Terminal with an expected total peak production capacity of up to 24 mtpa of LNG, inclusive of estimated debottlenecking opportunities.
•In June 2025, our Board made a positive FID with respect to the investment in the development, construction and operation of the CCL Midscale Trains 8 & 9 Project and issued a full notice to proceed with construction to Bechtel under a fixed price separated turnkey EPC contract.
•In June 2025, certain subsidiaries of CQP updated the SPL Expansion Project’s FERC application, originally filed in February 2024, to reflect a two-phased project, inclusive of three liquefaction trains and supporting infrastructure, maintaining an expected total peak production capacity of up to approximately 20 mtpa of LNG, inclusive of estimated debottlenecking opportunities.
•In May 2025, Cheniere Marketing entered into an IPM agreement with Canadian Natural Resources Limited to purchase 140,000 MMBtu per day of natural gas at a price based on the Japan Korea Marker, less fixed LNG shipping costs and a fixed liquefaction fee, for a term of approximately 15 years commencing in approximately 2030. This agreement is subject to us making a positive FID with respect to the SPL Expansion Project or unilaterally waiving such condition.
•In March 2025, we received authorization from the FERC under the NGA to site, construct and operate the CCL Midscale Trains 8 & 9 Project.
Operational
•As of October 24, 2025, over 4,370 cumulative LNG cargoes totaling over 300 million tonnes of LNG have been produced, loaded and exported from the Liquefaction Projects.
•In March and August 2025, substantial completions of Trains 1 and 2, respectively, of the Corpus Christi Stage 3 Project were achieved. Subsequently in October 2025, Train 3 of the Corpus Christi Stage 3 Project achieved substantial completion.
Financial
•In August 2025, we amended and restated our $1.25 billion Cheniere Revolving Credit Facility to, among other things, (1) extend the maturity date thereunder, (2) reduce the interest rate and commitment fees payable thereunder and (3) make certain other changes to the terms and conditions of the existing Cheniere Revolving Credit Facility.
•In July 2025, CQP issued and sold $1.0 billion aggregate principal amount of 5.550% Senior Notes due 2035 (the “2035 CQP Senior Notes”), and the net proceeds, together with cash on hand, were used to redeem $1.0 billion of the aggregate principal amount of SPL’s 5.875% Senior Secured Notes due 2026 (the “2026 SPL Senior Notes”).
•In June 2025, we announced updates to our company outlook, which included a plan to increase our annualized dividend by over 10% to $2.22 per common share commencing with the third quarter of 2025, subject to declaration by the Board.
•In February 2025, Fitch Ratings upgraded the issuer credit rating of both Cheniere and CQP to BBB from BBB- with a stable outlook. In June 2025, S&P Global Ratings concurrently assigned a BBB rating to the 2035 CQP Senior Notes and upgraded the remaining unsecured CQP notes to BBB from BBB-.
•During the three and nine months ended September 30, 2025, we accomplished the following pursuant to our capital allocation priorities:
◦We repurchased approximately 4.4 million and 7.4 million shares of our common stock, respectively, as part of our share repurchase program for approximately $1.0 billion and $1.7 billion, respectively.
◦In September 2025, SPL repaid $52 million aggregate principal amount outstanding of its series of senior secured notes due 2037 with a weighted average interest rate of 4.746%, based on their respective fixed amortization schedules.
◦In March 2025, SPL repaid the remaining $300 million aggregate principal amount outstanding of its 5.625% Senior Secured Notes due 2025 (the “2025 SPL Senior Notes”) at maturity.
◦We paid dividends of $0.500 and $1.500 per share of common stock, respectively.
◦We continued to invest in accretive organic growth, including our investments in the Corpus Christi Stage 3 Project and the CCL Midscale Trains 8 & 9 Project, as further described under Investing Cash Flows in Sources and Uses of Cash within Liquidity and Capital Resources.
Results of Operations
Consolidated results of operations
| | | | | | | | | | | | | | | | | | | | | | | | | | | | | | | | | | | |
| Three Months Ended September 30, | | | | Nine Months Ended September 30, | | |
| (in millions, except per share data) | 2025 | | 2024 | | Variance | | 2025 | | 2024 | | Variance |
| Revenues | | | | | | | | | | | |
| LNG revenues | $ | 4,302 | | | $ | 3,554 | | | $ | 748 | | | $ | 14,122 | | | $ | 10,633 | | | $ | 3,489 | |
| Regasification revenues | 34 | | | 34 | | | — | | | 102 | | | 102 | | | — | |
| Other revenues | 105 | | | 175 | | | (70) | | | 302 | | | 532 | | | (230) | |
| | | | | | | | | | | |
| Total revenues | 4,441 | | | 3,763 | | | 678 | | | 14,526 | | | 11,267 | | | 3,259 | |
| | | | | | | | | | | |
| Operating costs and expenses | | | | | | | | | | | |
| Cost of sales (excluding operating and maintenance expense and depreciation, amortization and accretion expense shown separately below) | 1,750 | | | 1,255 | | | 495 | | | 6,438 | | | 4,275 | | | 2,163 | |
| | | | | | | | | | | |
| Operating and maintenance expense | 447 | | | 450 | | | (3) | | | 1,479 | | | 1,364 | | | 115 | |
| Selling, general and administrative expense | 81 | | | 99 | | | (18) | | | 296 | | | 299 | | | (3) | |
| Depreciation, amortization and accretion expense | 338 | | | 306 | | | 32 | | | 979 | | | 912 | | | 67 | |
| | | | | | | | | | | |
| | | | | | | | | | | |
| | | | | | | | | | | |
| Other operating costs and expenses | 8 | | | 6 | | | 2 | | | 26 | | | 28 | | | (2) | |
| | | | | | | | | | | |
| Total operating costs and expenses | 2,624 | | | 2,116 | | | 508 | | | 9,218 | | | 6,878 | | | 2,340 | |
| | | | | | | | | | | |
| Income from operations | 1,817 | | | 1,647 | | | 170 | | | 5,308 | | | 4,389 | | | 919 | |
| | | | | | | | | | | |
| Other income (expense) | | | | | | | | | | | |
| Interest expense, net of capitalized interest | (236) | | | (247) | | | 11 | | | (702) | | | (770) | | | 68 | |
| Loss on modification or extinguishment of debt | (7) | | | — | | | (7) | | | (7) | | | (9) | | | 2 | |
| | | | | | | | | | | |
| Interest and dividend income | 23 | | | 41 | | | (18) | | | 91 | | | 149 | | | (58) | |
| Other income (expense), net | 2 | | | (3) | | | 5 | | | 21 | | | (1) | | | 22 | |
| Total other expense | (218) | | | (209) | | | (9) | | | (597) | | | (631) | | | 34 | |
| | | | | | | | | | | |
Income before income taxes and NCI | 1,599 | | | 1,438 | | | 161 | | | 4,711 | | | 3,758 | | | 953 | |
| Less: income tax provision | 303 | | | 231 | | | 72 | | | 850 | | | 550 | | | 300 | |
| Net income | 1,296 | | | 1,207 | | | 89 | | | 3,861 | | | 3,208 | | | 653 | |
| Less: net income attributable to NCI | 247 | | | 314 | | | (67) | | | 833 | | | 933 | | | (100) | |
| Net income attributable to Cheniere | $ | 1,049 | | | $ | 893 | | | $ | 156 | | | $ | 3,028 | | | $ | 2,275 | | | $ | 753 | |
| | | | | | | | | | | |
Net income per share attributable to common stockholders—basic | $ | 4.76 | | | $ | 3.95 | | | $ | 0.81 | | | $ | 13.63 | | | $ | 9.91 | | | $ | 3.72 | |
Net income per share attributable to common stockholders—diluted | $ | 4.75 | | | $ | 3.93 | | | $ | 0.82 | | | $ | 13.59 | | | $ | 9.88 | | | $ | 3.71 | |
Volumes loaded and recognized from the Liquefaction Projects
| | | | | | | | | | | | | | | | | | | | | | | | | | | | | | | | | | | | | | |
| | |
| | Three Months Ended September 30, 2025 | | Nine Months Ended September 30, 2025 |
| (in TBtu) | | Operational | | Commissioning | | Total | | Operational | | Commissioning | | Total |
| Volumes loaded during the current period | | 579 | | | 7 | | | 586 | | | 1,731 | | | 13 | | | 1,744 | |
| Volumes loaded during the prior period but recognized during the current period | | 32 | | | — | | | 32 | | | 39 | | | — | | | 39 | |
| Less: volumes loaded during the current period and in transit at the end of the period | | (30) | | | (1) | | | (31) | | | (30) | | | (1) | | | (31) | |
| Total volumes recognized in the current period | | 581 | | | 6 | | | 587 | | | 1,740 | | | 12 | | | 1,752 | |
Components of LNG revenues and corresponding LNG volumes delivered
| | | | | | | | | | | | | | | | | | | | | | | | | | | | | | | | | | | |
| Three Months Ended September 30, | | | | Nine Months Ended September 30, | | |
| | 2025 | | 2024 | | Variance | | 2025 | | 2024 | | Variance |
LNG revenues (in millions): | | | | | | | | | | | |
LNG from the Liquefaction Projects sold under third party long-term agreements (1) | $ | 3,481 | | | $ | 2,903 | | | $ | 578 | | | $ | 10,824 | | | $ | 8,701 | | | $ | 2,123 | |
LNG from the Liquefaction Projects sold by our integrated marketing function under short-term agreements (2) | 630 | | | 565 | | | 65 | | | 2,593 | | | 1,587 | | | 1,006 | |
| LNG procured from third parties (2) | 38 | | | 49 | | | (11) | | | 188 | | | 168 | | | 20 | |
| | | | | | | | | | | |
Net derivative gain (loss) | 102 | | | (15) | | | 117 | | | 320 | | | 19 | | | 301 | |
| Other revenues | 51 | | | 52 | | | (1) | | | 197 | | | 158 | | | 39 | |
| Total LNG revenues | $ | 4,302 | | | $ | 3,554 | | | $ | 748 | | | $ | 14,122 | | | $ | 10,633 | | | $ | 3,489 | |
| | | | | | | | | | | |
Volumes delivered as LNG revenues (in TBtu): | | | | | | | | | | | |
LNG from the Liquefaction Projects sold under third party long-term agreements (1) | 525 | | | 511 | | | 14 | | | 1,537 | | | 1,573 | | | (36) | |
LNG from the Liquefaction Projects sold by our integrated marketing function under short-term agreements (2) | 56 | | | 49 | | | 7 | | | 203 | | | 147 | | | 56 | |
| LNG procured from third parties (2) | 3 | | | 3 | | | — | | | 18 | | | 14 | | | 4 | |
| Total volumes delivered as LNG revenues | 584 | | | 563 | | | 21 | | | 1,758 | | | 1,734 | | | 24 | |
| | | | | | | | | | | |
| | | | | | | | | | | |
(1)Long-term agreements include agreements with an initial tenor of 12 months or more.
(2)Includes volumes sold under short-term agreements and volumes sold from natural gas procured under IPM agreements.
Net income attributable to Cheniere
Net income attributable to Cheniere increased $156 million and $753 million for the three and nine months ended September 30, 2025, respectively, as compared to the same periods of 2024, primarily due to:
•$69 million and $665 million, respectively, of favorable changes in the fair value of agreements accounted for as derivative instruments (before tax and the impact of NCI), largely due to changes in market-based locational forward price differentials for North American natural gas deliveries, which impacted our natural gas supply derivatives, and incrementally for the comparable nine month periods due to the impact of declines in short-term global gas prices and volatility within our derivatives related to financial positions to economically hedge the purchase and sale of physical LNG and our derivatives related to IPM agreements, respectively; and
•$183 million and $661 million of increases, respectively, in LNG revenues, net of cost of sales and excluding changes in fair value of derivatives, primarily as a result of higher pricing per MMBtu between the comparable nine month periods including the effect of settlement of previously entered derivative instruments, as well as increased
production volume due to the substantial completions of Trains 1 and 2 of the Corpus Christi Stage 3 Project in March 2025 and August 2025, respectively.
Partially offsetting these favorable changes between the comparable three and nine month periods were increased tax provisions of $72 million and $300 million, respectively, as further explained under the caption Income tax provision below, decreased sublease and subcharter income from our LNG vessels of $63 million and $207 million, respectively, due to fewer days the LNG vessels were subcontracted out and at lower rates in the current periods as compared to the same periods of 2024 and increased operating and maintenance expenses of $115 million between the comparable nine month periods primarily due to the completion of planned large-scale maintenance activities on two trains at the SPL Project.
The following is an expanded discussion of the significant drivers of the variance in net income attributable to Cheniere by line item:
Revenues
The $678 million and $3.3 billion increases in revenues between the three and nine months ended September 30, 2025, respectively, as compared to the same periods of 2024, were primarily attributable to:
•$482 million and $2.7 billion increases, respectively, due to higher pricing per MMBtu primarily from increased Henry Hub pricing, to which the majority of our long-term LNG sales contracts are indexed;
•$117 million and $301 million of gains, respectively, from agreements accounted for as derivative instruments included in revenues of which the gain between the three month periods was primarily attributable to the effect of settlement of previously entered derivative instruments and the gain between the nine month periods was primarily derived from a favorable change in fair value, as further described above under the caption Net income attributable to Cheniere; and
•$149 million and $497 million increases, respectively, due to higher volumes of LNG delivered between the periods, primarily as a result of increased production volume due to the substantial completions of Trains 1 and 2 of the Corpus Christi Stage 3 Project in March 2025 and August 2025, respectively.
These favorable variances were partially offset by $63 million and $207 million decreases in sublease and subcharter income from our LNG vessels between the comparable three and nine month periods, respectively, due to fewer days the LNG vessels were subcontracted out and at lower rates in the current year as compared to the same periods of 2024.
Operating costs and expenses
The $508 million and $2.3 billion unfavorable variances between the three and nine months ended September 30, 2025, respectively, as compared to the same periods of 2024, were primarily attributable to:
•$580 million and $2.6 billion increases, respectively, in cost of sales excluding the effect of derivative changes, substantially all related to the increases in cost of natural gas feedstock, largely due to the increase in U.S. natural gas prices as further described under the caption Revenues;
•$115 million increase in operating and maintenance expense between the comparable nine month periods, primarily due to the completion of planned large-scale maintenance activities on two trains at the SPL Project and additional expenses from the substantial completions of Trains 1 and 2 of the Corpus Christi Stage 3 Project in March 2025 and August 2025, respectively; and
•$32 million and $67 million increases, respectively, in depreciation, amortization and accretion expense, primarily as a result of substantial completions of Trains 1 and 2 of the Corpus Christi Stage 3 Project.
These unfavorable variances were partially offset by $92 million and $419 million of favorable changes in fair value of agreements accounted for as derivative instruments included in cost of sales between the comparable three and nine month periods, respectively, with the primary drivers of the variance described above under the caption Net income attributable to Cheniere.
Other income (expense)
The $9 million unfavorable variance between the three months ended September 30, 2025 and 2024 and the $34 million favorable variance between the nine months ended September 30, 2025 and 2024 were primarily attributable to:
•$11 million and $68 million decreases in interest expense, net of capitalized interest, between the comparable three and nine month periods, respectively, due to $8 million and $38 million increases, respectively, in capitalized interest costs, given the higher carrying value of assets under construction and additionally due to $3 million and $30 million lower gross interest costs, respectively, due to debt reduction activities associated with our long-term capital allocation plan; and
•$22 million increase in other income, net, between the comparable nine month periods primarily from a $26 million gain recognized on the sale of our equity interests in an equity method investment during the three months ended March 31, 2025.
These favorable variances were partially offset by $18 million and $58 million decreases in interest and dividend income between the comparable three and nine month periods, respectively, as a result of decreased interest rates and lower average cash and cash equivalents balances between the periods.
Income tax provision
The $72 million and $300 million unfavorable variances between the three and nine months ended September 30, 2025, respectively, as compared to the same periods of 2024, were primarily attributable to increases in our effective tax rate, as described below, as well as a higher income tax expense due to $161 million and $953 million increases in pre-tax income, respectively.
Our effective tax rate was 18.9% and 18.0% for the three and nine months ended September 30, 2025, respectively, as compared to 16.1% and 14.6% for the same periods of 2024, respectively. Our effective tax rate increased between the comparable periods primarily due to a decreased proportion of our pre-tax income attributable to CQP, which is partially not taxable to us, and a reduced Foreign Derived Intangible Income (“FDII”) deduction. Additionally contributing to the unfavorable variance in our effective tax rate between the comparable nine month periods was an increased tax expense due to a valuation allowance on a capital loss carryover generated on the sale of all of our equity interests in an equity method investment during the three months ended March 31, 2025, as discussed above under the caption Other income (expense). The effective tax rate for the comparable three and nine month periods was lower than the statutory rate of 21.0% primarily due to CQP’s income that is partially not taxable to us.
On July 4, 2025, the One Big Beautiful Bill Act (“OBBBA”) was signed into law with significant changes to the Internal Revenue Code that impact us, including, among other provisions, reinstating 100% accelerated tax bonus depreciation on qualifying assets acquired after January 19, 2025 and modifying the export-promoting FDII deduction rules, renamed to the Foreign Derived Deduction Eligible Income (“FDDEI”) under the OBBBA beginning in 2026.
We initially applied the relevant and effective provisions of the OBBBA in the third quarter of 2025, including provisions related to bonus depreciation. The legislation did not have a material impact on our income tax expense for the three months ended September 30, 2025, and we do not expect it to materially change our effective income tax rate for 2025. However, the 100% bonus depreciation provision under the OBBBA is expected to defer our tax liability, ultimately reducing our 2025 income taxes payable to a nominal amount, primarily due to the accelerated tax deduction on qualifying Corpus Christi Stage 3 Project assets.
Commencing with its effectiveness in 2026, we expect that the FDDEI regime will favorably impact our effective tax rate relative to prior policy, as a larger portion of our export-related income is projected to be eligible for a preferential tax rate despite an increase in the tax rate on qualifying sales. The FDDEI regime provides for an effective tax rate of 14%, a rate lower than the statutory corporate tax rate of 21%, on eligible sales of property or services to a foreign person for foreign use. Relative to the prior FDII tax provision, the FDDEI regime increases the effective tax rate on eligible sales but broadens qualifying income by eliminating certain asset-based eligibility constraints and removing the requirement to reduce eligible income by specified allocable expenses.
On September 30, 2025, the Internal Revenue Service (the “IRS”) issued Notice 2025-49 which includes, among other provisions, revised interim rules for calculating CAMT adjusted financial statement income, including rules allowing us to utilize and benefit from our existing net operating loss carryovers for both CAMT and regular tax in the same period. As a result, our cash tax obligations have been deferred and we are entitled to a refund of $380 million of previously paid CAMT, which has been recognized as a tax-related receivable as of September 30, 2025.
Net income attributable to non-controlling interests
The $67 million and $100 million decreases between the three and nine months ended September 30, 2025, respectively, as compared to the same periods of 2024, were primarily attributable to $129 million and $187 million decreases in CQP’s consolidated net income, respectively, primarily from unfavorable changes in fair value of agreements accounted for as derivative instruments.
Significant factors affecting our results of operations
Below are significant factors that affect our results of operations.
Gains and losses on derivative instruments
Derivative instruments, which we use to manage certain risks, are reported at fair value in our Consolidated Financial Statements. For commodity derivative instruments, including those related to our IPM agreements, the underlying LNG sales being economically hedged are accounted for under the accrual method of accounting, whereby revenues expected to be derived from the future LNG sales are recognized only upon delivery or realization of the underlying transaction. Notwithstanding the operational intent to mitigate risk exposure over time, the recognition of derivative instruments at fair value has the effect of recognizing gains or losses relating to future period exposure, and given the significant volumes, long-term duration and volatility in price basis for certain of our derivative contracts, the use of derivative instruments may result in continued volatility of our results of operations based on changes in market pricing, counterparty credit risk and other relevant factors that may be outside of our control. For example, as described in Note 5—Derivative Instruments of our Notes to Consolidated Financial Statements, the fair value of the Liquefaction Supply Derivatives incorporates, as applicable, market participant-based assumptions pertaining to certain contractual uncertainties, including those related to the availability of market information for delivery points, which may require future development of infrastructure, as well as the timing of satisfaction of certain events or development of infrastructure to support natural gas gathering and transport. We may recognize changes in fair value through earnings that could significantly impact our results of operations if and when such uncertainties are resolved.
Commissioning volumes
Prior to substantial completion of a Train, amounts received from the sale of commissioning volumes from that Train are offset against LNG terminal construction-in-process, because these amounts are earned or loaded during the testing phase for the construction of that Train and are necessary activities to bring the asset to the condition for its intended use. During the three and nine months ended September 30, 2025, we realized offsets to LNG terminal costs of $47 million and $102 million, respectively, corresponding to 6 TBtu and 12 TBtu, respectively, of LNG that were related to the sale of commissioning volumes. We did not record any offsets to LNG terminal costs during the three and nine months ended September 30, 2024.
Business Seasonality
Our quarterly results are affected by production levels, timing of our maintenance activities and the resulting availability of volumes. Therefore, operating profit may not be generated evenly throughout the year. Weather variations, including temperature, have an impact on LNG output at our Liquefaction Projects. Our Liquefaction Projects are capable of relatively higher production volumes during the cooler months as compared to the summer months. We typically perform our scheduled major maintenance activities at our sites during shoulder months in the second and third quarters in order to mitigate the impact to our annual operating results.
Additional liquefaction capacities
The Corpus Christi Stage 3 Project and CCL Midscale Trains 8 & 9 Project are currently under construction and are expected to add over 15 mtpa of operational liquefaction capacity, inclusive of estimated debottlenecking opportunities, once all
Trains reach substantial completion, of which over 12 mtpa is still under construction or commissioning as of September 30, 2025. As of September 30, 2025, substantial completions for the first two Trains of the Corpus Christi Stage 3 Project have been achieved, and subsequently in October 2025, substantial completion for the third Train of the Corpus Christi Stage 3 Project was achieved. The operation and maintenance of these Trains and increased LNG volumes produced are expected to result in higher revenues and operating costs and expenses. However, prior to the commencement of long-term SPAs associated with these volumes, the additional volumes will be sold by our integrated marketing function at prevailing market prices. Additionally, potential expansion projects that increase the amount of LNG volumes produced, including those discussed above in Disciplined Accretive Growth, would also be expected to result in higher revenues and operating costs and expenses.
Liquidity and Capital Resources
The following information describes our ability to generate and obtain adequate amounts of cash to meet our requirements in the short term and the long term. In the short term, we expect to meet our cash requirements using operating cash flows and available liquidity, consisting of cash and cash equivalents, restricted cash and cash equivalents and available commitments under our credit facilities. Additionally, we expect to meet our long term cash requirements by using operating cash flows and other future potential sources of liquidity, which may include debt and equity offerings by us or our subsidiaries.
The table below provides a summary of our available liquidity (in millions). Future material sources of liquidity are discussed below.
| | | | | |
| September 30, 2025 |
| Cash and cash equivalents (1) | $ | 1,075 | |
| |
| |
| |
| |
| |
| |
| |
| Restricted cash and cash equivalents (1) | 323 | |
| Available commitments under our credit facilities (2): | |
| |
SPL Revolving Credit Facility | 815 | |
CQP Revolving Credit Facility | 1,000 | |
| |
CCH Credit Facility | 3,260 | |
CCH Working Capital Facility | 1,390 | |
Cheniere Revolving Credit Facility | 1,250 | |
| |
| Total available commitments under our credit facilities | 7,715 | |
| |
| Total available liquidity | $ | 9,113 | |
(1)Amounts presented include balances held by our consolidated variable interest entities (“VIEs”), as discussed in Note 6—Non-Controlling Interests and Variable Interest Entities of our Notes to Consolidated Financial Statements. As of September 30, 2025, assets of our VIEs, which are included in our Consolidated Balance Sheets, included $121 million of cash and cash equivalents and $61 million of restricted cash and cash equivalents. (2)Available commitments represent total commitments less loans outstanding and letters of credit issued under each of our credit facilities as of September 30, 2025. See Note 8—Debt of our Notes to Consolidated Financial Statements for additional information on our credit facilities and other debt instruments.
Our liquidity position subsequent to September 30, 2025 will be driven by future sources of liquidity and future cash requirements. For a discussion of our future sources and uses of liquidity, see the liquidity and capital resources disclosures in Item 7. Management’s Discussion and Analysis of Financial Condition and Results of Operations in our annual report on Form 10-K for the fiscal year ended December 31, 2024.
Although our sources and uses of cash are presented below from a consolidated standpoint, SPL, CQP, CCH and Cheniere operate with independent capital structures. Certain restrictions or requirements under debt and equity instruments executed by our subsidiaries limit the entity’s use of cash, including the following:
•SPL and CCH are required to deposit all cash received into restricted cash and cash equivalents accounts under certain of their debt agreements. The usage or withdrawal of such cash is restricted to the payment of liabilities related to the Liquefaction Projects and other restricted payments. In addition, SPL and CCH’s operating costs are managed by our subsidiaries under affiliate agreements, which may require SPL and CCH to advance cash to the respective affiliates, however the cash remains restricted for operation and construction of the Liquefaction Projects;
•CQP is required under its partnership agreement to distribute to unitholders all available cash on hand at the end of a quarter less the amount of any reserves established by its general partner. Quarterly distributions by CQP are currently comprised of a base amount plus a variable amount equal to the remaining available cash per unit, which takes into consideration, among other things, amounts reserved for annual debt repayment and capital allocation goals, anticipated capital expenditures to be funded with cash, and cash reserves to provide for the proper conduct of CQP’s business;
•Our 48.6% limited partner interest, 100% general partner interest and incentive distribution rights in CQP limit our right to receive cash held by CQP to the amounts specified by the provisions of CQP’s partnership agreement; and
•SPL and CCH are restricted by affirmative and negative covenants included in certain of their debt agreements in their ability to make certain payments, including distributions, unless specific requirements are satisfied.
Despite the restrictions noted above, we believe that sufficient flexibility exists within the Cheniere complex to enable each independent capital structure to meet its currently anticipated cash requirements. The sources of liquidity at SPL, CQP and CCH primarily fund the cash requirements of the respective entity, and any remaining liquidity not subject to restriction, as supplemented by liquidity provided by Cheniere Marketing, is available to enable Cheniere to meet its cash requirements.
Corpus Christi LNG Terminal Expansion
As of September 30, 2025, substantial completions of the first two of seven midscale Trains of the Corpus Christi Stage 3 Project were achieved. Additionally, in June 2025, our Board made a positive FID with respect to the CCL Midscale Trains 8 & 9 Project and issued a full notice to proceed with construction to Bechtel under an EPC contract for a contract price of approximately $2.9 billion, subject to adjustment only by change order.
The following table summarizes the project completion and construction status of both the Corpus Christi Stage 3 Project and the CCL Midscale Trains 8 & 9 Project as of September 30, 2025:
| | | | | | | | | | | | | | |
| | Corpus Christi Stage 3 Project | | CCL Midscale Trains 8 & 9 Project |
| Overall project completion percentage | | 90.5% | | 21.2% |
| Completion percentage of: | | | | |
| Engineering | | 99.4% | | 57.6% |
| Procurement | | 100.0% | | 33.4% |
| Subcontract work | | 93.3% | | 3.6% |
| Construction | | 75.0% | | 0.0% |
| Date of expected substantial completion of remaining Trains | | 2H 2025 - 2H 2026 (1) | | 2H 2028 |
(1)In October 2025, substantial completion of Train 3 of the Corpus Christi Stage 3 Project was achieved.
Sources and Uses of Cash
The following table summarizes the sources and uses of our cash, cash equivalents and restricted cash and cash equivalents (in millions). The table presents capital expenditures on a cash basis; therefore, these amounts differ from the amounts of capital expenditures, including accruals, which are referred to elsewhere in this report. Additional discussion of these items follows the table.
| | | | | | | | | | | | | |
| Nine Months Ended September 30, |
| 2025 | | 2024 | | |
| | | | | |
| Net cash provided by operating activities | $ | 3,484 | | | $ | 3,753 | | | |
| Net cash used in investing activities | (2,263) | | | (1,706) | | | |
| Net cash used in financing activities | (3,010) | | | (3,493) | | | |
| Effect of exchange rate changes on cash, cash equivalents and restricted cash and cash equivalents | (3) | | | (3) | | | |
| | | | | |
| | | | | |
| | | | | |
| | | | | |
| | | | | |
| | | | | |
| | | | | |
| | | | | |
| | | | | |
| | | | | |
| | | | | |
| | | | | |
| | | | | |
| | | | | |
| | | | | |
| | | | | |
| | | | | |
Net decrease in cash, cash equivalents and restricted cash and cash equivalents | $ | (1,792) | | | $ | (1,449) | | | |
| | | | | |
| | | | | |
Operating Cash Flows
The $269 million decrease between the periods was primarily related to lower cash flows attributed to working capital from differences in timing of payments to suppliers and cash collections from the sale of LNG cargoes, partially offset by higher net cash inflows from LNG sales, as explained above in Results of Operations, and increased cash inflows from settlement of derivative instruments.
As described in Results of Operations, the OBBBA was signed into law during the third quarter of 2025 and includes, among other provisions, reinstating 100% accelerated tax bonus depreciation on qualifying assets acquired after January 19, 2025, which is expected to defer our income tax liability, ultimately reducing our income tax payable to a nominal amount in 2025, and modifying the export-promoting FDII deduction rules, renamed to the FDDEI under the OBBBA, which is expected to reduce our income taxes payable relative to prior policy in future periods. Additionally, the IRS issued Notice 2025-49, which revised rules for calculating CAMT adjusted financial statement income, deferring our tax obligations and entitling us to a refund of $380 million of previously paid CAMT.
Investing Cash Flows
Our investing net cash outflows primarily related to: (1) construction costs for the Corpus Christi Stage 3 Project, which were $1.1 billion and $1.3 billion during the nine months ended September 30, 2025 and 2024, respectively; (2) $750 million of costs paid for the CCL Midscale Trains 8 & 9 Project during the nine months ended September 30, 2025, primarily related to procurement and engineering; and (3) optimization and other site improvement projects during both periods. The $0.2 billion decrease in construction costs for the Corpus Christi Stage 3 Project between the periods was primarily related to the timing of cash payments under the related EPC contract. We expect to continue to incur capital expenditures for the Corpus Christi Stage 3 Project and the CCL Midscale Trains 8 & 9 Project as construction progresses on these projects.
Financing Cash Flows
The following table summarizes our financing activities (in millions):
| | | | | | | | | | | | | | |
| | Nine Months Ended September 30, |
| | 2025 | | 2024 |
| Proceeds from issuances of debt and borrowings | | $ | 1,262 | | | $ | 2,725 | |
| Redemptions and repayments of debt | | (1,617) | | | (3,171) | |
| | | | |
| | | | |
Distributions to NCI | | (600) | | | (648) | |
Contributions from redeemable NCI | | 108 | | | 6 | |
| Payments related to tax withholdings for share-based compensation | | (50) | | | (45) | |
| Repurchase of common stock, inclusive of excise taxes paid | | (1,687) | | | (1,981) | |
| Dividends to stockholders | | (332) | | | (300) | |
| | | | |
| Other, net | | (94) | | | (79) | |
| Net cash used in financing activities | | $ | (3,010) | | | $ | (3,493) | |
Proceeds from Issuances of Debt and Borrowings
The following table shows the proceeds from issuances of debt and borrowings, including intra-quarter activity (in millions):
| | | | | | | | | | | | | | | | |
| | Nine Months Ended September 30, |
| | 2025 | | 2024 | | |
| Proceeds from issuances of debt and borrowings | | | | | | |
| Cheniere: | | | | | | |
5.650% Senior Notes due 2034 | | $ | — | | | $ | 1,497 | | | |
| | | | | | |
| CQP: | | | | | | |
5.750% Senior Notes due 2034 | | — | | | 1,198 | | | |
| 2035 CQP Senior Notes | | 997 | | | — | | | |
| | | | | | |
| SPL: | | | | | | |
| SPL Revolving Credit Facility | | 265 | | | 30 | | | |
| Total proceeds from issuances of debt and borrowings | | $ | 1,262 | | | $ | 2,725 | | | |
Debt Redemptions and Repayments
The following table shows the redemptions and repayments of debt, including intra-quarter activity (in millions):
| | | | | | | | | | | | | | | | |
| | Nine Months Ended September 30, |
| | 2025 | | 2024 | | |
| Redemptions and repayments of debt | | | | | | |
| SPL: | | | | | | |
5.750% Senior Secured Notes due 2024 | | $ | — | | | $ | (300) | | | |
5.625% Senior Secured Notes due 2025 | | (300) | | | (1,350) | | | |
| 2026 SPL Senior Notes | | (1,000) | | | — | | | |
4.746% weighted average rate Senior Notes due 2037 | | (52) | | | — | | | |
| SPL Revolving Credit Facility | | (265) | | | (30) | | | |
| | | | | | |
| | | | | | |
| | | | | | |
| | | | | | |
| | | | | | |
| | | | | | |
| CCH: | | | | | | |
| | | | | | |
| | | | | | |
| | | | | | |
5.875% Senior Notes due 2025 | | — | | | (1,491) | | | |
| | | | | | |
| | | | | | |
| | | | | | |
| | | | | | |
| | | | | | |
| | | | | | |
| | | | | | |
| | | | | | |
| | | | | | |
| | | | | | |
| | | | | | |
| | | | | | |
| Total redemptions and repayments of debt | | $ | (1,617) | | | $ | (3,171) | | | |
Repurchase of Common Stock
During the nine months ended September 30, 2025 and 2024, we paid $1.7 billion and $2.0 billion to repurchase approximately 7.4 million and 12.2 million shares of our common stock, respectively, under our share repurchase program. Additionally, during the nine months ended September 30, 2025, we paid $33 million of excise taxes related to our repurchase of common stock during the fiscal years 2023 and 2024. As of September 30, 2025, we had approximately $2.2 billion remaining under our share repurchase program.
Cash Dividends to Stockholders
During the nine months ended September 30, 2025, we paid aggregate dividends of $1.500 per share of common stock for a total of $332 million and during the nine months ended September 30, 2024, we paid aggregate dividends of $1.305 per share of common stock for a total of $300 million.
On October 28, 2025, we declared a quarterly dividend of $0.555 per share of common stock that is payable on November 18, 2025 to stockholders of record as of the close of business on November 7, 2025.
Summary of Critical Accounting Estimates
The preparation of Consolidated Financial Statements in conformity with GAAP requires management to make certain estimates and assumptions that affect the amounts reported in the Consolidated Financial Statements and the accompanying notes. There have been no significant changes to our critical accounting estimates from those disclosed in our annual report on Form 10-K for the fiscal year ended December 31, 2024.
Recent Accounting Standards
ITEM 3. QUANTITATIVE AND QUALITATIVE DISCLOSURES ABOUT MARKET RISK
Marketing and Trading Commodity Price Risk
We have commodity derivatives consisting of natural gas and power supply contracts for the commissioning and operation of the Liquefaction Projects and the SPL Expansion Project, and associated economic hedges (collectively, the “Liquefaction Supply Derivatives”) and physical and financial derivatives to hedge the exposure to the commodity markets in which we have contractual arrangements to purchase or sell physical LNG (collectively, “LNG Trading Derivatives”). In order to test the sensitivity of the fair value of the Liquefaction Supply Derivatives and the LNG Trading Derivatives to changes in underlying commodity prices, management modeled a 10% change in the commodity price for natural gas for each delivery location and a 10% change in the commodity price for LNG, respectively, as follows (in millions):
| | | | | | | | | | | | | | | | | | | | | | | |
| September 30, 2025 | | December 31, 2024 |
| Fair Value | | Change in Fair Value | | Fair Value | | Change in Fair Value |
| Liquefaction Supply Derivatives | $ | 624 | | | $ | 2,262 | | | $ | (742) | | | $ | 2,516 | |
| LNG Trading Derivatives | 14 | | | 40 | | | 17 | | | 49 | |
See Note 5—Derivative Instruments of our Notes to Consolidated Financial Statements for additional details about our commodity derivative instruments.
ITEM 4. CONTROLS AND PROCEDURES
We maintain a set of disclosure controls and procedures that are designed to ensure that information required to be disclosed by us in the reports filed by us under the Exchange Act is recorded, processed, summarized and reported within the time periods specified in the SEC’s rules and forms. As of the end of the period covered by this report, we evaluated, under the supervision and with the participation of our management, including our Chief Executive Officer and our Chief Financial Officer, the effectiveness of our disclosure controls and procedures pursuant to Rule 13a-15 of the Exchange Act. Based on that evaluation, our Chief Executive Officer and our Chief Financial Officer concluded that our disclosure controls and procedures are effective.
During the most recent fiscal quarter, there have been no changes in our internal control over financial reporting that have materially affected, or are reasonably likely to materially affect, our internal control over financial reporting.
PART II. OTHER INFORMATION
ITEM 1. LEGAL PROCEEDINGS
We are, and may in the future be, involved as a party to various legal proceedings, which are incidental to the ordinary course of business. We regularly analyze current information and, as necessary, provide accruals for probable liabilities on the eventual disposition of these matters. Other than as discussed below, there have been no material changes to the legal proceedings disclosed in our annual report on Form 10-K for the fiscal year ended December 31, 2024.
Louisiana Department of Environmental Quality (“LDEQ”) Matter
We and another subsidiary of CQP are in discussions with the LDEQ to resolve alleged non-compliance with national emission standards for formaldehyde from combustion turbines at the Sabine Pass LNG Terminal. The allegations are identified in a Consolidated Compliance Order and Notice of Potential Penalty, Tracking No. AE-CN-22-00833 (the “2023 Compliance Order”) issued by the LDEQ on April 12, 2023. In August 2004, the U.S. Environmental Protection Agency (the “EPA”) stayed the application of the emission standard to combustion turbines such as those at the Sabine Pass LNG Terminal. In March 2022, the EPA lifted the stay, and in June 2022, we and the other subsidiary of CQP petitioned the EPA and LDEQ for approval of additional operating parameters to demonstrate compliance with the emission limitation. The EPA approved the petition on July 31, 2025 and in October 2025 the LDEQ confirmed that all remaining milestones under the 2023 Compliance Order have been met. We and the other subsidiary of CQP continue to work with the LDEQ to resolve the 2023 Compliance Order. As of December 2024, we and the other subsidiary of CQP had filed test results with the LDEQ indicating that for the 2024 testing period all 44 turbines met the relevant compliance standard. As of September 2025, for the 2025 testing period, all 44 turbines met the relevant compliance standard. We do not expect that any ultimate penalty will have a material adverse impact on our financial results.
ITEM 1A. RISK FACTORS
ITEM 2. UNREGISTERED SALES OF EQUITY SECURITIES AND USE OF PROCEEDS
Purchase of Equity Securities by the Issuer and Affiliated Purchasers
The following table summarizes share repurchases for the three months ended September 30, 2025:
| | | | | | | | | | | | | | | | | | | | | | | | | | |
| Period | | Total Number of Shares Purchased | | Average Price Paid Per Share | | Total Number of Shares Purchased as a Part of Publicly Announced Plans | | Approximate Dollar Value of Shares That May Yet Be Purchased Under the Plans
(in millions) |
| July 1-31, 2025 | | 1,661,471 | | $232.16 | | 1,661,471 | | $2,848 |
| August 1-31, 2025 | | 1,258,050 | | $233.35 | | 1,258,050 | | $2,555 |
| September 1-30, 2025 | | 1,446,845 | | $234.08 | | 1,446,845 | | $2,216 |
| Total | | 4,366,366 | | | | 4,366,366 | | |
ITEM 5. OTHER INFORMATION
Rule 10-b5-1 Trading Arrangements
Rule 10b5-1 under the Exchange Act provides an affirmative defense that enables prearranged transactions in securities in a manner that avoids concerns about initiating transactions at a future date while possibly in possession of material nonpublic information. Our Insider Trading Policy permits our directors and executive officers to enter into trading plans designed to comply with Rule 10b5-1. During the three-month period ending September 30, 2025, none of our executive officers or directors adopted or terminated a Rule 10b5-1 trading plan or adopted or terminated a non-Rule 10b5-1 trading arrangement (as defined in Item 408(c) of Regulation S-K).
ITEM 6. EXHIBITS
| | | | | | | | | | | | | |
| Exhibit No. | | | | |
| Description | | | | | |
| 10.1* | | Change order to the Lump Sum Turnkey Agreement for the Engineering, Procurement and Construction of the Corpus Christi Liquefaction Stage 3 Project, dated March 1, 2022, by and between CCL and Bechtel Energy, Inc.: (i) the Change Order CO-00110 Owner Accommodations at Contractor CityWest Offices, dated May 22, 2025, (ii) the Change Order CO-00111 Trim Modifications on PV-17016 and PV-17516 Valves, dated July 21, 2025, (iii) the Change Order CO-00112 Supply of Train 2 Demineralized Water (Owner Request), dated July 25, 2025 and (iv) the Change Order CO-00113 Acceleration Program Extension (August - November 2025), dated August 4, 2025 (Portions of this exhibit have been omitted.) | | | | | |
| | | | | | | |
| | | | | | | |
| | | | | | | |
| | | | | | | |
| | | | | | | |
| | | | | | | |
| 31.1* | | | | | | | |
| 31.2* | | | | | | | |
| 32.1** | | | | | | | |
| 32.2** | | | | | | | |
| 101.INS* | | XBRL Instance Document | | | | | |
| 101.SCH* | | XBRL Taxonomy Extension Schema Document | | | | | |
| 101.CAL* | | XBRL Taxonomy Extension Calculation Linkbase Document | | | | | |
| 101.DEF* | | XBRL Taxonomy Extension Definition Linkbase Document | | | | | |
| 101.LAB* | | XBRL Taxonomy Extension Labels Linkbase Document | | | | | |
| 101.PRE* | | XBRL Taxonomy Extension Presentation Linkbase Document | | | | | |
| 104* | | Cover Page Interactive Data File (formatted as Inline XBRL and contained in Exhibit 101) | | | | | |
| | | | | |
| * | Filed herewith. |
| ** | Furnished herewith. |
| |
Pursuant to the requirements of the Securities Exchange Act of 1934, the registrant has duly caused this report to be signed on its behalf by the undersigned, thereunto duly authorized.
| | | | | | | | | | | |
| | CHENIERE ENERGY, INC. |
| | |
| | | |
| | | |
| | | |
| | | |
| | | |
| | | |
| Date: | October 29, 2025 | By: | /s/ Zach Davis |
| | | Zach Davis |
| | | Executive Vice President and Chief Financial Officer |
| | | (on behalf of the registrant and
as principal financial officer) |
| | | |
| Date: | October 29, 2025 | By: | /s/ David Slack |
| | | David Slack |
| | | Senior Vice President and Chief Accounting Officer |
| | | (on behalf of the registrant and
as principal accounting officer) |