0000003570false--12-312024FY6501030http://fasb.org/us-gaap/2024#Revenueshttp://fasb.org/us-gaap/2024#Revenueshttp://fasb.org/us-gaap/2024#Revenueshttp://fasb.org/us-gaap/2024#DerivativeAssetsCurrenthttp://fasb.org/us-gaap/2024#DerivativeAssetsCurrenthttp://fasb.org/us-gaap/2024#DerivativeAssetsNoncurrenthttp://fasb.org/us-gaap/2024#DerivativeAssetsNoncurrenthttp://fasb.org/us-gaap/2024#DerivativeLiabilitiesCurrenthttp://fasb.org/us-gaap/2024#DerivativeLiabilitiesCurrenthttp://fasb.org/us-gaap/2024#DerivativeLiabilitiesNoncurrenthttp://fasb.org/us-gaap/2024#DerivativeLiabilitiesNoncurrenthttp://fasb.org/us-gaap/2024#DerivativeAssetsCurrenthttp://fasb.org/us-gaap/2024#DerivativeAssetsCurrenthttp://fasb.org/us-gaap/2024#DerivativeAssetsNoncurrenthttp://fasb.org/us-gaap/2024#DerivativeAssetsNoncurrenthttp://fasb.org/us-gaap/2024#DerivativeLiabilitiesCurrenthttp://fasb.org/us-gaap/2024#DerivativeLiabilitiesCurrenthttp://fasb.org/us-gaap/2024#DerivativeLiabilitiesNoncurrenthttp://fasb.org/us-gaap/2024#DerivativeLiabilitiesNoncurrentP30DSOFR or base rateSOFR or base rateSOFR or base rateSOFR or base rateSOFR or base ratehttp://fasb.org/us-gaap/2024#OperatingLeaseRightOfUseAssethttp://fasb.org/us-gaap/2024#OperatingLeaseRightOfUseAssethttp://fasb.org/us-gaap/2024#PropertyPlantAndEquipmentNethttp://fasb.org/us-gaap/2024#PropertyPlantAndEquipmentNethttp://fasb.org/us-gaap/2024#OperatingLeaseLiabilityCurrenthttp://fasb.org/us-gaap/2024#OperatingLeaseLiabilityCurrenthttp://fasb.org/us-gaap/2024#OtherLiabilitiesCurrenthttp://fasb.org/us-gaap/2024#OtherLiabilitiesCurrenthttp://fasb.org/us-gaap/2024#OperatingLeaseLiabilityNoncurrenthttp://fasb.org/us-gaap/2024#OperatingLeaseLiabilityNoncurrenthttp://fasb.org/us-gaap/2024#OtherLiabilitiesNoncurrenthttp://fasb.org/us-gaap/2024#OtherLiabilitiesNoncurrent1iso4217:USDxbrli:sharesiso4217:USDxbrli:shareslng:unitlng:trainslng:milliontonnesutr:Ylng:itemutr:mixbrli:purelng:customerlng:tbtulng:unitslng:Employees00000035702024-01-012024-12-3100000035702024-06-3000000035702025-02-140000003570lng:LiquefiedNaturalGasMember2024-01-012024-12-310000003570lng:LiquefiedNaturalGasMember2023-01-012023-12-310000003570lng:LiquefiedNaturalGasMember2022-01-012022-12-310000003570lng:RegasificationServiceMember2024-01-012024-12-310000003570lng:RegasificationServiceMember2023-01-012023-12-310000003570lng:RegasificationServiceMember2022-01-012022-12-310000003570us-gaap:ProductAndServiceOtherMember2024-01-012024-12-310000003570us-gaap:ProductAndServiceOtherMember2023-01-012023-12-310000003570us-gaap:ProductAndServiceOtherMember2022-01-012022-12-3100000035702023-01-012023-12-3100000035702022-01-012022-12-3100000035702024-12-3100000035702023-12-310000003570us-gaap:TreasuryStockCommonMember2024-12-310000003570us-gaap:TreasuryStockCommonMember2023-12-310000003570us-gaap:VariableInterestEntityPrimaryBeneficiaryMember2024-12-310000003570us-gaap:CommonStockMember2021-12-310000003570us-gaap:TreasuryStockCommonMember2021-12-310000003570us-gaap:AdditionalPaidInCapitalMember2021-12-310000003570us-gaap:RetainedEarningsMember2021-12-310000003570us-gaap:NoncontrollingInterestMember2021-12-3100000035702021-12-310000003570lng:RedeemableNoncontrollingInterestMember2021-12-310000003570us-gaap:CommonStockMember2022-01-012022-12-310000003570us-gaap:TreasuryStockCommonMember2022-01-012022-12-310000003570us-gaap:AdditionalPaidInCapitalMember2022-01-012022-12-310000003570us-gaap:RetainedEarningsMember2022-01-012022-12-310000003570us-gaap:NoncontrollingInterestMember2022-01-012022-12-310000003570us-gaap:CommonStockMember2022-12-310000003570us-gaap:TreasuryStockCommonMember2022-12-310000003570us-gaap:AdditionalPaidInCapitalMember2022-12-310000003570us-gaap:RetainedEarningsMember2022-12-310000003570us-gaap:NoncontrollingInterestMember2022-12-3100000035702022-12-310000003570lng:RedeemableNoncontrollingInterestMember2022-12-310000003570us-gaap:CommonStockMember2023-01-012023-12-310000003570us-gaap:TreasuryStockCommonMember2023-01-012023-12-310000003570us-gaap:AdditionalPaidInCapitalMember2023-01-012023-12-310000003570us-gaap:RetainedEarningsMember2023-01-012023-12-310000003570us-gaap:NoncontrollingInterestMember2023-01-012023-12-310000003570us-gaap:CommonStockMember2023-12-310000003570us-gaap:AdditionalPaidInCapitalMember2023-12-310000003570us-gaap:RetainedEarningsMember2023-12-310000003570us-gaap:NoncontrollingInterestMember2023-12-310000003570lng:RedeemableNoncontrollingInterestMember2023-12-310000003570us-gaap:CommonStockMember2024-01-012024-12-310000003570us-gaap:TreasuryStockCommonMember2024-01-012024-12-310000003570us-gaap:AdditionalPaidInCapitalMember2024-01-012024-12-310000003570us-gaap:RetainedEarningsMember2024-01-012024-12-310000003570us-gaap:NoncontrollingInterestMember2024-01-012024-12-310000003570lng:RedeemableNoncontrollingInterestMember2024-01-012024-12-310000003570us-gaap:CommonStockMember2024-12-310000003570us-gaap:AdditionalPaidInCapitalMember2024-12-310000003570us-gaap:RetainedEarningsMember2024-12-310000003570us-gaap:NoncontrollingInterestMember2024-12-310000003570lng:RedeemableNoncontrollingInterestMember2024-12-310000003570lng:SabinePassLNGTerminalMember2024-01-012024-12-310000003570lng:CreoleTrailPipelineMember2024-01-012024-12-310000003570us-gaap:GeneralPartnerMemberlng:CheniereEnergyPartnersLPMember2024-01-012024-12-310000003570lng:CheniereEnergyPartnersLPMember2024-01-012024-12-310000003570lng:CorpusChristiLNGTerminalMember2024-01-012024-12-310000003570lng:CorpusChristiStage3ProjectMember2024-01-012024-12-310000003570srt:MinimumMemberlng:CorpusChristiStage3ProjectMember2024-01-012024-12-310000003570lng:CorpusChristiPipelineMember2024-01-012024-12-310000003570us-gaap:CustomerConcentrationRiskMembersrt:MinimumMember2024-01-012024-12-310000003570lng:SPACustomersMemberus-gaap:CustomerConcentrationRiskMember2024-01-012024-12-310000003570srt:MaximumMemberlng:SabinePassLNGTerminalMember2024-12-310000003570lng:SabinePassLNGTerminalMember2024-12-310000003570lng:CorpusChristiPipelineMember2024-12-310000003570lng:CreoleTrailPipelineMember2024-12-310000003570lng:SabinePassLiquefactionAndCorpusChristiLiquefactionMember2024-12-310000003570lng:SabinePassLiquefactionAndCorpusChristiLiquefactionMember2023-12-310000003570lng:CheniereMarketingLLCMember2024-12-310000003570lng:CheniereMarketingLLCMember2023-12-310000003570lng:OtherSubsidiariesMember2024-12-310000003570lng:OtherSubsidiariesMember2023-12-310000003570lng:MaterialsInventoryMember2024-12-310000003570lng:MaterialsInventoryMember2023-12-310000003570lng:LiquefiedNaturalGasInventoryMember2024-12-310000003570lng:LiquefiedNaturalGasInventoryMember2023-12-310000003570lng:LiquefiedNaturalGasInTransitInventoryMember2024-12-310000003570lng:LiquefiedNaturalGasInTransitInventoryMember2023-12-310000003570lng:NaturalGasInventoryMember2024-12-310000003570lng:NaturalGasInventoryMember2023-12-310000003570lng:OtherInventoryMember2024-12-310000003570lng:OtherInventoryMember2023-12-310000003570lng:TerminalAndInterconnectingPipelineFacilitiesMember2024-12-310000003570lng:TerminalAndInterconnectingPipelineFacilitiesMember2023-12-310000003570us-gaap:LandAndLandImprovementsMember2024-12-310000003570us-gaap:LandAndLandImprovementsMember2023-12-310000003570us-gaap:ConstructionInProgressMember2024-12-310000003570us-gaap:ConstructionInProgressMember2023-12-310000003570lng:TerminalAndRelatedAssetsMember2024-12-310000003570lng:TerminalAndRelatedAssetsMember2023-12-310000003570us-gaap:OfficeEquipmentMember2024-12-310000003570us-gaap:OfficeEquipmentMember2023-12-310000003570us-gaap:FurnitureAndFixturesMember2024-12-310000003570us-gaap:FurnitureAndFixturesMember2023-12-310000003570us-gaap:SoftwareAndSoftwareDevelopmentCostsMember2024-12-310000003570us-gaap:SoftwareAndSoftwareDevelopmentCostsMember2023-12-310000003570us-gaap:LeaseholdImprovementsMember2024-12-310000003570us-gaap:LeaseholdImprovementsMember2023-12-310000003570us-gaap:OtherCapitalizedPropertyPlantAndEquipmentMember2024-12-310000003570us-gaap:OtherCapitalizedPropertyPlantAndEquipmentMember2023-12-310000003570lng:FixedAssetsMember2024-12-310000003570lng:FixedAssetsMember2023-12-310000003570us-gaap:AssetsHeldUnderCapitalLeasesMember2024-12-310000003570us-gaap:AssetsHeldUnderCapitalLeasesMember2023-12-310000003570srt:MinimumMemberlng:TerminalAndRelatedAssetsMember2024-12-310000003570srt:MaximumMemberlng:TerminalAndRelatedAssetsMember2024-12-310000003570lng:LNGStorageTanksMember2024-12-310000003570us-gaap:PipelinesMember2024-12-310000003570lng:MarineBerthElectricalFacilityAndRoadsMember2024-12-310000003570lng:WaterPipelinesMember2024-12-310000003570lng:RegasificationProcessingEquipmentRecondensersVaporizationAndVentsMember2024-12-310000003570lng:SendoutPumpsMember2024-12-310000003570srt:MinimumMemberlng:LiquefactionProcessingEquipmentMember2024-12-310000003570srt:MaximumMemberlng:LiquefactionProcessingEquipmentMember2024-12-310000003570srt:MinimumMemberus-gaap:OtherEnergyEquipmentMember2024-12-310000003570srt:MaximumMemberus-gaap:OtherEnergyEquipmentMember2024-12-310000003570us-gaap:FairValueInputsLevel1Memberus-gaap:PriceRiskDerivativeMember2024-12-310000003570us-gaap:FairValueInputsLevel2Memberus-gaap:PriceRiskDerivativeMember2024-12-310000003570us-gaap:FairValueInputsLevel3Memberus-gaap:PriceRiskDerivativeMember2024-12-310000003570us-gaap:PriceRiskDerivativeMember2024-12-310000003570us-gaap:FairValueInputsLevel1Memberus-gaap:PriceRiskDerivativeMember2023-12-310000003570us-gaap:FairValueInputsLevel2Memberus-gaap:PriceRiskDerivativeMember2023-12-310000003570us-gaap:FairValueInputsLevel3Memberus-gaap:PriceRiskDerivativeMember2023-12-310000003570us-gaap:PriceRiskDerivativeMember2023-12-310000003570us-gaap:FairValueInputsLevel1Memberlng:LNGTradingDerivativeMember2024-12-310000003570us-gaap:FairValueInputsLevel2Memberlng:LNGTradingDerivativeMember2024-12-310000003570us-gaap:FairValueInputsLevel3Memberlng:LNGTradingDerivativeMember2024-12-310000003570lng:LNGTradingDerivativeMember2024-12-310000003570us-gaap:FairValueInputsLevel1Memberlng:LNGTradingDerivativeMember2023-12-310000003570us-gaap:FairValueInputsLevel2Memberlng:LNGTradingDerivativeMember2023-12-310000003570us-gaap:FairValueInputsLevel3Memberlng:LNGTradingDerivativeMember2023-12-310000003570lng:LNGTradingDerivativeMember2023-12-310000003570us-gaap:FairValueInputsLevel1Memberus-gaap:ForeignExchangeContractMember2024-12-310000003570us-gaap:FairValueInputsLevel2Memberus-gaap:ForeignExchangeContractMember2024-12-310000003570us-gaap:FairValueInputsLevel3Memberus-gaap:ForeignExchangeContractMember2024-12-310000003570us-gaap:ForeignExchangeContractMember2024-12-310000003570us-gaap:FairValueInputsLevel1Memberus-gaap:ForeignExchangeContractMember2023-12-310000003570us-gaap:FairValueInputsLevel2Memberus-gaap:ForeignExchangeContractMember2023-12-310000003570us-gaap:FairValueInputsLevel3Memberus-gaap:ForeignExchangeContractMember2023-12-310000003570us-gaap:ForeignExchangeContractMember2023-12-310000003570us-gaap:FairValueInputsLevel3Memberus-gaap:PriceRiskDerivativeMemberus-gaap:MarketApproachValuationTechniqueMembersrt:MinimumMember2024-01-012024-12-310000003570us-gaap:FairValueInputsLevel3Memberus-gaap:PriceRiskDerivativeMemberus-gaap:MarketApproachValuationTechniqueMembersrt:MaximumMember2024-01-012024-12-310000003570us-gaap:FairValueInputsLevel3Memberus-gaap:PriceRiskDerivativeMemberus-gaap:MarketApproachValuationTechniqueMembersrt:WeightedAverageMember2024-01-012024-12-310000003570us-gaap:FairValueInputsLevel3Memberus-gaap:PriceRiskDerivativeMemberus-gaap:ValuationTechniqueOptionPricingModelMembersrt:MinimumMember2024-01-012024-12-310000003570us-gaap:FairValueInputsLevel3Memberus-gaap:PriceRiskDerivativeMemberus-gaap:ValuationTechniqueOptionPricingModelMembersrt:MaximumMember2024-01-012024-12-310000003570us-gaap:FairValueInputsLevel3Memberus-gaap:PriceRiskDerivativeMemberus-gaap:ValuationTechniqueOptionPricingModelMembersrt:WeightedAverageMember2024-01-012024-12-310000003570us-gaap:PriceRiskDerivativeMember2022-12-310000003570us-gaap:PriceRiskDerivativeMember2021-12-310000003570us-gaap:PriceRiskDerivativeMember2024-01-012024-12-310000003570us-gaap:PriceRiskDerivativeMember2023-01-012023-12-310000003570us-gaap:PriceRiskDerivativeMember2022-01-012022-12-310000003570us-gaap:PriceRiskDerivativeMembersrt:MaximumMember2024-01-012024-12-310000003570lng:LNGTradingDerivativeMembersrt:MaximumMember2024-01-012024-12-310000003570us-gaap:CommodityContractMember2024-01-012024-12-310000003570us-gaap:SalesMemberlng:LNGTradingDerivativeMember2024-01-012024-12-310000003570us-gaap:SalesMemberlng:LNGTradingDerivativeMember2023-01-012023-12-310000003570us-gaap:SalesMemberlng:LNGTradingDerivativeMember2022-01-012022-12-310000003570us-gaap:CostOfSalesMemberlng:LNGTradingDerivativeMember2024-01-012024-12-310000003570us-gaap:CostOfSalesMemberlng:LNGTradingDerivativeMember2023-01-012023-12-310000003570us-gaap:CostOfSalesMemberlng:LNGTradingDerivativeMember2022-01-012022-12-310000003570us-gaap:SalesMemberus-gaap:PriceRiskDerivativeMember2024-01-012024-12-310000003570us-gaap:SalesMemberus-gaap:PriceRiskDerivativeMember2023-01-012023-12-310000003570us-gaap:SalesMemberus-gaap:PriceRiskDerivativeMember2022-01-012022-12-310000003570us-gaap:CostOfSalesMemberus-gaap:PriceRiskDerivativeMember2024-01-012024-12-310000003570us-gaap:CostOfSalesMemberus-gaap:PriceRiskDerivativeMember2023-01-012023-12-310000003570us-gaap:CostOfSalesMemberus-gaap:PriceRiskDerivativeMember2022-01-012022-12-310000003570us-gaap:ForeignExchangeContractMembersrt:MaximumMember2024-01-012024-12-310000003570us-gaap:ForeignExchangeContractMember2024-01-012024-12-310000003570us-gaap:ForeignExchangeContractMember2023-01-012023-12-310000003570us-gaap:ForeignExchangeContractMember2022-01-012022-12-310000003570lng:PriceRiskDerivativeAssetMember2024-12-310000003570lng:LNGTradingDerivativeAssetMember2024-12-310000003570lng:ForeignExchangeContractAssetMember2024-12-310000003570lng:PriceRiskDerivativeLiabilityMember2024-12-310000003570lng:LNGTradingDerivativesLiabilityMember2024-12-310000003570lng:ForeignExchangeContractLiabilityMember2024-12-310000003570lng:PriceRiskDerivativeAssetMember2023-12-310000003570lng:LNGTradingDerivativeAssetMember2023-12-310000003570lng:ForeignExchangeContractAssetMember2023-12-310000003570lng:PriceRiskDerivativeLiabilityMember2023-12-310000003570lng:LNGTradingDerivativesLiabilityMember2023-12-310000003570lng:ForeignExchangeContractLiabilityMember2023-12-310000003570lng:BlackstoneInc.AndBrookfieldAssetManagementInc.AndThePublicMember2024-01-012024-12-310000003570lng:CheniereEnergyPartnersLPMemberlng:CQPHoldcoLPMemberlng:ClassBUnitsMember2013-01-012013-12-310000003570lng:CQPHoldcoLPMemberlng:CheniereEnergyPartnersGPLLCMember2024-01-012024-12-310000003570lng:CheniereEnergyIncMemberlng:CheniereEnergyPartnersGPLLCMember2024-01-012024-12-310000003570lng:CQPHoldcoLPAndCheniereEnergyIncMemberlng:CheniereEnergyPartnersGPLLCMember2024-01-012024-12-310000003570lng:CQPHoldcoLPMember2024-01-012024-12-310000003570lng:DirectorAppointmentEntitlementMinimumMemberlng:CheniereEnergyPartnersLPMemberlng:CQPHoldcoLPMember2024-01-012024-12-310000003570us-gaap:VariableInterestEntityPrimaryBeneficiaryMember2024-01-012024-12-310000003570us-gaap:VariableInterestEntityPrimaryBeneficiaryMember2023-12-310000003570lng:A2024SabinePassLiquefactionSeniorNotesMember2024-12-310000003570lng:A2024SabinePassLiquefactionSeniorNotesMember2023-12-310000003570lng:A2025SabinePassLiquefactionSeniorNotesMember2024-12-310000003570lng:A2025SabinePassLiquefactionSeniorNotesMember2023-12-310000003570lng:A2026SabinePassLiquefactionSeniorNotesMember2024-12-310000003570lng:A2026SabinePassLiquefactionSeniorNotesMember2023-12-310000003570lng:A2027SabinePassLiquefactionSeniorNotesMember2024-12-310000003570lng:A2027SabinePassLiquefactionSeniorNotesMember2023-12-310000003570lng:A2028SabinePassLiquefactionSeniorNotesMember2024-12-310000003570lng:A2028SabinePassLiquefactionSeniorNotesMember2023-12-310000003570lng:A2030SabinePassLiquefactionSeniorNotesMember2024-12-310000003570lng:A2030SabinePassLiquefactionSeniorNotesMember2023-12-310000003570lng:A2037SabinePassLiquefactionNotesMembersrt:WeightedAverageMember2024-12-310000003570lng:A2037SabinePassLiquefactionNotesMember2024-12-310000003570lng:A2037SabinePassLiquefactionNotesMember2023-12-310000003570lng:SabinePassLiquefactionSeniorNotesMember2024-12-310000003570lng:SabinePassLiquefactionSeniorNotesMember2023-12-310000003570lng:SPLRevolvingCreditFacilityMember2024-12-310000003570lng:SPLRevolvingCreditFacilityMember2023-12-310000003570lng:SabinePassLiquefactionMember2024-12-310000003570lng:SabinePassLiquefactionMember2023-12-310000003570lng:A2029CheniereEnergyPartnersSeniorNotesMember2024-12-310000003570lng:A2029CheniereEnergyPartnersSeniorNotesMember2023-12-310000003570lng:A2031CheniereEnergyPartnersSeniorNotesMember2024-12-310000003570lng:A2031CheniereEnergyPartnersSeniorNotesMember2023-12-310000003570lng:A2032CheniereEnergyPartnersSeniorNotesMember2024-12-310000003570lng:A2032CheniereEnergyPartnersSeniorNotesMember2023-12-310000003570lng:A2033CheniereEnergyPartnersSeniorNotesMember2024-12-310000003570lng:A2033CheniereEnergyPartnersSeniorNotesMember2023-12-310000003570lng:A2034CheniereEnergyPartnersSeniorNotesMember2024-12-310000003570lng:A2034CheniereEnergyPartnersSeniorNotesMember2023-12-310000003570lng:CheniereEnergyPartnersSeniorNotesMember2024-12-310000003570lng:CheniereEnergyPartnersSeniorNotesMember2023-12-310000003570lng:CQPRevolvingCreditFacilityMember2024-12-310000003570lng:CQPRevolvingCreditFacilityMember2023-12-310000003570lng:CheniereEnergyPartnersLPMember2024-12-310000003570lng:CheniereEnergyPartnersLPMember2023-12-310000003570lng:A2025CorpusChristiHoldingsSeniorNotesMember2024-12-310000003570lng:A2025CorpusChristiHoldingsSeniorNotesMember2023-12-310000003570lng:A2027CorpusChristiHoldingsSeniorNotesMember2024-12-310000003570lng:A2027CorpusChristiHoldingsSeniorNotesMember2023-12-310000003570lng:A2029CorpusChristiHoldingsSeniorNotesMember2024-12-310000003570lng:A2029CorpusChristiHoldingsSeniorNotesMember2023-12-310000003570lng:A2039CorpusChristiHoldingsSeniorNotesMembersrt:WeightedAverageMember2024-12-310000003570lng:A2039CorpusChristiHoldingsSeniorNotesMember2024-12-310000003570lng:A2039CorpusChristiHoldingsSeniorNotesMember2023-12-310000003570lng:CorpusChristiHoldingsSeniorNotesMember2024-12-310000003570lng:CorpusChristiHoldingsSeniorNotesMember2023-12-310000003570lng:A2015CCHTermLoanFacilityMember2024-12-310000003570lng:A2015CCHTermLoanFacilityMember2023-12-310000003570lng:CorpusChristiHoldingsWorkingCapitalFacilityMember2024-12-310000003570lng:CorpusChristiHoldingsWorkingCapitalFacilityMember2023-12-310000003570lng:CheniereCorpusChristiHoldingsLLCMember2024-12-310000003570lng:CheniereCorpusChristiHoldingsLLCMember2023-12-310000003570lng:A2028CheniereSeniorSecuredNotesMember2024-12-310000003570lng:A2028CheniereSeniorSecuredNotesMember2023-12-310000003570lng:A2034CheniereSeniorNotesMember2024-12-310000003570lng:A2034CheniereSeniorNotesMember2023-12-310000003570lng:CheniereSeniorNotesMember2024-12-310000003570lng:CheniereSeniorNotesMember2023-12-310000003570lng:CheniereRevolvingCreditFacilityMember2024-12-310000003570lng:CheniereRevolvingCreditFacilityMember2023-12-310000003570srt:ParentCompanyMember2024-12-310000003570srt:ParentCompanyMember2023-12-310000003570lng:CheniereEnergyPartnersSeniorNotesExcept2033And2034CheniereEnergyPartnersSeniorNotesMemberlng:CheniereEnergyPartnersLPMember2024-01-012024-12-310000003570lng:SPLRevolvingCreditFacilityMemberus-gaap:SecuredOvernightFinancingRateSofrOvernightIndexSwapRateMember2024-01-012024-12-310000003570lng:SPLRevolvingCreditFacilityMemberus-gaap:SecuredOvernightFinancingRateSofrOvernightIndexSwapRateMembersrt:MinimumMember2024-01-012024-12-310000003570lng:SPLRevolvingCreditFacilityMemberus-gaap:SecuredOvernightFinancingRateSofrOvernightIndexSwapRateMembersrt:MaximumMember2024-01-012024-12-310000003570lng:SPLRevolvingCreditFacilityMemberus-gaap:BaseRateMembersrt:MinimumMember2024-01-012024-12-310000003570lng:SPLRevolvingCreditFacilityMemberus-gaap:BaseRateMembersrt:MaximumMember2024-01-012024-12-310000003570lng:CQPRevolvingCreditFacilityMemberus-gaap:SecuredOvernightFinancingRateSofrOvernightIndexSwapRateMember2024-01-012024-12-310000003570lng:CQPRevolvingCreditFacilityMemberus-gaap:SecuredOvernightFinancingRateSofrOvernightIndexSwapRateMembersrt:MinimumMember2024-01-012024-12-310000003570lng:CQPRevolvingCreditFacilityMemberus-gaap:SecuredOvernightFinancingRateSofrOvernightIndexSwapRateMembersrt:MaximumMember2024-01-012024-12-310000003570lng:CQPRevolvingCreditFacilityMemberus-gaap:BaseRateMembersrt:MinimumMember2024-01-012024-12-310000003570lng:CQPRevolvingCreditFacilityMemberus-gaap:BaseRateMembersrt:MaximumMember2024-01-012024-12-310000003570lng:A2015CCHTermLoanFacilityMemberus-gaap:SecuredOvernightFinancingRateSofrOvernightIndexSwapRateMember2024-01-012024-12-310000003570lng:A2015CCHTermLoanFacilityMemberus-gaap:BaseRateMember2024-01-012024-12-310000003570lng:CorpusChristiHoldingsWorkingCapitalFacilityMemberus-gaap:SecuredOvernightFinancingRateSofrOvernightIndexSwapRateMember2024-01-012024-12-310000003570lng:CorpusChristiHoldingsWorkingCapitalFacilityMemberus-gaap:SecuredOvernightFinancingRateSofrOvernightIndexSwapRateMembersrt:MinimumMember2024-01-012024-12-310000003570lng:CorpusChristiHoldingsWorkingCapitalFacilityMemberus-gaap:SecuredOvernightFinancingRateSofrOvernightIndexSwapRateMembersrt:MaximumMember2024-01-012024-12-310000003570lng:CorpusChristiHoldingsWorkingCapitalFacilityMemberus-gaap:BaseRateMembersrt:MinimumMember2024-01-012024-12-310000003570lng:CorpusChristiHoldingsWorkingCapitalFacilityMemberus-gaap:BaseRateMembersrt:MaximumMember2024-01-012024-12-310000003570lng:CheniereRevolvingCreditFacilityMemberus-gaap:SecuredOvernightFinancingRateSofrOvernightIndexSwapRateMember2024-01-012024-12-310000003570lng:CheniereRevolvingCreditFacilityMemberus-gaap:SecuredOvernightFinancingRateSofrOvernightIndexSwapRateMembersrt:MinimumMember2024-01-012024-12-310000003570lng:CheniereRevolvingCreditFacilityMemberus-gaap:SecuredOvernightFinancingRateSofrOvernightIndexSwapRateMembersrt:MaximumMember2024-01-012024-12-310000003570lng:CheniereRevolvingCreditFacilityMemberus-gaap:BaseRateMembersrt:MinimumMember2024-01-012024-12-310000003570lng:CheniereRevolvingCreditFacilityMemberus-gaap:BaseRateMembersrt:MaximumMember2024-01-012024-12-310000003570lng:SPLRevolvingCreditFacilityMembersrt:MinimumMember2024-01-012024-12-310000003570lng:SPLRevolvingCreditFacilityMembersrt:MaximumMember2024-01-012024-12-310000003570lng:CQPRevolvingCreditFacilityMembersrt:MinimumMember2024-01-012024-12-310000003570lng:CQPRevolvingCreditFacilityMembersrt:MaximumMember2024-01-012024-12-310000003570lng:A2015CCHTermLoanFacilityMember2024-01-012024-12-310000003570lng:CorpusChristiHoldingsWorkingCapitalFacilityMembersrt:MinimumMember2024-01-012024-12-310000003570lng:CorpusChristiHoldingsWorkingCapitalFacilityMembersrt:MaximumMember2024-01-012024-12-310000003570lng:CheniereRevolvingCreditFacilityMembersrt:MinimumMember2024-01-012024-12-310000003570lng:CheniereRevolvingCreditFacilityMembersrt:MaximumMember2024-01-012024-12-310000003570lng:SPLRevolvingCreditFacilityMemberus-gaap:LetterOfCreditMembersrt:MinimumMember2024-12-310000003570lng:SPLRevolvingCreditFacilityMemberus-gaap:LetterOfCreditMembersrt:MaximumMember2024-12-310000003570lng:CQPRevolvingCreditFacilityMemberus-gaap:LetterOfCreditMembersrt:MinimumMember2024-12-310000003570lng:CQPRevolvingCreditFacilityMemberus-gaap:LetterOfCreditMembersrt:MaximumMember2024-12-310000003570lng:CorpusChristiHoldingsWorkingCapitalFacilityMemberus-gaap:LetterOfCreditMembersrt:MinimumMember2024-12-310000003570lng:CorpusChristiHoldingsWorkingCapitalFacilityMemberus-gaap:LetterOfCreditMembersrt:MaximumMember2024-12-310000003570lng:CheniereRevolvingCreditFacilityMemberus-gaap:LetterOfCreditMembersrt:MinimumMember2024-12-310000003570lng:CheniereRevolvingCreditFacilityMemberus-gaap:LetterOfCreditMembersrt:MaximumMember2024-12-310000003570lng:SPLRevolvingCreditFacilityMember2024-01-012024-12-310000003570lng:CQPRevolvingCreditFacilityMember2024-01-012024-12-310000003570lng:CorpusChristiHoldingsWorkingCapitalFacilityMember2024-01-012024-12-310000003570lng:CheniereRevolvingCreditFacilityMember2024-01-012024-12-310000003570lng:A2015CCHTermLoanFacilityMembersrt:MaximumMember2024-01-012024-12-310000003570lng:ChevronUSAIncMemberlng:GainLossOnExtinguishmentOfObligationsMember2022-01-012022-12-310000003570lng:SabinePassLiquefactionAndCheniereCorpusChristiHoldingsMember2024-01-012024-12-310000003570lng:FairValueInputsLevel2AndLevel3Memberus-gaap:SeniorNotesMemberus-gaap:CarryingReportedAmountFairValueDisclosureMember2024-12-310000003570lng:FairValueInputsLevel2AndLevel3Memberus-gaap:SeniorNotesMemberus-gaap:EstimateOfFairValueFairValueDisclosureMember2024-12-310000003570lng:FairValueInputsLevel2AndLevel3Memberus-gaap:SeniorNotesMemberus-gaap:CarryingReportedAmountFairValueDisclosureMember2023-12-310000003570lng:FairValueInputsLevel2AndLevel3Memberus-gaap:SeniorNotesMemberus-gaap:EstimateOfFairValueFairValueDisclosureMember2023-12-310000003570us-gaap:FairValueInputsLevel3Memberus-gaap:SeniorNotesMemberus-gaap:EstimateOfFairValueFairValueDisclosureMember2023-12-310000003570us-gaap:OperatingExpenseMember2024-01-012024-12-310000003570us-gaap:OperatingExpenseMember2023-01-012023-12-310000003570us-gaap:OperatingExpenseMember2022-01-012022-12-310000003570lng:DepreciationandAmortizationExpenseMember2024-01-012024-12-310000003570lng:DepreciationandAmortizationExpenseMember2023-01-012023-12-310000003570lng:DepreciationandAmortizationExpenseMember2022-01-012022-12-310000003570us-gaap:InterestExpenseMember2024-01-012024-12-310000003570us-gaap:InterestExpenseMember2023-01-012023-12-310000003570us-gaap:InterestExpenseMember2022-01-012022-12-310000003570srt:MaximumMember2024-12-310000003570lng:LiquefiedNaturalGasProcuredFromThirdPartiesMember2024-01-012024-12-310000003570lng:LiquefiedNaturalGasProcuredFromThirdPartiesMember2023-01-012023-12-310000003570lng:LiquefiedNaturalGasProcuredFromThirdPartiesMember2022-01-012022-12-310000003570lng:TotalEnergiesGasPowerNorthAmericaIncMember2024-01-012024-12-310000003570lng:ChevronUSAIncMember2024-01-012024-12-310000003570lng:SabinePassLiquefactionMember2024-01-012024-12-310000003570lng:TerminalUseAgreementRegasificationCapacityPartialMember2024-01-012024-12-310000003570lng:TerminalUseAgreementRegasificationCapacityPartialMember2023-01-012023-12-310000003570lng:TerminalUseAgreementRegasificationCapacityPartialMember2022-01-012022-12-310000003570lng:ChevronUSAIncMember2022-06-012022-06-300000003570lng:ChevronUSAIncMemberlng:RegasificationServiceMember2022-06-012022-06-300000003570lng:ChevronUSAIncMemberlng:TerminatedCommitmentsMember2022-07-062022-12-3100000035702025-01-01lng:LiquefiedNaturalGasMember2024-12-3100000035702024-01-01lng:LiquefiedNaturalGasMember2023-12-3100000035702025-01-01lng:RegasificationServiceMember2024-12-3100000035702024-01-01lng:RegasificationServiceMember2023-12-3100000035702025-01-012024-12-3100000035702024-01-012023-12-310000003570us-gaap:EquityMethodInvesteeMemberus-gaap:ProductAndServiceOtherMemberlng:OperationAndMaintenanceAgreementMember2024-01-012024-12-310000003570us-gaap:EquityMethodInvesteeMemberus-gaap:ProductAndServiceOtherMemberlng:OperationAndMaintenanceAgreementMember2023-01-012023-12-310000003570us-gaap:EquityMethodInvesteeMemberus-gaap:ProductAndServiceOtherMemberlng:OperationAndMaintenanceAgreementMember2022-01-012022-12-310000003570us-gaap:EquityMethodInvesteeMemberlng:NaturalGasTransportationAndStorageAgreementsMember2024-01-012024-12-310000003570us-gaap:EquityMethodInvesteeMemberlng:NaturalGasTransportationAndStorageAgreementsMember2023-01-012023-12-310000003570us-gaap:EquityMethodInvesteeMemberlng:NaturalGasTransportationAndStorageAgreementsMember2022-01-012022-12-310000003570us-gaap:RelatedPartyMemberlng:NaturalGasTransportationAndStorageAgreementsMember2024-01-012024-12-310000003570us-gaap:RelatedPartyMemberlng:NaturalGasTransportationAndStorageAgreementsMember2023-01-012023-12-310000003570us-gaap:RelatedPartyMemberlng:NaturalGasTransportationAndStorageAgreementsMember2022-01-012022-12-310000003570us-gaap:EquityMethodInvesteeMember2024-01-012024-12-310000003570us-gaap:RelatedPartyMember2024-12-310000003570us-gaap:RelatedPartyMember2023-12-310000003570stpr:LA2024-01-012024-12-310000003570us-gaap:SubsequentEventMemberstpr:LA2025-01-012025-12-310000003570stpr:LA2024-12-310000003570us-gaap:DomesticCountryMember2024-12-310000003570us-gaap:StateAndLocalJurisdictionMember2024-12-310000003570us-gaap:RestrictedStockUnitsRSUMembersrt:MaximumMember2024-01-012024-12-310000003570us-gaap:PerformanceSharesMember2024-01-012024-12-310000003570us-gaap:PerformanceSharesMembersrt:MinimumMember2024-01-012024-12-310000003570us-gaap:PerformanceSharesMembersrt:MaximumMember2024-01-012024-12-310000003570lng:LiabilityAwardsMember2024-01-012024-12-310000003570lng:LiabilityAwardsMember2023-01-012023-12-310000003570lng:LiabilityAwardsMember2022-01-012022-12-310000003570lng:EquityAwardsMember2024-01-012024-12-310000003570lng:EquityAwardsMember2023-01-012023-12-310000003570lng:EquityAwardsMember2022-01-012022-12-310000003570lng:EquityClassifiedRestrictedStockUnitsMember2023-12-310000003570lng:LiabilityClassifiedRestrictedStockUnitsMember2023-12-310000003570lng:EquityClassifiedPerformanceStockUnitsMember2023-12-310000003570lng:LiabilityClassifiedPerformanceStockUnitsMember2023-12-310000003570lng:EquityClassifiedRestrictedStockUnitsMember2024-01-012024-12-310000003570lng:LiabilityClassifiedRestrictedStockUnitsMember2024-01-012024-12-310000003570lng:EquityClassifiedPerformanceStockUnitsMember2024-01-012024-12-310000003570lng:LiabilityClassifiedPerformanceStockUnitsMember2024-01-012024-12-310000003570lng:EquityClassifiedRestrictedStockUnitsMember2024-12-310000003570lng:LiabilityClassifiedRestrictedStockUnitsMember2024-12-310000003570lng:EquityClassifiedPerformanceStockUnitsMember2024-12-310000003570lng:LiabilityClassifiedPerformanceStockUnitsMember2024-12-310000003570us-gaap:RestrictedStockUnitsRSUMember2024-01-012024-12-310000003570us-gaap:PerformanceSharesMember2023-01-012023-12-310000003570us-gaap:PerformanceSharesMember2022-01-012022-12-310000003570us-gaap:SubsequentEventMember2025-01-282025-01-280000003570lng:A2045ConvertibleSeniorNotesMember2022-01-012022-12-310000003570lng:A2045ConvertibleSeniorNotesMember2022-12-3100000035702024-06-140000003570lng:BechtelEPCContractCorpusChristiStage3Memberlng:CorpusChristiLiquefactionMember2024-01-012024-12-310000003570lng:BechtelEPCContractCorpusChristiStage3Memberlng:CorpusChristiLiquefactionMember2024-12-310000003570lng:OtherConstructionAgreementsMember2024-01-012024-12-310000003570us-gaap:CustomerConcentrationRiskMemberus-gaap:SalesRevenueNetMember2022-01-012022-12-310000003570us-gaap:CustomerConcentrationRiskMemberus-gaap:SalesRevenueNetMember2023-01-012023-12-310000003570us-gaap:CustomerConcentrationRiskMemberus-gaap:SalesRevenueNetMember2024-01-012024-12-310000003570us-gaap:CustomerConcentrationRiskMemberlng:AccountsReceivableAndContractAssetsMember2023-01-012023-12-310000003570us-gaap:CustomerConcentrationRiskMemberlng:AccountsReceivableAndContractAssetsMember2024-01-012024-12-310000003570lng:MajorCustomerMemberus-gaap:CustomerConcentrationRiskMemberlng:AccountsReceivableAndContractAssetsMember2024-01-012024-12-310000003570lng:MajorCustomerMemberus-gaap:CustomerConcentrationRiskMemberlng:AccountsReceivableAndContractAssetsMember2023-01-012023-12-310000003570country:USus-gaap:GeographicConcentrationRiskMember2024-01-012024-12-310000003570country:USus-gaap:GeographicConcentrationRiskMember2023-01-012023-12-310000003570country:USus-gaap:GeographicConcentrationRiskMember2022-01-012022-12-310000003570country:SGus-gaap:GeographicConcentrationRiskMember2024-01-012024-12-310000003570country:SGus-gaap:GeographicConcentrationRiskMember2023-01-012023-12-310000003570country:SGus-gaap:GeographicConcentrationRiskMember2022-01-012022-12-310000003570country:IEus-gaap:GeographicConcentrationRiskMember2024-01-012024-12-310000003570country:IEus-gaap:GeographicConcentrationRiskMember2023-01-012023-12-310000003570country:IEus-gaap:GeographicConcentrationRiskMember2022-01-012022-12-310000003570country:GBus-gaap:GeographicConcentrationRiskMember2024-01-012024-12-310000003570country:GBus-gaap:GeographicConcentrationRiskMember2023-01-012023-12-310000003570country:GBus-gaap:GeographicConcentrationRiskMember2022-01-012022-12-310000003570country:KRus-gaap:GeographicConcentrationRiskMember2024-01-012024-12-310000003570country:KRus-gaap:GeographicConcentrationRiskMember2023-01-012023-12-310000003570country:KRus-gaap:GeographicConcentrationRiskMember2022-01-012022-12-310000003570country:ESus-gaap:GeographicConcentrationRiskMember2024-01-012024-12-310000003570country:ESus-gaap:GeographicConcentrationRiskMember2023-01-012023-12-310000003570country:ESus-gaap:GeographicConcentrationRiskMember2022-01-012022-12-310000003570country:INus-gaap:GeographicConcentrationRiskMember2024-01-012024-12-310000003570country:INus-gaap:GeographicConcentrationRiskMember2023-01-012023-12-310000003570country:INus-gaap:GeographicConcentrationRiskMember2022-01-012022-12-310000003570country:CHus-gaap:GeographicConcentrationRiskMember2024-01-012024-12-310000003570country:CHus-gaap:GeographicConcentrationRiskMember2023-01-012023-12-310000003570country:CHus-gaap:GeographicConcentrationRiskMember2022-01-012022-12-310000003570country:CNus-gaap:GeographicConcentrationRiskMember2024-01-012024-12-310000003570country:CNus-gaap:GeographicConcentrationRiskMember2023-01-012023-12-310000003570country:CNus-gaap:GeographicConcentrationRiskMember2022-01-012022-12-310000003570country:TWus-gaap:GeographicConcentrationRiskMember2024-01-012024-12-310000003570country:TWus-gaap:GeographicConcentrationRiskMember2023-01-012023-12-310000003570country:TWus-gaap:GeographicConcentrationRiskMember2022-01-012022-12-310000003570lng:OtherCountriesMemberus-gaap:GeographicConcentrationRiskMember2024-01-012024-12-310000003570lng:OtherCountriesMemberus-gaap:GeographicConcentrationRiskMember2023-01-012023-12-310000003570lng:OtherCountriesMemberus-gaap:GeographicConcentrationRiskMember2022-01-012022-12-3100000035702024-10-012024-12-31
UNITED STATES
SECURITIES AND EXCHANGE COMMISSION
Washington, D.C. 20549
FORM 10-K
☒ ANNUAL REPORT PURSUANT TO SECTION 13 OR 15(d) OF THE SECURITIES EXCHANGE ACT OF 1934
For the fiscal year ended December 31, 2024
or
☐ TRANSITION REPORT PURSUANT TO SECTION 13 OR 15(d) OF THE SECURITIES EXCHANGE ACT OF 1934
For the transition period from to
Commission file number 001-16383
CHENIERE ENERGY, INC.
(Exact name of registrant as specified in its charter)
| | | | | |
| Delaware | 95-4352386 |
| (State or other jurisdiction of incorporation or organization) | (I.R.S. Employer Identification No.) |
845 Texas Avenue, Suite 1250
Houston, Texas 77002
(Address of principal executive offices) (Zip Code)
(713) 375-5000
(Registrant’s telephone number, including area code)
Securities registered pursuant to Section 12(b) of the Act:
| | | | | | | | |
| Title of each class | Trading Symbol | Name of each exchange on which registered |
| Common Stock, $ 0.003 par value | LNG | New York Stock Exchange |
Securities registered pursuant to Section 12(g) of the Act: None
Indicate by check mark if the registrant is a well-known seasoned issuer, as defined in Rule 405 of the Securities Act. Yes ☒ No ☐
Indicate by check mark if the registrant is not required to file reports pursuant to Section 13 or Section 15(d) of the Act. Yes ☐ No ☒
Indicate by check mark whether the registrant (1) has filed all reports required to be filed by Section 13 or 15(d) of the Securities Exchange Act of 1934 during the preceding 12 months (or for such shorter period that the registrant was required to file such reports), and (2) has been subject to such filing requirements for the past 90 days. Yes ☒ No ☐
Indicate by check mark whether the registrant has submitted electronically every Interactive Data File required to be submitted pursuant to Rule 405 of Regulation S-T (§232.405 of this chapter) during the preceding 12 months (or for such shorter period that the registrant was required to submit such files). Yes ☒ No ☐
Indicate by check mark whether the registrant is a large accelerated filer, an accelerated filer, a non-accelerated filer, a smaller reporting company, or an emerging growth company. See the definitions of “large accelerated filer,” “accelerated filer,” “smaller reporting company” and “emerging growth company” in Rule 12b-2 of the Exchange Act.
| | | | | | | | | | | | | | | | | |
| Large accelerated filer | ☒ | | Accelerated filer | ☐ |
| Non-accelerated filer | ☐ | | Smaller reporting company | ☐ |
| | | | Emerging growth company | ☐ |
If an emerging growth company, indicate by check mark if the registrant has elected not to use the extended transition period for complying with any new or revised financial accounting standards provided pursuant to Section 13(a) of the Exchange Act. ☐
Indicate by check mark whether the registrant has filed a report on and attestation to its management’s assessment of the effectiveness of its internal control over financial reporting under Section 404(b) of the Sarbanes-Oxley Act (15 U.S.C. 7262(b)) by the registered public accounting firm that prepared or issued its audit report. ☒
If securities are registered pursuant to Section 12(b) of the Act, indicate by check mark whether the financial statements of the registrant included in the filing reflect the correction of an error to previously issued financial statements. ☐
Indicate by check mark whether any of those error corrections are restatements that required a recovery analysis of incentive-based compensation received by any of the registrant’s executive officers during the relevant recovery period pursuant to §240.10D-1(b). ☐
Indicate by check mark whether the registrant is a shell company (as defined in Rule 12b-2 of the Exchange Act). Yes ☐ No ☒
The aggregate market value of the registrant’s Common Stock held by non-affiliates of the registrant was approximately $39.4 billion as of June 30, 2024.
As of February 14, 2025, the issuer had 223,665,466 shares of Common Stock outstanding.
Documents incorporated by reference: The definitive proxy statement for the registrant’s Annual Meeting of Stockholders (to be filed within 120 days of the close of the registrant’s fiscal year) is incorporated by reference into Part III.
CHENIERE ENERGY, INC.
TABLE OF CONTENTS
DEFINITIONS
As used in this annual report, the terms listed below have the following meanings:
Common Industry and Other Terms
| | | | | | | | |
| ASU | | Accounting Standards Update |
| | |
| Bcf | | billion cubic feet |
| Bcf/d | | billion cubic feet per day |
| Bcf/yr | | billion cubic feet per year |
| Bcfe | | billion cubic feet equivalent |
| CAMT | | corporate alternative minimum tax |
| DAT | | delivered at terminal |
| DOE | | U.S. Department of Energy |
| EPC | | engineering, procurement and construction |
| ESG | | environmental, social and governance |
| FASB | | Financial Accounting Standards Board |
| FERC | | Federal Energy Regulatory Commission |
| FID | | final investment decision |
| FOB | | free-on-board |
| FTA countries | | countries with which the United States has a free trade agreement providing for national treatment for trade in natural gas |
| GAAP | | generally accepted accounting principles in the United States |
| Henry Hub | | the final settlement price (in U.S. dollars per MMBtu) for the New York Mercantile Exchange’s Henry Hub natural gas futures contract for the month in which a relevant cargo’s delivery window is scheduled to begin |
| IPM agreements | | integrated production marketing agreements in which the gas producer sells to us gas on a global LNG or natural gas index price, less a fixed liquefaction fee, shipping and other costs |
| LNG | | liquefied natural gas, a product of natural gas that, through a refrigeration process, has been cooled to a liquid state, which occupies a volume that is approximately 1/600th of its gaseous state |
| MMBtu | | million British thermal units; one British thermal unit measures the amount of energy required to raise the temperature of one pound of water by one degree Fahrenheit |
| mtpa | | million tonnes per annum |
| | |
| non-FTA countries | | countries with which the United States does not have a free trade agreement providing for national treatment for trade in natural gas and with which trade is permitted |
| SEC | | U.S. Securities and Exchange Commission |
| SOFR | | Secured Overnight Financing Rate |
| SPA | | LNG sale and purchase agreement |
| TBtu | | trillion British thermal units; one British thermal unit measures the amount of energy required to raise the temperature of one pound of water by one degree Fahrenheit |
| Tcf | | trillion cubic feet |
| Train | | an industrial facility comprised of a series of refrigerant compressor loops used to cool natural gas into LNG |
| TUA | | terminal use agreement |
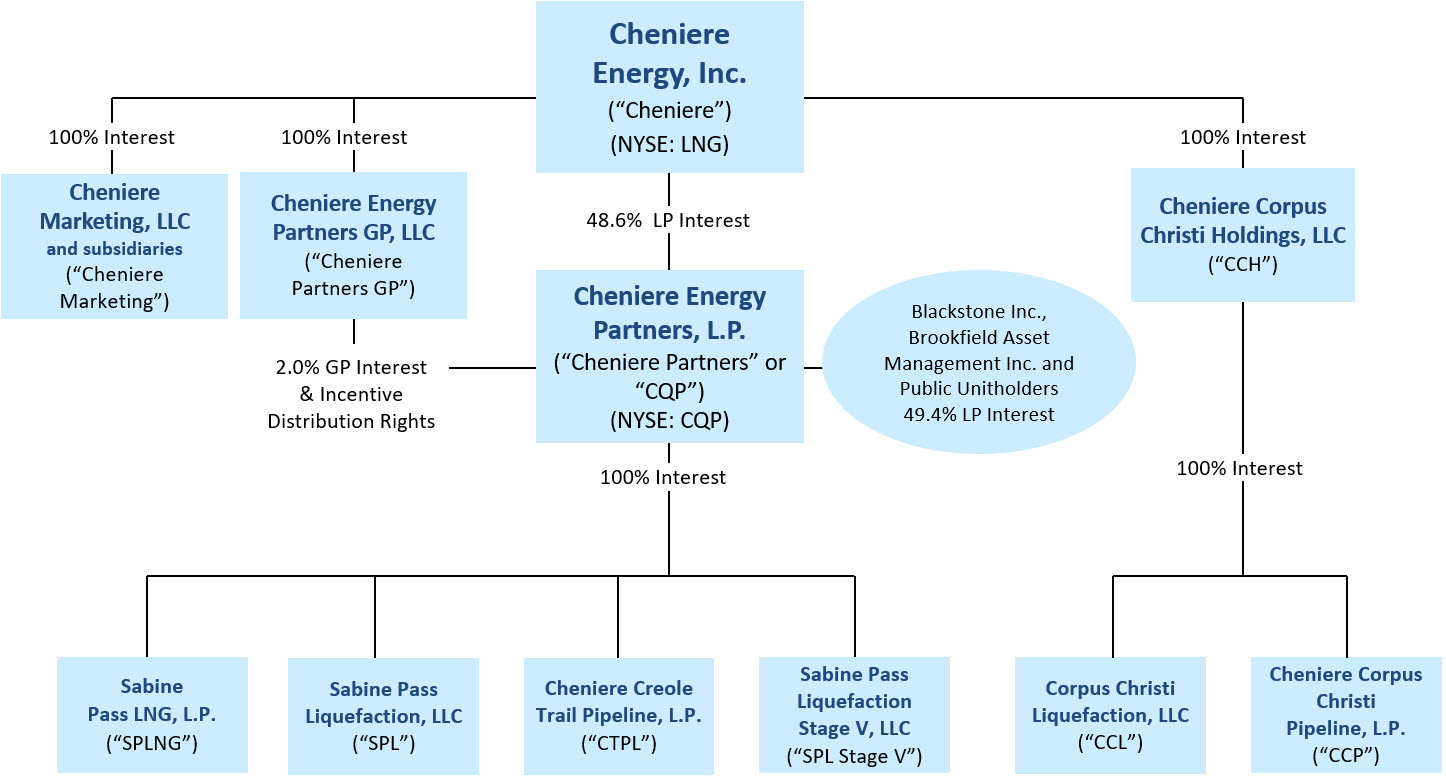
Abbreviated Legal Entity Structure
The following diagram depicts our abbreviated legal entity structure as of December 31, 2024, including our ownership of certain subsidiaries, and the references to these entities used in this annual report:
Unless the context requires otherwise, references to the “Company,” “we,” “us” and “our” refer to Cheniere Energy, Inc. and its consolidated subsidiaries, including our publicly traded subsidiary, CQP.
CAUTIONARY STATEMENT
REGARDING FORWARD-LOOKING STATEMENTS
This annual report contains certain statements that are, or may be deemed to be, “forward-looking statements” within the meaning of Section 27A of the Securities Act of 1933, as amended (the “Securities Act”), and Section 21E of the Securities Exchange Act of 1934, as amended (the “Exchange Act”). All statements, other than statements of historical or present facts or conditions, included herein or incorporated herein by reference are “forward-looking statements.” Included among “forward-looking statements” are, among other things:
•statements that we expect to commence or complete construction of our proposed LNG terminals, liquefaction facilities, pipeline facilities or other projects, or any expansions or portions thereof, by certain dates, or at all;
•statements regarding future levels of domestic and international natural gas production, supply or consumption or future levels of LNG imports into or exports from North America and other countries worldwide or purchases of natural gas, regardless of the source of such information, or the transportation or other infrastructure or demand for and prices related to natural gas, LNG or other hydrocarbon products;
•statements regarding any financing transactions or arrangements, or our ability to enter into such transactions;
•statements relating to Cheniere’s capital deployment, including intent, ability, extent and timing of capital expenditures, debt repayment, dividends, share repurchases and execution on the capital allocation plan;
•statements regarding our future sources of liquidity and cash requirements;
•statements relating to the construction of our Trains and pipelines, including statements concerning the engagement of any EPC contractor or other contractor and the anticipated terms and provisions of any agreement with any EPC or other contractor, and anticipated costs related thereto;
•statements regarding any SPA or other agreement to be entered into or performed substantially in the future, including any revenues anticipated to be received and the anticipated timing thereof, and statements regarding the amounts of total LNG regasification, natural gas liquefaction or storage capacities that are, or may become, subject to contracts;
•statements regarding counterparties to our commercial contracts, construction contracts and other contracts;
•statements regarding our planned development and construction of additional Trains or pipelines, including the financing of such Trains or pipelines;
•statements that our Trains, when completed, will have certain characteristics, including amounts of liquefaction capacities;
•statements regarding our business strategy, our strengths, our business and operation plans or any other plans, forecasts, projections, or objectives, including anticipated revenues, capital expenditures, maintenance and operating costs and cash flows, any or all of which are subject to change;
•statements relating to our goals, commitments and strategies in relation to environmental matters;
•statements regarding legislative, governmental, regulatory, administrative or other public body actions, approvals, requirements, permits, applications, filings, investigations, proceedings or decisions;
•statements regarding our anticipated LNG and natural gas marketing activities;
•any other statements that relate to non-historical or future information; and
All of these types of statements, other than statements of historical or present facts or conditions, are forward-looking statements. In some cases, forward-looking statements can be identified by terminology such as “may,” “will,” “could,” “should,” “achieve,” “anticipate,” “believe,” “contemplate,” “continue,” “estimate,” “expect,” “intend,” “plan,” “potential,” “predict,” “project,” “pursue,” “target,” the negative of such terms or other comparable terminology. The forward-looking statements contained in this annual report are largely based on our expectations, which reflect estimates and assumptions made by our management. These estimates and assumptions reflect our best judgment based on currently known market conditions and other factors. Although we believe that such estimates are reasonable, they are inherently uncertain and involve a number of risks and uncertainties beyond our control. In addition, assumptions may prove to be inaccurate. We caution that the forward-looking statements contained in this annual report are not guarantees of future performance and that such statements may not be realized or the forward-looking statements or events may not occur. Actual results may differ materially from those anticipated or implied in forward-looking statements as a result of a variety of factors described in this annual report and in the other reports and other information that we file with the SEC. All forward-looking statements attributable to us or persons acting on our behalf are expressly qualified in their entirety by these risk factors. These forward-looking statements speak only
CAUTIONARY STATEMENT
REGARDING FORWARD-LOOKING STATEMENTS
as of the date made, and other than as required by law, we undertake no obligation to update or revise any forward-looking statement or provide reasons why actual results may differ, whether as a result of new information, future events or otherwise.
PART I
ITEMS 1. AND 2. BUSINESS AND PROPERTIES
General
Cheniere, a Delaware corporation, is a Houston-based energy infrastructure company primarily engaged in LNG-related businesses. We provide clean, secure and affordable LNG to integrated energy companies, utilities and energy trading companies around the world. We aspire to conduct our business in a safe and responsible manner, delivering a reliable, competitive and integrated source of LNG to our customers.
LNG is natural gas (methane) in liquid form. The LNG we produce is shipped all over the world, converted back into natural gas (called “regasification”) and then transported via pipeline to homes and businesses and used as an energy source that is essential for heating, cooking, other industrial uses and back up for intermittent energy sources. Natural gas is a cleaner-burning, abundant and affordable source of energy. When LNG is converted back to natural gas, it can be used instead of coal, which reduces the amount of pollution traditionally produced from burning fossil fuels, like sulfur dioxide and particulate matter that enters the air we breathe. Additionally, compared to coal, it produces significantly fewer carbon emissions. By liquefying natural gas, we are able to reduce its volume by 600 times so that we can load it onto special LNG carriers designed to keep the LNG cold and in liquid form for efficient transport overseas.
We are the largest producer of LNG in the United States and we are the second largest LNG operator globally, based on the total production capacity of our liquefaction facilities, which totaled approximately 45 mtpa as of December 31, 2024.
We own and operate a natural gas liquefaction and export facility located in Cameron Parish, Louisiana at Sabine Pass (the “Sabine Pass LNG Terminal”), one of the largest LNG production facilities in the world, through our ownership interest in and management agreements with CQP, which is a publicly traded limited partnership that we formed in 2007. As of December 31, 2024, we owned 100% of the general partner interest, a 48.6% limited partner interest and 100% of the incentive distribution rights of CQP. The Sabine Pass LNG Terminal has six operational Trains, for a total production capacity of approximately 30 mtpa of LNG (the “SPL Project”). The Sabine Pass LNG Terminal also has operational regasification facilities that include five LNG storage tanks with aggregate capacity of approximately 17 Bcfe and vaporizers with regasification capacity of approximately 4 Bcf/d, as well as three marine berths, two of which can accommodate vessels with nominal capacity of up to 266,000 cubic meters and the third berth which can accommodate vessels with nominal capacity of up to 200,000 cubic meters. We also own and operate through CQP a 94-mile natural gas supply pipeline that interconnects the Sabine Pass LNG Terminal with several large interstate and intrastate pipelines (the “Creole Trail Pipeline”).
Additionally, we own and operate a natural gas liquefaction and export facility located near Corpus Christi, Texas (the “Corpus Christi LNG Terminal”) through CCL, which has natural gas liquefaction facilities consisting of three operational Trains for a total production capacity of approximately 15 mtpa of LNG, three LNG storage tanks with aggregate capacity of approximately 10 Bcfe and two marine berths that can each accommodate vessels with nominal capacity of up to 266,000 cubic meters. We are constructing an expansion of the Corpus Christi LNG Terminal (the “Corpus Christi Stage 3 Project”) consisting of seven midscale Trains with an expected total production capacity of over 10 mtpa of LNG. We also own and operate through CCP an approximately 21-mile natural gas supply pipeline that interconnects the Corpus Christi LNG Terminal with several large interstate and intrastate natural gas pipelines (the “Corpus Christi Pipeline” and together with the existing assets at the Corpus Christi LNG Terminal and the Corpus Christi Stage 3 Project, the “CCL Project”).
Our long-term counterparty arrangements form the foundation of our business and provide us with significant, stable, long-term cash flows, and include SPAs, in which our customers are generally required to pay a fixed fee with respect to the contracted volumes irrespective of their election to cancel or suspend deliveries of LNG cargoes, and IPM agreements, in which a gas producer sells natural gas to us on a global LNG or natural gas index price, less a fixed liquefaction fee, shipping and other costs. The SPAs also have a variable fee component, which is primarily indexed to Henry Hub and generally structured to cover the cost of natural gas purchases, transportation and liquefaction fuel consumed to produce LNG. Since we procure most of our feedstock for LNG production from the U.S., the structure of these contracts helps limit our exposure to fluctuations in U.S. natural gas prices. Through our SPAs and IPM agreements currently in effect, with approximately 15 years of weighted average remaining life as of December 31, 2024, we have contracted approximately 95% of the total anticipated production from the SPL Project and the CCL Project (collectively, the “Liquefaction Projects”) through the mid-2030s, excluding volumes from contracts with terms less than 10 years and volumes that are contractually subject to additional
liquefaction capacity beyond what is currently in construction or operation. LNG produced by the Liquefaction Projects that is not contracted under long-term contracts is available for Cheniere Marketing, our integrated marketing function, to sell in the global market under spot sales or other short-term agreements.
We remain focused on safety, operational excellence and customer satisfaction. Increasing demand for LNG has allowed us to expand our liquefaction infrastructure in a financially disciplined manner. We have increased available liquefaction capacity at our Liquefaction Projects as a result of debottlenecking and other optimization projects. We believe these factors provide a foundation for additional growth in our portfolio of customer contracts in the future. We hold significant land positions at both the Sabine Pass LNG Terminal and the Corpus Christi LNG Terminal, which provide opportunity for further liquefaction capacity expansion. In March 2023, certain of our subsidiaries submitted an application with the FERC under the Natural Gas Act of 1938, as amended (the “NGA”), for an expansion adjacent to the CCL Project consisting of two midscale Trains with an expected total production capacity of approximately 3 mtpa of LNG (the “CCL Midscale Trains 8 & 9 Project”), for which a positive Environmental Assessment from the FERC was received in June 2024. Additionally, we are developing an expansion adjacent to the SPL Project with a total production capacity of up to approximately 20 mtpa of LNG, inclusive of estimated debottlenecking opportunities (the “SPL Expansion Project”). In February 2024, certain subsidiaries of CQP submitted an application to the FERC under the NGA for authorization to site, construct and operate the SPL Expansion Project, as well as an application to the DOE requesting authorization to export LNG to FTA countries and non-FTA countries, both of which applications exclude debottlenecking. In October 2024, the authorization from the DOE to export LNG to FTA countries was received. The development of the CCL Midscale Trains 8 & 9 Project, the SPL Expansion Project or other projects, including infrastructure projects in support of natural gas supply and LNG demand, will require, among other things, acceptable commercial and financing arrangements before we make a positive FID.
Our Business Strategy
Our primary business strategy is to be a full-service LNG provider to worldwide end-use customers. We accomplish this objective by owning, constructing and operating LNG and natural gas infrastructure facilities to meet our long-term customers’ energy demands and:
•safely, efficiently and reliably operating and maintaining our assets;
•procuring natural gas and pipeline transport capacity to our facilities;
•providing value to our customers through destination flexibility, options not to lift cargoes and diversity of price and geography;
•continuing to secure long-term customer contracts to support our planned expansion, including the FID of potential expansion projects beyond the Corpus Christi Stage 3 Project;
•completing our construction projects safely, on-time and on-budget;
•maximizing the production of LNG to serve our customers and generating steady and stable revenues and operating cash flows;
•maintaining a flexible capital structure to finance the acquisition, development, construction and operation of the energy assets needed to supply our customers;
•executing our “all of the above” capital allocation strategy, focused on strengthening our balance sheet, funding financially disciplined growth and returning capital to our stockholders; and
•strategically identifying actionable and economic environmental solutions.
Our Business
We shipped our first LNG cargo in February 2016 and as of February 14, 2025, approximately 3,930 cumulative LNG cargoes totaling approximately 270 million tonnes of LNG have been produced, loaded and exported from the Liquefaction Projects. Our LNG has been shipped to 41 countries and regions around the world.
Below is a discussion of our operations. For further discussion of our contractual obligations and cash requirements related to these operations, refer to Liquidity and Capital Resources in Item 7. Management’s Discussion and Analysis of Financial Condition and Results of Operations.
Sabine Pass LNG Terminal
Liquefaction Facilities and Expansion Project
The Sabine Pass LNG Terminal, as described above under the caption General, is one of the largest LNG production facilities in the world with six Trains, five storage tanks and three marine berths. In February 2024, certain subsidiaries of CQP submitted an application to the FERC under the NGA for authorization to site, construct and operate the SPL Expansion Project, as well as an application to the DOE requesting authorization to export LNG to FTA countries and non-FTA countries, both of which applications exclude debottlenecking. In October 2024, the authorization from the DOE to export LNG to FTA countries was received for the SPL Expansion Project.
The following summarizes the volumes of natural gas for which we have received approvals from the FERC to site, construct and operate the Trains at the SPL Project and the orders we have received from the DOE authorizing the export of domestically produced LNG by vessel from the Sabine Pass LNG Terminal through December 31, 2050:
| | | | | | | | | | | | | | | | | | | | | | | |
| FERC Approved Volume | | DOE Approved Volume |
| (in Bcf/yr) | | (in mtpa) | | (in Bcf/yr) | | (in mtpa) |
| FTA countries (1) | 1,661.94 | | 33 | | 1,661.94 | | 33 |
| Non-FTA countries | 1,661.94 | | 33 | | 1,661.94 | | 33 |
(1)Excludes 899 Bcf/yr to FTA countries authorized in October 2024 for the SPL Expansion Project that is not effective until the date of first commercial export from the SPL Expansion Project.
Natural Gas Supply, Transportation and Storage
SPL has secured natural gas feedstock for the SPL Project through long-term natural gas supply agreements, including an IPM agreement. SPL Stage V also has an IPM agreement to supply the SPL Expansion Project, subject to Cheniere making a positive FID on the first train of the SPL Expansion Project. Additionally, to ensure that SPL is able to transport and manage the natural gas feedstock to the Sabine Pass LNG Terminal, it has transportation precedent and other agreements to secure firm pipeline transportation and storage capacity from third parties and CTPL.
Regasification Facilities
The Sabine Pass LNG Terminal, as described above under the caption General, has operational regasification capacity of approximately 4 Bcf/d and aggregate LNG storage capacity of approximately 17 Bcfe. SPLNG has a long-term, third party TUA for 1 Bcf/d with TotalEnergies Gas & Power North America, Inc. (“TotalEnergies”), under which TotalEnergies is required to pay fixed monthly fees, whether or not it uses the regasification capacity it has reserved. Prior to its cancellation effective December 31, 2022, SPLNG also had a TUA for 1 Bcf/d with Chevron U.S.A. Inc. (“Chevron”). Approximately 2 Bcf/d of the remaining capacity has been reserved under a TUA by SPL, which also has a partial TUA assignment agreement with TotalEnergies, as further described in Note 12—Revenues of our Notes to Consolidated Financial Statements.
Corpus Christi LNG Terminal
Liquefaction Facilities and Expansion Projects
The Corpus Christi LNG Terminal, as described above under the caption General, includes three Trains, three storage tanks, two marine berths and the construction of the Corpus Christi Stage 3 Project with seven midscale Trains. Additionally, in March 2023, certain of our subsidiaries submitted an application with the FERC under the NGA for the CCL Midscale Trains 8 & 9 Project, for which a positive Environmental Assessment from the FERC was received in June 2024. We expect to receive all remaining necessary regulatory approvals for the project in 2025.
The following table summarizes the project completion and construction status of the Corpus Christi Stage 3 Project as of December 31, 2024:
| | | | | | | | | | | |
| | |
| Overall project completion percentage | | 77.2% |
| Completion percentage of: | | |
| Engineering | | 97.2% |
| Procurement | | 97.2% |
| Subcontract work | | 88.2% |
| Construction | | 42.6% |
| Date of expected substantial completion | | 1H 2025 - 2H 2026 |
The following summarizes the volumes of natural gas for which we have received approvals from the FERC to site, construct and operate the Trains at the CCL Project and the orders we have received from the DOE authorizing the export of domestically produced LNG by vessel from the Corpus Christi LNG Terminal through December 31, 2050:
| | | | | | | | | | | | | | | | | | | | | | | |
| FERC Approved Volume | | DOE Approved Volume (1) |
| (in Bcf/yr) | | (in mtpa) | | (in Bcf/yr) | | (in mtpa) |
| Trains 1 through 3 of the CCL Project: | | | | | | | |
| FTA countries | 875.16 | | 17 | | 875.16 | | 17 |
| Non-FTA countries | 875.16 | | 17 | | 875.16 | | 17 |
| Corpus Christi Stage 3 Project: | | | | | | | |
| FTA countries | 582.14 | | 11.45 | | 582.14 | | 11.45 |
| Non-FTA countries | 582.14 | | 11.45 | | 582.14 | | 11.45 |
(1)Excludes 170 Bcf/yr to FTA countries authorized in July 2023 for the CCL Midscale Trains 8 & 9 Project that is not effective until the date of first commercial export from the CCL Midscale Trains 8 & 9 Project.
Natural Gas Supply, Transportation and Storage
CCL has secured natural gas feedstock for the Corpus Christi LNG Terminal through long-term natural gas supply agreements, including IPM agreements. Additionally, to ensure that CCL is able to transport and manage the natural gas feedstock to the Corpus Christi LNG Terminal, it has transportation precedent and other agreements to secure firm pipeline transportation and storage capacity from third parties and CCP.
Marketing
LNG produced by the Liquefaction Projects that is not contracted under long-term contracts is available for Cheniere Marketing, our integrated marketing function, to sell in the global market under spot sales or other short-term agreements.
Major Customers
We did not have any customers accounting for 10% or more of total consolidated revenues for the year ended December 31, 2024.
Governmental Regulation
Our LNG terminals and pipelines are subject to extensive regulation under federal, state and local statutes, rules, regulations and laws. These laws require that we engage in consultations with appropriate federal and state agencies and that we obtain and maintain applicable permits and other authorizations. These rigorous regulatory requirements increase the cost of construction and operation, and failure to comply with such laws could result in substantial penalties and/or loss of necessary authorizations.
Federal Energy Regulatory Commission
The design, construction, operation, maintenance and expansion of our liquefaction facilities, the import or export of LNG and the purchase and transportation of natural gas in interstate commerce through our pipelines are highly regulated activities subject to the jurisdiction of the FERC pursuant to the NGA. Under the NGA, the FERC’s jurisdiction generally extends to the transportation of natural gas in interstate commerce, to the sale for resale of natural gas in interstate commerce, to natural gas companies engaged in such transportation or sale and to the construction, operation, maintenance and expansion of LNG terminals and interstate natural gas pipelines.
The FERC’s authority to regulate interstate natural gas pipelines and the services that they provide generally includes regulation of:
•rates and charges, and terms and conditions for natural gas transportation, storage and related services;
•the certification and construction of new facilities and modification of existing facilities;
•the extension and abandonment of services and facilities;
•the administration of accounting and financial reporting regulations, including the maintenance of accounts and records;
•the acquisition and disposition of facilities;
•the initiation and discontinuation of services; and
•various other matters.
Under the NGA, our pipelines are not permitted to unduly discriminate or grant undue preference as to rates or the terms and conditions of service to any shipper, including our own marketing affiliates. Those rates, terms and conditions must be public, and on file with the FERC. In contrast to pipeline regulation, the FERC does not require LNG terminal owners to provide open-access services at cost-based or regulated rates. Although the provisions that codified the FERC’s policy in this area expired on January 1, 2015, we see no indication that the FERC intends to change its policy in this area. On February 18, 2022, the FERC updated its 1999 Policy Statement on certification of new interstate natural gas facilities and the framework for the FERC’s decision-making process, modifying the standards that the FERC uses to evaluate applications to include, among other things, reasonably foreseeable greenhouse gas (“GHG”) emissions that may be attributable to the project and the project’s impact on environmental justice communities. On March 24, 2022, the FERC rescinded the Policy Statement, re-issued it as a draft and it remains pending. At this time, we do not expect it to have a material adverse effect on our operations.
We are permitted to make sales of natural gas for resale in interstate commerce pursuant to a blanket marketing certificate granted by the FERC with the issuance of our Certificate of Public Convenience and Necessity to our marketing affiliates. Our sales of natural gas will be affected by the availability, terms and cost of pipeline transportation. As noted above, the price and terms of access to pipeline transportation are subject to extensive federal and state regulation.
In order to site, construct and operate our LNG terminals, we received and are required to maintain authorizations from the FERC under Section 3 of the NGA as well as other material governmental and regulatory approvals and permits. The Energy Policy Act of 2005 (the “EPAct”) amended Section 3 of the NGA to establish or clarify the FERC’s exclusive authority to approve or deny an application for the siting, construction, expansion or operation of LNG terminals, unless specifically provided otherwise in the EPAct amendments to the NGA. For example, nothing in the EPAct amendments to the NGA were intended to affect otherwise applicable law related to any other federal agency’s authorities or responsibilities related to LNG terminals or those of a state acting under federal law.
In February 2024, certain subsidiaries of CQP submitted an application to the FERC under the NGA for authorization to site, construct and operate the SPL Expansion Project. In March 2023, certain of our subsidiaries submitted an application with the FERC under the NGA for the CCL Midscale Trains 8 & 9 Project, for which a positive Environmental Assessment from the FERC was received in June 2024.
The FERC’s Standards of Conduct apply to interstate pipelines that conduct transmission transactions with an affiliate that engages in natural gas marketing functions. The general principles of the FERC Standards of Conduct are: (1) independent functioning, which requires transmission function employees to function independently of marketing function employees; (2)
no-conduit rule, which prohibits passing transmission function information to marketing function employees; and (3) transparency, which imposes posting requirements to detect undue preference due to the improper disclosure of non-public transmission function information. We have established the required policies, procedures and training to comply with the FERC’s Standards of Conduct.
All of our FERC construction, operation, reporting, accounting and other regulated activities are subject to audit by the FERC, which may conduct routine or special inspections and issue data requests designed to ensure compliance with FERC rules, regulations, policies and procedures. The FERC’s jurisdiction under the NGA allows it to impose civil and criminal penalties for any violations of the NGA and any rules, regulations or orders of the FERC up to approximately $1.5 million per day per violation, including any conduct that violates the NGA’s prohibition against market manipulation.
Several other governmental and regulatory approvals and permits are required throughout the life of our LNG terminals and our pipelines. In addition, our FERC orders require us to comply with certain ongoing conditions and reporting obligations and maintain other regulatory agency approvals throughout the life of our facilities. For example, throughout the life of our LNG terminals and our pipelines, we are subject to regular reporting requirements to the FERC, the Department of Transportation’s (“DOT”) Pipeline and Hazardous Materials Safety Administration (“PHMSA”) and applicable federal and state regulatory agencies regarding the operation and maintenance of our facilities. To date, we have been able to obtain and maintain required approvals as needed, and the need for these approvals and reporting obligations has not materially affected our construction or operations.
DOE Export Licenses
The DOE has authorized the export of domestically produced LNG by vessel from the Sabine Pass LNG Terminal, as discussed in Sabine Pass LNG Terminal—Liquefaction Facilities, and the Corpus Christi LNG Terminal, as discussed in Corpus Christi LNG Terminal—Liquefaction Facilities. Although it is not expected to occur, the loss of an export authorization could be a force majeure event under our SPAs.
Under Section 3 of the NGA, applications for exports of natural gas (including LNG) to FTA countries, which allow for national treatment for trade in natural gas, are “deemed to be consistent with the public interest” and shall be granted by the DOE without “modification or delay.” FTA countries currently recognized by the DOE for exports of LNG include Australia, Bahrain, Canada, Chile, Colombia, Dominican Republic, El Salvador, Guatemala, Honduras, Jordan, Mexico, Morocco, Nicaragua, Oman, Panama, Peru, Republic of Korea and Singapore. FTAs with Israel and Costa Rica do not require national treatment for trade in natural gas. Applications for export of LNG to non-FTA countries are considered by the DOE in a notice and comment proceeding whereby the public and other interveners are provided the opportunity to comment and may assert that such authorization would not be consistent with the public interest. In January 2024, the Biden Administration announced a temporary pause on pending decisions on exports of LNG to non-FTA countries until the DOE can update the underlying analyses for authorizations, which did not have a material adverse effect on our business, contracts, financial condition, operating results, cash flow, or liquidity for the year ended December 31, 2024. The DOE publicly released the updated analyses on December 17, 2024, and has solicited public comments on the analyses. On January 20, 2025, President Trump signed an Executive Order revoking the Biden Administration pause and extending the time for public comment. We do not expect the publication of the analyses to have a material effect on future DOE non-FTA export authorizations. We currently have the SPL Expansion Project and the CCL Midscale Trains 8 & 9 Project pending non-FTA export approval with the DOE. However, the outstanding DOE approvals for these projects are first subject to the receipt of regulatory permit approval from the FERC, responsive to our formal applications. See Sabine Pass LNG Terminal and Corpus Christi LNG Terminal sections above for FERC and DOE approved volumes on our existing Liquefaction Projects.
Pipeline and Hazardous Materials Safety Administration
Our LNG terminals as well as the Creole Trail Pipeline and the Corpus Christi Pipeline are subject to regulation by PHMSA. PHMSA is authorized by the applicable pipeline safety laws to establish minimum safety standards for certain pipelines and LNG facilities. The regulatory standards PHMSA has established are applicable to the design, installation, testing, construction, operation, maintenance and management of natural gas and hazardous liquid pipeline facilities and LNG facilities that affect interstate or foreign commerce. PHMSA has also established training, worker qualification and reporting requirements.
PHMSA performs inspections of pipeline and LNG facilities and has authority to undertake enforcement actions, including issuance of civil penalties up to approximately $273,000 per day per violation, with a maximum administrative civil penalty of approximately $2.7 million for any related series of violations.
Other Governmental Permits, Approvals and Authorizations
Construction and operation of our facilities require additional permits, orders, approvals and consultations to be issued by various federal and state agencies, including the DOT, U.S. Army Corps of Engineers (“USACE”), U.S. Department of Commerce, National Marine Fisheries Service, U.S. Department of the Interior, U.S. Fish and Wildlife Service, the U.S. Environmental Protection Agency (the “EPA”), U.S. Department of Homeland Security, the Louisiana Department of Environmental Quality (the “LDEQ”), the Texas Commission on Environmental Quality (“TCEQ”) and the Railroad Commission of Texas.
The USACE issues its permits under the authority of the Clean Water Act (“CWA”) (Section 404) and the Rivers and Harbors Act (Section 10). The EPA administers the Clean Air Act (“CAA”), and has delegated authority to the TCEQ and LDEQ to issue the Title V Operating Permit and the Prevention of Significant Deterioration Permit. These two permits are issued by the LDEQ for the Sabine Pass LNG Terminal and CTPL and by the TCEQ for the CCL Project.
Commodity Futures Trading Commission (“CFTC”)
The Dodd-Frank Wall Street Reform and Consumer Protection Act (the “Dodd-Frank Act”) amended the Commodity Exchange Act to provide for federal regulation of the over-the-counter derivatives market and entities, such as us, that participate in those markets. The CFTC has enacted a number of regulations pursuant to the Dodd-Frank Act.
As required by the Dodd-Frank Act, the CFTC and federal banking regulators also adopted rules requiring swap dealers (as defined in the Dodd-Frank Act), including those that are regulated financial institutions, to collect initial and/or variation margin with respect to uncleared swaps from their counterparties that are financial end users, registered swap dealers or major swap participants. These rules do not require collection of margin from non-financial-entity end users who qualify for the end user exception from the mandatory clearing requirement or from non-financial end users or certain other counterparties in certain instances. We qualify as a non-financial-entity end user with respect to the swaps that we enter into to hedge our commercial risks.
Pursuant to the Dodd-Frank Act, the CFTC adopted additional anti-manipulation and anti-disruptive trading practices regulations that prohibit, among other things, manipulative, deceptive or fraudulent schemes or material misrepresentation in the futures, options, swaps and cash markets. In addition, separate from the Dodd-Frank Act, our use of futures and options on commodities is subject to the Commodity Exchange Act and CFTC regulations, as well as the rules of futures exchanges on which any of these instruments are executed. Should we violate any of these laws and regulations, we could be subject to a CFTC or an exchange enforcement action and material penalties, possibly resulting in changes in the rates we can charge.
United Kingdom / European Regulations
Our European trading activities, which are primarily established in and operated out of the United Kingdom (“U.K.”), are subject to a number of European Union (“EU”) and U.K. laws and regulations, including but not limited to:
•the European Market Infrastructure Regulation, which was designed to increase the transparency and stability of the European Economic Area (“EEA”) derivatives markets;
•the Regulation on Wholesale Energy Market Integrity and Transparency (“REMIT”), which prohibits market manipulation and insider trading in EEA wholesale energy markets and imposes various transparency and other obligations on participants active in these markets;
•the Markets in Financial Instruments Directive and Regulation (“MiFID II”), which sets forth a financial services framework across the EEA, including rules for firms engaging in investment services and activities in connection with certain financial instruments, including a range of commodity derivatives; and
•the Market Abuse Regulation, which was implemented to create an enhanced market abuse framework, and which applies generally to all financial instruments listed or traded on EEA trading venues (“Traded Instruments”) as
well as other over-the-counter financial instruments priced on, or impacting, the price or value of the Traded Instrument.
Following the U.K.'s departure from the EU (“Brexit”), the EU-wide rules that applied to the U.K. while it was a member of the EU (and during the transition period) have been replicated, subject to certain amendments, to create a parallel set of rules applicable only in the U.K. As a result, we are subject to two separate sets of rules based on the same underlying legislation: (i) one set of rules that apply in the EEA (i.e. not including the U.K.) (the “EEA Rules”); and (ii) one set of rules that apply only in the U.K. (the “U.K. Onshored Rules”). We increasingly are seeing divergence between the EEA Rules and the U.K. Onshored Rules albeit not in a way which is expected to materially impact our business at this time.
To the extent our trading activities have a nexus with the EEA, we comply with the EEA Rules. However, as our trading activities are primarily operated out of the U.K., the main rules that impact and apply to us on a day-to-day basis are the U.K. Onshored Rules.
In particular, under the U.K. Onshored Rules, firms engaging in investment services and activities under U.K. MiFID II must be authorized unless an exemption applies. We meet the criteria for an exemption and therefore do not need to be authorized under U.K. MiFID II.
In addition to the U.K. Onshored Rules, we are also subject to a separate, U.K.-specific regime that is not based on prior EU/EEA legislation. This is primarily set out in the U.K.’s Financial Services and Markets Act 2000 (“FSMA”) and Financial Services and Markets Act 2000 (Regulated Activities) Order 2001 (“RAO”), which, among other things, governs the regulation of financial services and markets in the U.K., and contains a definitive list of the specified kinds of activities and products that are regulated. Under these U.K.-specific rules, a firm engaging in regulated activities must be authorized unless an exclusion applies. We qualify under applicable exclusions and therefore are not required to be authorized under the U.K. FSMA/RAO regime.
In December 2022, the EU enacted regulations, which among other things established a market correction mechanism against excessively high LNG prices, volatility and movements, and provided for the collection of information though new reporting obligations that would be utilized to provide for a new LNG pricing assessment/benchmark. The applicable regulations are set forth in Council Regulation (EU) 2022/2576-2581. However, these were temporary rules which have subsequently expired and been replaced by new, yet substantively identical, permanent rules that are within the scope of the recast REMIT regulation which came into effect in May 2024. The impact of such regulations on our business remains uncertain, but is not expected to be material.
Violation of the foregoing laws and regulations could result in investigations, possible fines and penalties, and in some scenarios, criminal offenses, as well as reputational damage.
Brexit and Equivalence
As referenced above, the U.K. ceased to be a member of the EU on January 31, 2020. On December 24, 2020, the EU and the U.K. reached an agreement in principle on the terms of certain agreements and declarations governing the ongoing relationship between the EU and the U.K., including the EU-U.K. Trade and Cooperation Agreement (the “TCA”). The TCA provisionally applied from January 1, 2021, and entered into force on May 1, 2021. The TCA is limited in its scope; in particular the TCA does not make any meaningful provision for the financial services sector. For example, the TCA does not meaningfully address equivalence. Uncertainties remain relating to certain aspects of the U.K.’s future economic, trading and legal relationships with the EU and with other countries. As a result, we separately monitor and ensure compliance with all applicable U.K. and EU rules.
The Financial Services and Markets Act 2023 (“FSMA 2023”) came into U.K. law in June 2023. FSMA 2023 is the framework for the U.K.’s post-Brexit financial legislative and regulatory landscape. It is intended to provide the foundations for a significant overhaul and re-structuring of the U.K. financial services and markets regimes, with many of its measures being intended to address issues and points arising from Brexit. The changes include the revocation of retained EU laws, the introduction of new powers and objectives for the regulators of such markets, as well as a number of measures relevant to financial market infrastructure operators and market participants. Changes will be implemented pursuant to subsidiary legislation or directly by regulators. However, at this time it is not possible to determine whether any such actions would have a material impact on our business.
Environmental Regulation
Our LNG terminals are subject to various federal, state and local laws and regulations relating to the protection of the environment and natural resources. These environmental laws and regulations can affect the cost and output of operations and may impose substantial penalties for non-compliance and substantial liabilities for pollution, as further described in the risk factor Existing and future safety, environmental and similar laws and governmental regulations could result in increased compliance costs or additional operating costs or construction costs and restrictions in Risks Relating to Regulations within Item 1A. Risk Factors. Many of these laws and regulations, such as those noted below, restrict or prohibit impacts to the environment or the types, quantities and concentration of substances that can be released into the environment and can lead to substantial administrative, civil and criminal fines and penalties for non-compliance.
Clean Air Act
Our LNG terminals are subject to the federal CAA and comparable state and local laws. We may be required to incur certain capital expenditures over the next several years for air pollution control equipment in connection with maintaining or obtaining permits and approvals addressing air emission-related issues. However, we do not believe any such requirements will have a material adverse effect on our operations, or the construction and operations of our Liquefaction Projects.
On February 28, 2022, the EPA removed a stay of formaldehyde standards in the National Emission Standards for Hazardous Air Pollutants (“NESHAP”) Subpart YYYY for stationary combustion turbines located at major sources of hazardous air pollutant (“HAP”) emissions. Owners and operators of lean remix gas-fired turbines and diffusion flame gas-fired turbines at major sources of HAP that were installed after January 14, 2003 were required to comply with NESHAP Subpart YYYY by March 9, 2022 and demonstrate initial compliance with those requirements by September 5, 2022. We do not believe that the construction and operations of our Liquefaction Projects will be materially and adversely affected by such regulatory actions.
We are supportive of regulations reducing GHG emissions over time. Since 2009, the EPA has promulgated and finalized multiple GHG emissions regulations related to reporting and reductions of GHG emissions from our facilities. On December 2, 2023, the EPA issued final rules to reduce methane and volatile organic compounds (“VOC”) emissions from new, existing and modified emission sources in the oil and gas sector. These regulations require monitoring of methane and VOC emissions at our compressor stations. We do not believe such regulations will have a material adverse effect on our operations, financial condition or results of operations.
From time to time, Congress has considered proposed legislation directed at reducing GHG emissions. On August 16, 2022, President Biden signed H.R. 5376 (P.L. 117-169), the Inflation Reduction Act of 2022 (“IRA”) which includes a charge on methane emissions above a certain methane intensity threshold for facilities that report their GHG emissions under the EPA’s Greenhouse Gas Emissions Reporting Program Part 98 regulations. The charge started at $900 per metric ton of methane in 2024, increased to $1,200 per metric ton in 2025, and is increasing to $1,500 per metric ton in 2026 and beyond. On November 12, 2024, the EPA finalized a rule to impose and collect the methane emissions charge authorized under the IRA. We do not believe the methane charge will have a material adverse effect on our operations, financial condition or results of operations.
In July 2024, the EU enacted Regulation (EU) 2024/1787 on the reduction of methane emissions in the energy sector, which became effective on August 4, 2024. This regulation requires, among other things, importers of natural gas (including LNG) into the EU to report methane emissions and information on the measurement, reporting and verification (“MRV”) programs that the producer of such natural gas has in place. In addition, in future years, the EU intends to establish a maximum methane intensity for imported energy. The impact of this regulation on our business is uncertain, but is not expected to be material.
The timing, extent and impact of these rules and other Biden Administration initiatives remain uncertain as the Trump Administration has undertaken steps to delay their implementation, and to review, repeal and potentially replace them.
Coastal Zone Management Act (“CZMA”)
The siting and construction of our LNG terminals within the coastal zone is subject to the requirements of the CZMA. The CZMA is administered by the states (in Louisiana, by the Department of Natural Resources, and in Texas, by the General Land Office). This program is implemented to ensure that impacts to coastal areas are consistent with the intent of the CZMA to manage the coastal areas.
Clean Water Act
Our LNG terminals are subject to the federal CWA and analogous state and local laws. The CWA imposes strict controls on the discharge of pollutants into the navigable waters of the United States, including discharges of wastewater and storm water runoff and fill/discharges into waters of the United States. Permits must be obtained prior to discharging pollutants into state and federal waters. The CWA is administered by the EPA, the USACE and by the states (in Louisiana, by the LDEQ, and in Texas, by the TCEQ). The CWA regulatory programs, including the Section 404 dredge and fill permitting program and Section 401 water quality certification program carried out by the states, are frequently the subject of shifting agency interpretations and legal challenges, which at times can result in permitting delays.
Resource Conservation and Recovery Act (“RCRA”)
The federal RCRA and comparable state statutes govern the generation, handling and disposal of solid and hazardous wastes and require corrective action for releases into the environment. When such wastes are generated in connection with the operations of our facilities, we are subject to regulatory requirements affecting the handling, transportation, treatment, storage and disposal of such wastes.
Protection of Species, Habitats and Wetlands
Various federal and state statutes, such as the Endangered Species Act, the Migratory Bird Treaty Act, the CWA and the Oil Pollution Act, prohibit certain activities that may adversely affect endangered or threatened animal, fish and plant species and/or their designated habitats, wetlands, or other natural resources. If one of our LNG terminals or pipelines adversely affects a protected species or its habitat, we may be required to develop and follow a plan to remediate those impacts. In that case, siting, construction or operations may be delayed or restricted and cause us to incur increased costs.
It is not possible at this time to predict how future regulations or legislation may address protection of species, habitats and wetlands and impact our business. However, we do not believe such regulatory actions will have a material adverse effect on our operations, or the construction and operations of our Liquefaction Projects.
Market Factors and Competition
Market Factors
Our ability to enter into additional long-term SPAs to underpin the development of additional Trains, sell LNG through Cheniere Marketing or develop new projects is subject to market factors. These factors include changes in worldwide supply and demand for natural gas, LNG and substitute products, the relative prices for natural gas, crude oil and substitute products in North America and international markets, the extent of energy security needs in the EU and elsewhere, the rate of fuel switching from coal, nuclear or oil to natural gas and other overarching factors such as global economic growth and the pace of any transition from fossil-based systems of energy production and consumption to alternative energy sources. In addition, our ability to obtain additional funding to execute our business strategy is subject to the investment community’s appetite for investment in LNG and natural gas infrastructure and our ability to access capital markets.
We expect that global demand for natural gas and LNG will continue to increase as nations seek more abundant, reliable and environmentally cleaner fuel alternatives to oil and coal. Market participants around the globe have shown commitments to environmental goals consistent with many policy initiatives that we believe are constructive for LNG demand and infrastructure growth. Currently, significant amounts of money are being invested across Europe and Asia in natural gas projects under construction, and more continues to be earmarked to planned projects globally. In Europe, there are various plans to install more than 75 mtpa of import capacity over the near-term to secure access to LNG and displace Russian gas imports. In India, there are more than 5,600 kilometers of gas pipelines under construction to expand the gas distribution network and increase
access to natural gas. And in China, billions of U.S. dollars have already been invested and hundreds of billions of U.S. dollars are expected to be further invested all along the natural gas value chain to enable growth and decrease harmful emissions. Furthermore, some of the existing integrated liquefaction facilities outside of the U.S. have been experiencing issues related to reduced feed gas as a result of depleting upstream resources. Global supply contributions from these plants have been decreasing and LNG supply growth is expected to help support these shortages.
As a result of these dynamics, we expect natural gas and LNG to continue to play an important role in satisfying energy demand going forward. In its forecast published in the third quarter of 2024, Wood Mackenzie Limited (“WoodMac”) forecasted that global demand for LNG would increase by approximately 61%, from approximately 418 mtpa, or 20.1 Tcf, in 2023, to 675 mtpa, or 32.4 Tcf, in 2040 and by approximately 65% to 691 mtpa or 33.1 Tcf in 2050. WoodMac also forecasted LNG production from existing operational facilities and new facilities already under construction would be able to supply the market with approximately 532 mtpa in 2040, declining to 463 mtpa in 2050. This could result in a market need for construction of an additional approximately 142 mtpa of LNG production by 2040 and about 227 mtpa by 2050. As a cleaner burning fuel with lower emissions than coal or liquid fuels in power generation, we expect natural gas and LNG to play a central role in balancing grids, serving as back up for intermittent energy sources and contributing to a low carbon energy system globally. We believe the capital and operating costs of the uncommitted capacity of our Liquefaction Projects, as well as our proposed expansions at Sabine Pass and Corpus Christi, are competitive with new proposed projects globally and we are well-positioned to capture a portion of this incremental market need.
As described above under the caption General, we have limited exposure to oil price movements as we have contracted a significant portion of our LNG production capacity under long-term SPAs and IPM agreements, which are structured to generate fixed fees in addition to variable fees indexed to Henry Hub or international LNG pricing. Refer to General for further discussion of our long-term agreements.
Competition
Despite the long term nature of our SPAs, when SPL, CCL or Cheniere Marketing need to replace or amend any existing SPA or enter into new SPAs, they will compete with each other and other natural gas liquefaction projects throughout the world primarily on the basis of price per contracted volume of LNG at that time, as well as attributes such as commercial innovation, reliable production and customer-focused operations to provide flexible and tailored solutions to LNG buyers. Revenues associated with any incremental volumes sold outside of our long-term SPAs, including those sold by our integrated marketing function, will also be subject to market-based price competition.
Corporate Responsibility
As described in Market Factors and Competition, we expect that global demand for natural gas and LNG will continue to increase as nations seek more abundant, reliable and environmentally cleaner fuel alternatives to oil and coal. Our vision is to provide clean, secure and affordable energy to the world. This vision underpins our focus on responding to the world’s shared energy challenges — expanding the global supply of clean, secure and affordable energy, improving air quality, reducing emissions and supporting the transition to a lower-carbon future. Our approach to corporate responsibility is guided by our Climate and Sustainability Principles: Transparency, Science, Supply Chain and Operational Excellence. In August 2024, we published Energy Secured, Benefits Delivered, our fifth Corporate Responsibility (“CR”) report, which details our approach and progress on ESG matters. Our CR report is available at www.cheniere.com/our-responsibility/reporting-center. Information on our website, including the CR report, is not incorporated by reference into this Annual Report on Form 10-K. For further discussion on social and governance matters, see Human Capital Resources.
Our climate strategy is to measure and mitigate emissions so that we may better position our LNG supplies to remain competitive in a lower carbon future and provide energy, economic and environmental security to our customers across the world. To maximize the environmental benefits of our LNG, we believe it is important to develop our climate goals and strategies based on an accurate and holistic assessment of the emissions profile of our LNG, accounting for all steps in the supply chain.
Consequently, we have collaborated with natural gas midstream companies, technology providers and leading academic institutions on life-cycle assessment (“LCA”) models, quantification, monitoring, reporting and verification (“QMRV”) of GHG emissions and other research and development projects. We also co-founded and sponsored the Energy Emissions Modeling and Data Lab (“EEMDL”), a multidisciplinary research and education initiative led by the University of Texas at
Austin in collaboration with Colorado State University and the Colorado School of Mines. In addition, we commenced providing Cargo Emissions Tags (“CE Tags”) to our long-term customers in June 2022, and in October 2022 joined the Oil and Gas Methane Partnership (“OGMP”) 2.0, the United Nations Environment Programme’s (“UNEP”) flagship oil and gas methane emissions reporting and mitigation initiative. To ensure transparency and rigor, we work with academics and scientists to publish methodologies and results in multiple peer-reviewed journals.
Our total incremental expenditures related to climate initiatives, including capital expenditures, were not material to our Consolidated Financial Statements during the years ended December 31, 2024, 2023 and 2022. However, as governments consider and implement actions to reduce GHG emissions and the transition to a lower-carbon economy continues to evolve, as described in Market Factors and Competition, we expect the scope and extent of our future climate and sustainability initiatives to evolve accordingly. While we have not incurred material direct expenditures related to climate change, we are proactive in our management of climate risks and opportunities, including compliance with existing and future government regulations. We face certain business and operational risks associated with physical impacts from climate change, such as exposure to severe weather events or changes in weather patterns, in addition to transition risks. Please see Item 1A. Risk Factors for additional discussion.
Subsidiaries
Substantially all of our assets are held by our subsidiaries. We conduct most of our business through these subsidiaries, including the development, construction, maintenance and operation of our LNG terminal business and the development and operation of our LNG and natural gas marketing business.
Human Capital Resources
We are in a unique position as the largest producer of liquefied natural gas in the United States and the second-largest LNG operator globally. As an industry leader, we invest in core human capital priorities — attracting, engaging, retaining and developing talent — because our employees enable our current and future success and our ability to generate long-term value.
Our employees help drive our success, build our reputation, establish our legacy and deliver on our commitments to our customers. We aim to retain the best talent and keep our employees engaged through fulfilling career opportunities, training and development resources, and a competitive compensation program.
Our Chief Human Resources Officer oversees human capital management. This includes our approach to talent attraction and retention, rewards and remuneration, employee relations, employee engagement and training and development. Both our Chief Human Resources Officer and Chief Compliance and Ethics Officer communicate progress on our programs to our board of directors (our “Board”) quarterly.
As of December 31, 2024, we had 1,714 full-time employees with 1,617 located in the U.S. and 97 located outside of the U.S. (primarily in the U.K.).
Talent Attraction and Retention
Our recruitment strategy is focused on attracting highly skilled talent. We offer competitive compensation and benefits, and work to develop and attract a strong talent pipeline through a range of internship, apprenticeship and vocational programs. We invest in opportunities to help local students and underserved communities gain specialized skills and create local jobs through sponsorship of apprenticeships and internships. On an annual basis, we participate in workforce availability studies in the geographic areas where we operate to align our workforce planning with available community resources and talent. Internally and externally, we post openings to attract individuals with a range of qualified backgrounds, skills and experience. Our voluntary turnover was 4.7% for 2024.
Compensation and Benefits
We provide robust compensation and benefits programs to our employees. In addition to salaries, all employees are eligible for annual bonuses and stock awards. Benefit plans, which vary by country, include a 401(k) plan, healthcare and insurance benefits, health savings and flexible spending accounts, paid time off, family leave, family care resources, employee
assistance programs and tuition assistance. We link our annual incentive program to financial and non-financial performance metrics.
Culture and Engagement
We are committed to supporting a culture where all employees can thrive, feel they belong and are valued. To create this environment, we are committed to compliance with all federal, state and local laws that prohibit workplace discrimination, harassment and unlawful retaliation. Our Code of Business Conduct and Ethics, our core values of teamwork, respect, accountability, integrity, nimble and safety (“TRAINS”) and our policies demonstrate our commitment to building an inclusive workplace, regardless of race, beliefs, nationality, gender and sexual orientation or any other status protected by our policy. We are committed to providing fair and equitable employee programs including compensation and benefits. We will continue our “Values in Action” efforts, which supports employees in identifying and implementing actions and behaviors that align with our TRAINS values.
We manage and measure organizational health with a view to gaining insight into employees’ experiences, levels of workplace satisfaction and feelings of engagement and inclusion with the company. Employees are encouraged to share ideas and concerns through multiple feedback channels including townhalls and hotlines which can be reached anonymously. Insights from these channels are used to develop both company-wide and business unit level talent development plans and training programs.
Development and Training
As the first exporter of LNG in the lower 48 of the U.S., we faced the unique challenge of developing our own LNG talent. Our apprenticeship program prepares local students for careers in LNG. This program combines classroom education with training and on-site learning experiences at our facilities.
We strive to provide our people with all of the tools and support necessary for them to succeed. We actively encourage our employees to take ownership of their careers and offer a number of resources to do so. Employees receive mid-year and annual performance reviews, as well as frequent informal discussions to help meet their career goals. We also conduct annual talent reviews and succession planning sessions to ensure future organizational talent trends are met. To ensure safe, reliable and efficient operations in a highly regulated environment, we offer online and site-specific learning opportunities. We also provide employees, leaders and executives with targeted development programming to solidify internal talent pipelines and succession plans.
Employee Safety, Health and Wellness
The safety of our employees, contractors and communities is one of our core values, and is carried out through our required safety programs and safety and health related procedures. Safety efforts are led by our Executive Safety Committee, which includes the Chief Executive Officer, senior leaders from across the company and representatives from our sites. We focus our efforts on continuously improving our performance. For the year ended December 31, 2024, we had one employee recordable injury and eleven contractor recordable injuries. Our total recordable incident rate (employees and contractors combined) was 0.15, placing us in the top quintile of industry benchmarks based on Bureau of Labor safety statistics.
To support the well-being of our employees, we provide a wellness program that offers employees incentives to maintain an active lifestyle and set personal wellness goals. Incentives include online education related to health, nutrition and emotional health, as well as subsidies for fitness devices and gym memberships. We also offer mammography screenings, rooms for nursing mothers and biometric screenings.
Available Information
Our common stock has been publicly traded since March 24, 2003 and is traded on the New York Stock Exchange under the symbol “LNG.” Our principal executive offices are located at 845 Texas Avenue, Suite 1250, Houston, Texas 77002, and our telephone number is (713) 375-5000. Our internet address is www.cheniere.com. We provide public access to our annual reports on Form 10-K, quarterly reports on Form 10-Q, current reports on Form 8-K and amendments to these reports as soon
as reasonably practicable after we electronically file those materials with, or furnish those materials to, the SEC under the Exchange Act. These reports may be accessed free of charge through our internet website. We make our website content available for informational purposes only. The website should not be relied upon for investment purposes and is not incorporated by reference into this Form 10-K.
We will also make available to any stockholder, without charge, copies of our annual report on Form 10-K as filed with the SEC. For copies of this, or any other filing, please contact: Cheniere Energy, Inc., Investor Relations Department, 845 Texas Avenue Suite 1250, Houston, Texas 77002 or call (713) 375-5000. The SEC maintains an internet site (www.sec.gov) that contains reports, proxy and information statements and other information regarding issuers.
Additionally, we encourage you to review our CR Report (located on our internet site at www.cheniere.com), for more detailed information regarding our Human Capital programs and initiatives, as well as our initiatives and metrics related to ESG. Nothing on our website, including our CR Report or sections thereof, shall be deemed incorporated by reference into this Annual Report.
ITEM 1A. RISK FACTORS
The following are some of the important factors that should be considered when investing in us, as such risk factors could adversely affect our business, financial condition, results of operation or cash flows or have other adverse impacts, and could cause actual results to differ materially from estimates or expectations contained in our forward-looking statements. Additional risks and uncertainties not currently known to us, or that we currently deem to be immaterial, may also adversely affect our business, contracts, financial condition, operating results, cash flows, liquidity and prospects.
The risk factors in this report are grouped into the following categories:
Risks Relating to Our Financial Matters
An inability to source capital to supplement our available cash resources and existing credit facilities could cause us to have inadequate liquidity and could materially and adversely affect us.
As of December 31, 2024, we had, on a consolidated basis, $2.6 billion of cash and cash equivalents (of which $270 million was held by CQP), $552 million of restricted cash and cash equivalents (of which $109 million was held by CQP), a total of $7.7 billion of available commitments under our credit facilities and $23.1 billion of total debt outstanding (before unamortized discount and debt issuance costs). SPL, CQP, CCH and Cheniere operate with independent capital structures as further detailed in Note 10—Debt of our Notes to Consolidated Financial Statements. We incur, and will incur, significant interest expense relating to financing the assets at the Sabine Pass LNG Terminal and the Corpus Christi LNG Terminal, and we anticipate drawing on current committed facilities and/or incurring additional debt to finance the construction of the Corpus Christi Stage 3 Project, as well as the CCL Midscale Trains 8 & 9 Project and the SPL Expansion Project if a positive FID is made on these expansion projects. Our ability to fund our capital expenditures and refinance our indebtedness may depend on our ability to access additional project financing as well as the debt and equity capital markets. A variety of factors beyond our control could impact the availability or cost of capital, including domestic or international economic conditions, increases in key benchmark interest rates and/or credit spreads, the adoption of new or amended banking or capital market laws or regulations, lending institutions’ evolving policies on financing businesses linked to fossil fuels and the repricing of market risks and volatility in capital and financial markets. Our financing costs could increase or future borrowings or equity offerings may be unavailable to us or unsuccessful, which could cause us to be unable to pay or refinance our indebtedness or to fund our other liquidity needs. We also may rely on borrowings under our credit facilities to fund our capital expenditures. If any of the lenders in the syndicates backing these facilities was unable to perform on its commitments, we may need to seek replacement financing, which may not be available as needed, or may be available in more limited amounts or on more expensive or otherwise unfavorable terms.
Our ability to generate cash is substantially dependent upon the performance by customers under long-term contracts that we have entered into, and we could be materially and adversely affected if any significant portion of our customers fails to perform its contractual obligations for any reason.
Our future results and liquidity are substantially dependent upon performance by our customers to make payments under long-term contracts. As of December 31, 2024, we had SPAs with initial terms of 10 or more years with a total of 29 different third party customers.
While substantially all of our long-term third party customer arrangements are executed with a creditworthy parent company or secured by a parent company guarantee or other form of collateral, we are nonetheless exposed to credit risk in the event of a customer default that requires us to seek recourse.
Additionally, our long-term SPAs entitle the customer to terminate their contractual obligations upon the occurrence of certain events which include, but are not limited to: (1) if we fail to make available specified scheduled cargo quantities; (2) delays in the commencement of commercial operations; and (3) under the majority of our SPAs, upon the occurrence of certain events of force majeure.
Although we have not had a history of material customer default or termination events, the occurrence of such events are largely outside of our control and may expose us to unrecoverable losses. We may not be able to replace these customer arrangements on desirable terms, or at all, if they are terminated. As a result, our business, contracts, financial condition, operating results, cash flow, liquidity and prospects could be materially and adversely affected.
We and our subsidiaries may be restricted under the terms of our and their indebtedness from paying dividends or distributions under certain circumstances, which could materially and adversely affect our liquidity.
The agreements governing our and our subsidiaries’ indebtedness contain customary terms and events of default and certain covenants that, among other things, may limit our and our subsidiaries’ ability to make certain investments or pay dividends or distributions. For example, CCH and SPL are restricted from making distributions under agreements governing their indebtedness generally unless, among other requirements, appropriate reserves have been established for debt service using cash or letters of credit and a historical and projected debt service coverage ratio of 1.25:1.00 is satisfied.
In addition, prior to completion of the Corpus Christi Stage 3 Project, CCH is also required to confirm that it has sufficient funds, including senior debt commitments, equity funding and projected contracted cash flows from the fixed price component of its third party SPAs, to meet remaining expenditures required for the Corpus Christi Stage 3 Project in order to achieve completion by a certain specified date.
Any inability to pay or increase dividends or distributions by us or our subsidiaries as a result of the foregoing restrictions could have a material adverse effect on our liquidity.
Our use of derivative instruments, including our IPM agreements, to manage risks could adversely affect our earnings reported under GAAP and our liquidity.
We use derivative instruments to manage certain risks, including commodity-related price risk. The extent of our derivative position at any given time depends on our assessment of risks and related exposures for these commodities. We currently account for our derivatives at fair value, with immediate recognition of changes in the fair value in earnings, as described in Note 2—Summary of Significant Accounting Policies of our Notes to Consolidated Financial Statements. Such valuations are primarily valued based on estimated forward commodity prices and are more susceptible to variability particularly when markets are volatile, which could have a significant adverse effect on our earnings reported under GAAP. For example, as described in Results of Operations in Item 7. Management’s Discussion and Analysis of Financial Condition and Results of Operations, our net income for the years ended December 31, 2024 and 2023 included $1.3 billion and $8.0 billion of gains, respectively, resulting from changes in the fair values of our derivatives (before tax and the impact of non-controlling interests), substantially all of which were related to commodity derivative instruments indexed to international LNG prices, mainly our IPM agreements.
These transactions and other derivative transactions have and may continue to result in substantial volatility in results of operations reported under GAAP, particularly in periods of significant commodity, currency or financial market variability. For
certain of these instruments, in the absence of actively quoted market prices and pricing information from external sources, the value of these financial instruments involves management’s judgment or use of estimates. Changes in the underlying assumptions or use of alternative valuation methods could affect the reported fair value of these contracts.
In addition, our liquidity may be adversely impacted by the cash margin requirements of the respective commodity exchanges or over-the-counter arrangements, or the failure of a counterparty to perform in accordance with a contract. As of December 31, 2024 and 2023, we had collateral posted with counterparties by us of $128 million and $18 million, respectively, which are included in margin deposits in our Consolidated Balance Sheets.
Restrictions in agreements governing us and our subsidiaries’ indebtedness may prevent us and our subsidiaries from engaging in certain beneficial transactions, which could materially and adversely affect us.
In addition to restrictions on the ability of us, CQP, SPL and CCH to make distributions or incur additional indebtedness, the agreements governing our indebtedness also contain various other covenants that may prevent us from engaging in beneficial transactions, including limitations on our ability to:
•make certain investments;
•purchase, redeem or retire equity interests;
•issue preferred stock;
•sell or transfer assets;
•incur liens;
•enter into transactions with affiliates;
•consolidate, merge, sell or lease all or substantially all of our assets; and
•enter into sale and leaseback transactions.
Any restrictions on the ability to engage in beneficial transactions could materially and adversely affect us.
Our ability to declare and pay dividends and repurchase shares is subject to certain considerations.
Dividends are authorized and determined by our Board in its sole discretion and depend upon a number of factors, including:
•Cash available for distribution;
•Our results of operations and anticipated future results of operations;
•Our financial condition, especially in relation to the anticipated future capital needs of any expansion of our liquefaction facilities;
•The level of distributions paid by comparable companies;
•Our operating expenses; and
•Other factors our Board deems relevant.
We expect to continue to pay quarterly dividends to our stockholders; however, our Board may reduce our dividend or cease declaring dividends at any time, including if it determines that our current or forecasted future cash flows provided by our operating activities, after deducting capital expenditures, investments and other commitments, are not sufficient to pay our desired levels of dividends to our stockholders or to pay dividends to our stockholders at all.
Additionally as of December 31, 2024, $3.9 billion of repurchase authority remained under our share repurchase program our Board had authorized, which was increased in June 2024 by $4.0 billion through 2027. Our share repurchase program does not obligate us to acquire a specific number of shares during any period, and our decision to commence, discontinue or resume repurchases in any period will depend on the same factors that our Board may consider when declaring dividends, among others.
Any downward revision in the amount of dividends we pay to stockholders or the number of shares we purchase under our share repurchase program could have an adverse effect on the market price of our common stock.
Risks Relating to Our Operations and Industry
Catastrophic weather events or other disasters could result in an interruption of our operations, a delay in the construction of our Liquefaction Projects, damage to our Liquefaction Projects and increased insurance costs, all of which could adversely affect us.
Weather events such as major hurricanes and winter storms have caused interruptions or temporary suspension in construction or operations at our facilities or caused minor damage to our facilities. Our risk of loss related to weather events or other disasters is limited by contractual provisions in our SPAs, which can provide under certain circumstances relief from operational events, and partially mitigated by insurance we maintain. Aggregate direct and indirect losses associated with the aforementioned weather events, net of insurance reimbursements, have not historically been material to our Consolidated Financial Statements, and we believe our insurance coverages maintained, existence of certain protective clauses within our SPAs and other risk management strategies mitigate our exposure to material losses. However, future adverse weather events and collateral effects, or other disasters such as explosions, fires, floods or severe droughts, could cause damage to, or interruption of operations at our terminals or related infrastructure, which could impact our operating results, increase insurance premiums or deductibles paid and delay or increase costs associated with the construction and development of our Liquefaction Projects or our other facilities. Our LNG terminal infrastructure and LNG facilities located in or near Corpus Christi, Texas and Sabine Pass, Louisiana are designed in accordance with requirements of 49 Code of Federal Regulations Part 193, Liquefied Natural Gas Facilities: Federal Safety Standards, and all applicable industry codes and standards.
Disruptions to the third party supply of natural gas to our pipelines and facilities could have a material adverse effect on our business, contracts, financial condition, operating results, cash flow, liquidity and prospects.
We depend upon third party pipelines and other facilities that provide gas delivery options to our liquefaction facilities and pipelines. If any pipeline connection were to become unavailable for current or future volumes of natural gas due to repairs, damage to the facility, lack of capacity, failure to replace contracted firm pipeline transportation capacity on economic terms, or any other reason, our ability to receive natural gas volumes to produce LNG or to continue shipping natural gas from producing regions or to end markets could be adversely impacted. Such disruptions to our third party supply of natural gas may also be caused by weather events or other disasters described in the risk factor Catastrophic weather events or other disasters could result in an interruption of our operations, a delay in the construction of our Liquefaction Projects, damage to our Liquefaction Projects and increased insurance costs, all of which could adversely affect us. While certain contractual provisions in our SPAs can limit the potential impact of disruptions, and historical indirect losses incurred by us as a result of disruptions to our third party supply of natural gas have not been material, any significant disruption to our natural gas supply where we may not be protected could result in a substantial reduction in our revenues under our long-term SPAs or other customer arrangements, which could have a material adverse effect on our business, contracts, financial condition, operating results, cash flow, liquidity and prospects.
We may not be able to purchase or receive physical delivery of sufficient natural gas to satisfy our delivery obligations under the SPAs, which could have a material adverse effect on us.
Under the SPAs with our customers, we are required to make available to them a specified amount of LNG at specified times. The supply of natural gas to our Liquefaction Projects to meet our LNG production requirements timely and at sufficient quantities is critical to our operations and the fulfillment of our customer contracts. However, we may not be able to purchase or receive physical delivery of natural gas as a result of various factors, including composition changes in the quality of feed gas received from third parties, non-delivery or untimely delivery by our suppliers, depletion of natural gas reserves within regional basins and disruptions to pipeline operations as described in the risk factor Disruptions to the third party supply of natural gas to our pipelines and facilities could have a material adverse effect on our business, contracts, financial condition, operating results, cash flow, liquidity and prospects. Our risk is in part mitigated by the diversification of our natural gas supply and transportation across suppliers and pipelines, and regionally across basins, and additionally, we have provisions within our supplier contracts that provide certain protections against non-performance. Further, provisions within our SPAs provide certain protection against force majeure events. While historically we have not incurred significant or prolonged disruptions to our natural gas supply that have resulted in a material adverse impact to our operations, due to the criticality of natural gas supply to our production of LNG, our failure to purchase or receive physical delivery of sufficient quantities of
natural gas under circumstances where we may not be protected could have a material adverse effect on our business, contracts, financial condition, operating results, cash flow, liquidity and prospects.
Our ability to complete development and/or construction of additional Trains, including the CCL Midscale Trains 8 & 9 Project and the SPL Expansion Project, will be contingent on our ability to obtain additional funding. If we are unable to obtain sufficient funding, we may be unable to fully execute our business strategy.
We continuously pursue liquefaction expansion opportunities and other projects along the LNG value chain. As described further in Items 1. and 2. Business and Properties, we are currently developing the CCL Midscale Trains 8 & 9 Project and the SPL Expansion Project. The commercial development of an LNG facility takes a number of years and requires a substantial capital investment that is dependent on sufficient funding and commercial interest, among other factors.
We will require significant additional funding to be able to commence construction of the CCL Midscale Trains 8 & 9 Project, the SPL Expansion Project and any additional expansion projects, which we may not be able to obtain at a cost that results in positive economics, or at all. The inability to achieve acceptable funding may cause a delay in the development or construction of the CCL Midscale Trains 8 & 9 Project, the SPL Expansion Project or any additional expansion projects, and we may not be able to complete our business plan, which could have a material adverse effect on our business, contracts, financial condition, operating results, cash flow, liquidity and prospects.
Cost overruns and delays in the completion of our expansion projects, including the Corpus Christi Stage 3 Project, the CCL Midscale Trains 8 & 9 Project and the SPL Expansion Project, as well as difficulties in obtaining sufficient financing to pay for such costs and delays, could have a material adverse effect on our business, contracts, financial condition, operating results, cash flow, liquidity and prospects.
Our investment decision on the Corpus Christi Stage 3 Project and any potential future expansion of LNG facilities, including the CCL Midscale Trains 8 & 9 Project and the SPL Expansion Project, relies on cost estimates developed initially through front end engineering and design studies. However, due to the size and duration of construction of an LNG facility, the actual construction costs may be significantly higher than our current estimates as a result of many factors, including but not limited to changes in scope and the ability of Bechtel Energy Inc. (“Bechtel”) and our other contractors to execute successfully under their agreements. Although our major EPC contracts are fixed price, as construction progresses, we may decide or be forced to submit change orders to our contractor, including change orders to comply with existing or future environmental or other regulations. Any change orders could result in longer construction periods, higher construction costs, including increased commodity prices (particularly nickel and steel) and escalating labor costs, or both. Additionally, our SPAs generally provide that the customer may terminate that SPA if the relevant Train does not timely commence commercial operations. As a result, any significant construction delay, whatever the cause, could have a material adverse impact on our business, contracts, financial condition, operating results, cash flow, liquidity and prospects.
Significant increases in the cost of a liquefaction project or significant construction delays could impact the commercial viability of the project as well as require us to obtain additional sources of financing to fund our operations until the applicable liquefaction project is fully constructed (which could cause further delays), thereby negatively impacting our business and limiting our growth prospects. While historically we have not experienced cost overruns or construction delays that have had a significant adverse impact on our operations, factors giving rise to such events in the future may be outside of our control and could have a material adverse effect on our current or future business, contracts, financial condition, operating results, cash flow, liquidity and prospects.
We are subject to significant construction and operating hazards and uninsured risks, one or more of which may create significant liabilities and losses for us.
The construction and operation of our LNG terminals and our pipelines are, and will be, subject to the inherent risks associated with these types of operations as discussed throughout our risk factors, including explosions, breakdowns or failures of equipment, operational errors by vessel or tug operators, pollution, release of toxic substances, fires, hurricanes and adverse weather conditions and other hazards, each of which could result in significant delays in commencement or interruptions of operations and/or in damage to or destruction of our facilities or damage to persons and property. In addition, our operations and the facilities and vessels of third parties on which our operations are dependent face possible risks associated with acts of aggression or terrorism.
We do not, nor do we intend to, maintain insurance against all of these risks and losses. We may not be able to maintain desired or required insurance in the future at rates that we consider reasonable. Although losses incurred as a result of self-insured risk have not been material historically, the occurrence of a significant event not fully insured or indemnified against could have a material adverse effect on our business, contracts, financial condition, operating results, cash flow, liquidity and prospects.
We are dependent on our EPC partners and other contractors for the successful completion of the Corpus Christi Stage 3 Project and any potential expansion projects, including the CCL Midscale Trains 8 & 9 Project and the SPL Expansion Project.
Timely and cost-effective completion of the Corpus Christi Stage 3 Project and any potential expansion projects, including the CCL Midscale Trains 8 & 9 Project and the SPL Expansion Project, in compliance with agreed specifications is central to our business strategy and is highly dependent on the performance of our EPC partners, including Bechtel, and our other contractors under their agreements. The ability of our EPC partners and our other contractors to perform successfully under their agreements is dependent on a number of factors, including their ability to:
•design and engineer each Train to operate in accordance with specifications;
•engage and retain third party subcontractors and procure equipment and supplies;
•respond to difficulties such as equipment failure, delivery delays, schedule changes and failure to perform by subcontractors, some of which are beyond their control;
•attract, develop and retain skilled personnel, including engineers;
•post required construction bonds and comply with the terms thereof;
•manage the construction process generally, including coordinating with other contractors and regulatory agencies; and
•maintain their own financial condition, including adequate working capital.
Although some agreements may provide for liquidated damages if the contractor fails to perform in the manner required with respect to certain of its obligations, the events that trigger a requirement to pay liquidated damages may delay or impair the operation of the Corpus Christi Stage 3 Project and any potential expansion projects, including the CCL Midscale Trains 8 & 9 Project and the SPL Expansion Project, and any liquidated damages that we receive may not be sufficient to cover the damages that we suffer as a result of any such delay or impairment. The obligations of EPC partners and our other contractors to pay liquidated damages under their agreements are subject to caps on liability, as set forth therein.
Furthermore, we may have disagreements with our contractors about different elements of the construction process, which could lead to the assertion of rights and remedies under their contracts and increase the cost of the Corpus Christi Stage 3 Project and any potential expansion projects, including the CCL Midscale Trains 8 & 9 Project and the SPL Expansion Project, or result in a contractor’s unwillingness to perform further work. If any contractor is unable or unwilling to perform according to the negotiated terms and timetable of its respective agreement for any reason or terminates its agreement, we would be required to engage a substitute contractor. This would likely result in significant project delays and increased costs, which could have a material adverse effect on our business, contracts, financial condition, operating results, cash flow, liquidity and prospects.
There may be impediments to the transport of LNG, such as shortages of LNG vessels worldwide or operational impacts on LNG shipping, which could have a material adverse effect on our business, contracts, financial condition, operating results, cash flow, liquidity and prospects.
We sell a significant amount of our LNG under DAT terms requiring delivery to international destinations. To fulfill our transportation requirements under these arrangements, including those under long term SPAs, we depend on the ability to secure chartered vessels often through long term lease arrangements. The construction and delivery of LNG vessels require significant capital and long construction lead times, and we may execute charters several years before the lease arrangements commence.
Although we actively manage our vessel requirements in response to the market and our customer contracts, the availability of LNG vessels and transportation costs could be impacted to the detriment of our business and our customers because of:
•an inadequate number of shipyards constructing LNG vessels and a backlog of orders at these shipyards;
•shortages of or delays in the receipt of necessary construction materials;
•political or economic disturbances;
•acts of war or piracy;
•changes in governmental regulations or maritime self-regulatory organizations;
•work stoppages or other labor disturbances;
•bankruptcy or other financial crisis of shipbuilders or shipowners;
•quality or engineering problems;
•disruptions to maritime transportation routes, such as the security situation in the Gulf of Aden and congestion at the Panama Canal; and
•weather interference or a catastrophic event, such as a major earthquake, tsunami or fire.
While our chartered vessels are operated by the ship owners and we are exposed to risks outside of our own control, we are generally protected through provisions in our charter agreements from transportation disruptions on the part of the ship owner, including disruptions due to off-hire and downtime periods or shipping delays. However, other events outside of our control where we may not be protected may have a material adverse effect on our business, contracts, financial condition, operating results, cash flow, liquidity and prospects.
Additionally, while our vessel charters allow us to secure fixed rates under long term contracts (in certain cases subject to inflation) and we generally structure our SPAs to recover any increase in such costs, our profitability, particularly relating to our short term or spot LNG sales outside of our SPAs, is largely dependent on the strength of international LNG markets. While historical downturns have not had a material adverse impact to our operations or results, any prolonged weakening of such markets could result in depressed or negative margins. See the risk factor Cyclical or other changes in the demand for and price of LNG and natural gas may adversely affect our LNG business and the performance of our customers and could have a material adverse effect on our business, contracts, financial condition, operating results, cash flow, liquidity and prospects for additional discussion.
Cyclical or other changes in the demand for and price of LNG and natural gas may adversely affect our LNG business and the performance of our customers and could have a material adverse effect on our business, contracts, financial condition, operating results, cash flow, liquidity and prospects.
Our LNG business and the development of domestic LNG facilities and projects generally is based on assumptions about the future availability and price of natural gas and LNG and the prospects for international natural gas and LNG markets. Natural gas and LNG prices have been, and are likely to continue to be, volatile and subject to wide fluctuations in response to one or more of the following factors:
•competitive liquefaction capacity in North America;
•insufficient or oversupply of natural gas liquefaction or receiving capacity worldwide;
•insufficient LNG tanker capacity;
•weather conditions, including temperature volatility resulting from climate change, and extreme weather events may lead to unexpected distortion in the balance of international LNG supply and demand;
•reduced demand and lower prices for natural gas;
•increased natural gas production deliverable by pipelines, which could suppress demand for LNG;
•decreased oil and natural gas exploration activities which may decrease the production of natural gas, including as a result of any potential ban on production of natural gas through hydraulic fracturing;
•cost improvements that allow competitors to provide natural gas liquefaction capabilities at reduced prices;
•changes in supplies of, and prices for, alternative energy sources which may reduce the demand for natural gas;
•changes in regulatory, tax or other governmental policies regarding exported LNG, natural gas or alternative energy sources, which may reduce the demand for exported LNG and/or natural gas;
•political conditions in customer regions;
•sudden decreases in demand for LNG as a result of natural disasters or public health crises, including the occurrence of a pandemic, and other catastrophic events;
•adverse relative demand for LNG compared to other markets, which may decrease LNG exports from North America; and
•cyclical trends in general business and economic conditions that cause changes in the demand for natural gas.
Adverse trends or developments affecting any of these factors could result in decreases in the price of LNG and/or natural gas, which could materially and adversely affect our LNG business and the performance of our customers, and could have a material adverse effect on our business, contracts, financial condition, operating results, cash flow, liquidity and prospects.
Failure of exported LNG to be a long term competitive source of energy for international markets could adversely affect our customers and could materially and adversely affect our business, contracts, financial condition, operating results, cash flow, liquidity and prospects.
Operations of the Liquefaction Projects are dependent upon the ability of our SPA customers to deliver LNG supplies from the United States, which is primarily dependent upon LNG being a competitive source of energy internationally. The success of our business plan is dependent, in part, on the extent to which LNG can, for significant periods and in significant volumes, be supplied from the United States and delivered to international markets at a lower cost than the cost of alternative energy sources. Through the use of improved exploration technologies, additional sources of natural gas may be discovered outside the United States, which could increase the available supply of natural gas outside the United States and could result in natural gas in those markets being available at a lower cost than LNG exported to those markets.
Political instability in foreign countries that import or export natural gas, or strained relations between such countries and the United States, may also impede the willingness or ability of LNG purchasers or suppliers and merchants in such countries to import LNG from the United States. Furthermore, some foreign purchasers or suppliers of LNG may have economic or other reasons to obtain their LNG from, or direct their LNG to, non-U.S. markets or from or to our competitors’ liquefaction facilities in the United States.
As described in Market Factors and Competition in Items 1. and 2. Business and Properties, it is expected that global demand for natural gas and LNG will continue to increase as nations seek more abundant, reliable and environmentally cleaner fuel alternatives to alternative fossil fuel energy sources such as oil and coal. However, as a result of transitions globally from fossil-based systems of energy production and consumption to renewable energy sources, LNG may face increased competition from alternative, cleaner sources of energy as such alternative sources emerge. Additionally, LNG from the Liquefaction Projects also competes with other sources of LNG, including LNG that is priced to indices other than Henry Hub. Some of these sources of energy may be available at a lower cost than LNG from the Liquefaction Projects in certain markets. The cost of LNG supplies from the United States, including the Liquefaction Projects, may also be impacted by an increase in natural gas prices in the United States.
As described in General in Items 1. and 2. Business and Properties, we have contracted through our SPAs and IPM agreements approximately 95% of the total anticipated production from the Liquefaction Projects through the mid-2030s, excluding volumes from contracts with terms less than 10 years and volumes that are contractually subject to additional liquefaction capacity beyond what is currently in construction or operation. However, as a result of the factors described above and other factors, the LNG we produce may not remain a long term competitive source of energy internationally, particularly when our existing long term contracts begin to expire. Any significant impediment to the ability to continue to secure long term commercial contracts or deliver LNG from the United States could have a material adverse effect on our customers and on our business, contracts, financial condition, operating results, cash flow, liquidity and prospects.
We face competition based upon the international market price for LNG.
Our Liquefaction Projects are subject to the risk of LNG price competition at times when we need to replace any existing SPA, whether due to natural expiration, default or otherwise, or enter into new SPAs. Factors relating to competition may prevent us from entering into a new or replacement SPA on economically comparable terms as existing SPAs, or at all. Such an event could have a material adverse effect on our business, contracts, financial condition, operating results, cash flow, liquidity and prospects. Factors which may negatively affect potential demand for LNG from our Liquefaction Projects are diverse and include, among others:
•increases in worldwide LNG production capacity and availability of LNG for market supply;
•increases in demand for LNG but at levels below those required to maintain current price equilibrium with respect to supply;
•increases in the cost to supply natural gas feedstock to our Liquefaction Projects;
•decreases in the cost of competing sources of natural gas or alternate fuels such as coal, heavy fuel oil and diesel;
•decreases in the price of non-U.S. LNG, including decreases in price as a result of contracts indexed to lower oil prices;
•increases in capacity and utilization of nuclear power and related facilities; and
•displacement of LNG by pipeline natural gas or alternate fuels in locations where access to these energy sources is not currently available.
A cyber attack involving our business, operational control systems or related infrastructure, or that of third parties with whom we do business, including pipelines which supply our Liquefaction Projects, or an attack on our critical suppliers, could negatively impact our business or operations, result in data security breaches, impede the processing of transactions, delay financial or compliance reporting and potentially harm our reputation.
The pipeline and LNG industries are increasingly dependent on business and operational control technologies to conduct daily operations. We rely on control systems, technologies and networks to run our business and to control and manage our trading, marketing, pipeline, liquefaction and shipping operations. Cyber attacks on businesses have escalated in recent years, including as a result of geopolitical tensions, and use of the internet, cloud services, mobile communication systems and other public networks exposes our business and that of other third parties with whom we do business to potential cyber attacks, including third party pipelines which supply natural gas to our Liquefaction Projects. For example, in 2021 Colonial Pipeline suffered a ransomware attack that led to the complete shutdown of its pipeline system for six days. Should multiple of the third party pipelines which supply our Liquefaction Projects suffer similar concurrent attacks, our Liquefaction Projects may not be able to obtain sufficient natural gas to operate at full capacity, or at all. A cyber attack involving our business or operational control systems or related infrastructure, or that of third parties pipelines with whom we do business, or an attack on our critical suppliers, could negatively impact our business or operations, result in data security breaches, impede the processing of transactions, delay financial or compliance reporting and potentially harm our reputation.
We may experience increased labor costs, and the unavailability of skilled workers or our failure to attract and retain qualified personnel could adversely affect us. In addition, changes in our senior management or other key personnel could affect our business results.
We are dependent upon the available labor pool of skilled employees. We compete with other energy companies and other employers to attract and retain qualified personnel with the technical skills and experience required to construct and operate our facilities and pipelines and to provide our customers with the highest quality service. In the United States, we are also subject to the Fair Labor Standards Act, which governs such matters as minimum wage, overtime and other working conditions. A shortage in the labor pool of skilled workers, remoteness of our site locations, general inflationary pressures, changes in applicable laws and regulations or labor disputes could make it more difficult for us to attract and retain qualified personnel and could require an increase in the wage and benefits packages that we offer, thereby increasing our operating costs. In addition, we are also subject to increased competition for skilled workers from new entrants to the LNG market. Any increase in our operating costs could materially and adversely affect our business, contracts, financial condition, operating results, cash flow, liquidity and prospects.
We depend on our executive officers for various activities. We do not maintain key person life insurance policies on any of our personnel. Although we have arrangements relating to compensation and benefits with certain of our executive officers, we do not have any employment contracts or other agreements with key personnel binding them to provide services for any particular term, other than our employment agreement with our President and Chief Executive Officer. The loss of the services of any of these individuals could have a material adverse effect on our business.
Outbreaks of infectious diseases, such as COVID-19, at one or more of our facilities could adversely affect our operations or business.
Our facilities at the Sabine Pass LNG Terminal and Corpus Christi LNG Terminal are critical infrastructure and continued to operate during the COVID-19 pandemic through our implementation of workplace controls and pandemic risk reduction measures. While the COVID-19 pandemic, including subsequent variants, had no adverse impact on our on-going operations, the risk of future variants and other infectious diseases is unknown and the outbreak of a more potent variant or another infectious disease in the future at one or more of our facilities could adversely affect our operations or business.
Risks Relating to Regulations
Failure to obtain and maintain approvals and permits from governmental and regulatory agencies with respect to the design, construction and operation of our facilities, the development and operation of our pipelines and the export of LNG could impede operations and construction and could have a material adverse effect on our business, contracts, financial condition, operating results, cash flow, liquidity and prospects.
The design, construction and operation of interstate natural gas pipelines, LNG terminals, including the Liquefaction Projects, CCL Midscale Trains 8 & 9 Project, the SPL Expansion Project and other facilities, as well as the import and export of LNG and the purchase and transportation of natural gas, are highly regulated activities. Approvals of the FERC and DOE under Section 3 and Section 7 of the NGA, as well as several other material governmental and regulatory approvals and permits, including several under the CAA and the CWA, are required in order to construct and operate an LNG facility and an interstate natural gas pipeline and export LNG.
To date, the FERC has issued orders under Section 3 of the NGA authorizing the siting, construction and operation of the six Trains and related facilities of the SPL Project, the three Trains and related facilities of the CCL Project and the seven midscale Trains and related facilities for the Corpus Christi Stage 3 Project, as well as orders under Section 7 of the NGA authorizing the construction and operation of the Creole Trail Pipeline and the Corpus Christi Pipeline. In February 2024, certain of our subsidiaries submitted an application to the FERC under the NGA for authorization to site, construct and operate the SPL Expansion Project. In March 2023, certain of our subsidiaries submitted an application with the FERC under the NGA for the CCL Midscale Trains 8 & 9 Project, for which a positive Environmental Assessment from the FERC was received in June 2024. To date, the DOE has also issued orders under Section 4 of the NGA authorizing SPL, CCL and the Corpus Christi Stage 3 Project to export domestically produced LNG. We currently have the SPL Expansion Project and the CCL Midscale Trains 8 & 9 Project pending non-FTA export approval with the DOE. However, approval is first subject to the receipt of regulatory permit approval from the FERC, responsive to our formal applications. Additionally, we hold certificates under Section 7(c) of the NGA that grant us land use rights relating to the situation of our pipelines on land owned by third parties. If we were to lose these rights or be required to relocate our pipelines, our business could be materially and adversely affected.
Authorizations obtained from the FERC, DOE and other federal and state regulatory agencies contain ongoing conditions that we must comply with. Failure to comply with or our inability to obtain and maintain existing or newly imposed approvals, permits and filings that may arise due to factors outside of our control such as a U.S. government disruption or shutdown, political opposition or local community resistance to our operations could impede the operation and construction of our infrastructure. In addition, certain of these governmental permits, approvals and authorizations are or may be subject to rehearing requests, appeals and other challenges. There is no assurance that we will obtain and maintain these governmental permits, approvals and authorizations, or that we will be able to obtain them on a timely basis. Any impediment could have a material adverse effect on our business, contracts, financial condition, operating results, cash flow, liquidity and prospects.
Our interstate natural gas pipelines and their FERC gas tariffs are subject to FERC regulation. If we fail to comply with such regulation, we could be subject to substantial penalties and fines.
Our interstate natural gas pipelines are subject to regulation by the FERC under the NGA and the Natural Gas Policy Act of 1978 (the “NGPA”). The FERC regulates the purchase and transportation of natural gas in interstate commerce, including the construction and operation of pipelines, the rates, terms and conditions of service and abandonment of facilities. Under the NGA, the rates charged by our interstate natural gas pipelines must be just and reasonable, and we are prohibited from unduly preferring or unreasonably discriminating against any potential shipper with respect to pipeline rates or terms and conditions of service. If we fail to comply with all applicable statutes, rules, regulations and orders, our interstate pipelines could be subject to substantial penalties and fines.
In addition, as a natural gas market participant, should we fail to comply with all applicable FERC-administered statutes, rules, regulations and orders, we could be subject to substantial penalties and fines. Under the EPAct, the FERC has civil penalty authority under the NGA and the NGPA to impose penalties for current violations of up to $1.5 million per day for each violation.
Although the FERC has not imposed fines or penalties on us to date, we are exposed to substantial penalties and fines if we fail to comply with such regulations.
Existing and future safety, environmental and similar laws and governmental regulations could result in increased compliance costs or additional operating costs or construction costs and restrictions.
Our business is and will be subject to extensive federal, state and local laws, rules and regulations applicable to our construction and operation activities relating to, among other things, air quality, water quality, waste management, natural resources and health and safety. Many of these laws and regulations, such as the CAA, the Oil Pollution Act, the CWA and the RCRA, and analogous state laws and regulations, restrict or prohibit the types, quantities and concentration of substances that can be released into the environment in connection with the construction and operation of our facilities, and require us to maintain permits and provide governmental authorities with access to our facilities for inspection and reports related to our compliance. In addition, certain laws and regulations authorize regulators having jurisdiction over the construction and operation of our LNG terminals, marine berths and pipelines, including FERC, PHMSA, EPA and the United States Coast Guard, to issue regulatory enforcement actions, which may restrict or limit operations or increase compliance or operating costs. Violation of these laws and regulations could lead to substantial liabilities, compliance orders, fines and penalties, difficulty obtaining and maintaining permits from regulatory agencies or increased capital expenditures that could have a material adverse effect on our business, contracts, financial condition, operating results, cash flow, liquidity and prospects. Federal and state laws impose liability, without regard to fault or the lawfulness of the original conduct, for the release of certain types or quantities of hazardous substances into the environment. As the owner and operator of our facilities, we could be liable for the costs of cleaning up hazardous substances released into the environment at or from our facilities and for resulting damage to natural resources.
The EPA has finalized or proposed multiple GHG regulations that impact our assets and supply chain. On December 2, 2023, the EPA issued final rules to reduce methane and VOC emissions from new, existing and modified emission sources in the oil and gas sector. These regulations require monitoring of methane and VOC emissions at our compressor stations. Further, the IRA includes a charge on methane emissions above certain emissions thresholds employing empirical emissions data that applied to our facilities beginning in calendar year 2024. On November 12, 2024, the EPA finalized a rule to impose and collect methane emissions charges authorized under the IRA. In addition, other international, federal and state initiatives may be considered in the future to address GHG emissions through treaty commitments, direct regulation, market-based regulations such as a GHG emissions tax or cap-and-trade programs or clean energy or performance-based standards. Such initiatives could affect the demand for or cost of natural gas, which we consume at our terminals, or could increase compliance costs for our operations.
Revised, reinterpreted or additional guidance, laws and regulations at local, state, federal or international levels that result in increased compliance costs or additional operating or construction costs and restrictions could have a material adverse effect on our business, contracts, financial condition, operating results, cash flow, liquidity and prospects. It is not possible at this time to predict how future regulations or legislation may address GHG emissions and impact our business.
In 2022, the EPA removed a stay of formaldehyde standards in the NESHAP Subpart YYYY for stationary combustion turbines located at major sources of HAP emissions. Owners and operators of lean remix gas-fired turbines and diffusion flame gas-fired turbines at major sources of HAP that were installed after January 14, 2003 were required to comply with NESHAP Subpart YYYY beginning in 2022.
Other future legislation and regulations, such as those relating to the transportation and security of LNG imported to or exported from our terminals or climate policies of destination countries in relation to their obligations under the Paris Agreement or other national or international climate change-related policies, could cause additional expenditures, restrictions and delays in our business and to our proposed construction activities, the extent of which cannot be predicted and which may require us to limit substantially, delay or cease operations in some circumstances.
Total expenditures related to environmental and similar laws and governmental regulations, including capital expenditures, were immaterial to our Consolidated Financial Statements for the years ended December 31, 2024, 2023 and 2022. Revised, reinterpreted or additional laws and regulations that result in increased compliance, operating or construction costs or restrictions could have a material adverse effect on our business, contracts, financial condition, operating results, cash flow, liquidity and prospects.
Pipeline safety and compliance programs and repairs may impose significant costs and liabilities on us.
The PHMSA requires pipeline operators to develop management programs to safely operate and maintain their pipelines and to comprehensively evaluate certain areas along their pipelines and take additional measures where necessary to protect pipeline segments located in “high or moderate consequence areas” where a leak or rupture could potentially do the most harm. As an operator, we are required to:
•perform ongoing assessments of pipeline safety and compliance;
•identify and characterize applicable threats to pipeline segments that could impact a high consequence area;
•improve data collection, integration and analysis;
•repair and remediate the pipeline as necessary; and
•implement preventative and mitigating actions.
We are required to utilize pipeline integrity management programs that are intended to maintain pipeline integrity. Any repair, remediation, preventative or mitigating actions may require significant capital and operating expenditures. Should we fail to comply with applicable statutes and the Office of Pipeline Safety’s rules and related regulations and orders, we could be subject to significant penalties and fines, which for certain violations can aggregate up to as high as $2.7 million.
Additions or changes in tax laws and regulations could potentially affect our financial results or liquidity.
We are subject to various types of tax arising from normal business operations in the jurisdictions in which we operate and transact. Any changes to local, domestic or international tax laws and regulations, or their interpretation and application, including those related to tariffs and duties, could affect our obligations, profitability and cash flows in the future. In addition, tax rates in the various jurisdictions in which we operate may change significantly due to political or economic factors beyond our control. We continuously monitor and assess proposed tax legislation that could negatively impact our business.
We became subject to the 15% CAMT in 2024. On September 12, 2024, the U.S. Department of Treasury and the Internal Revenue Service (the “IRS”) released proposed regulations relating to the application and implementation of the CAMT. The proposed regulations address a wide range of topics relating to the operation of CAMT; however, significant uncertainty continues to exist regarding many of the operative implementing provisions and regulatory guidance related to the CAMT issued in the future could affect both the timing and amount of our CAMT liability.
ITEM 1B. UNRESOLVED STAFF COMMENTS
None.
ITEM 1C. CYBERSECURITY
Cyberattacks represent a potentially significant risk to the Company and our industry. We have implemented policies and procedures that are intended to manage and reduce this risk.
Risk Management and Strategy
As part of our broader approach to risk management, our cybersecurity program is designed to follow an “identify, protect, detect, respond and recover” approach to cybersecurity that is based off of the National Institute of Standards and Technology Cybersecurity Framework (“CSF”). Our strategy also includes segmentation of corporate and operations networks, defense in depth and the least privileged access principle. Operational networks have fundamentally distinct safety and reliability standards and pose unique threats in comparison to information technology networks. Realizing these differences, we routinely evaluate opportunities to refine our cybersecurity program in order to mitigate operational network risks. We include business continuity planning as a component of our strategy to help ensure critical systems are available to support our company in the instance of a disruptive event. We also participate in various industry organizations to stay abreast of recent trends and developments.
On an ongoing basis, we assess our people, processes and technology and, when necessary, adjust the overall program in an effort to adapt to the ever-evolving cyber and geopolitical landscapes. We conduct regular assessments and audits, cross-functional risk mitigation exercises and risk strategy sessions to identify cybersecurity risks, applicable regulatory requirements and industry standards. These engagements are also designed to exercise, assess the maturity of and enhance our Cyber Incident Response Plan. To support these efforts, we have contracted with third parties to perform facility and system penetration tests, compromise assessments of information technology systems and security maturity assessments of our corporate and operational networks. We maintain a training program to help our personnel identify and assist in mitigating cybersecurity and data security risks. Our employees and Board members participate in annual training, user awareness campaigns and additional issue-specific training as needed. We also provide annual training for certain contractors who have access to our information technology networks.
With respect to third party service providers, our information security program includes conducting risk-based due diligence of certain service providers’ information security programs prior to onboarding. We seek to contractually require third party service providers with access to our information technology systems, sensitive business data or personal information to maintain reasonable security controls and restrict their ability to use our data, including personal information, for purposes other than to provide services to us, except as required by applicable law. We also seek to negotiate contractual requirements which compel our service providers to notify us of information security incidents occurring on their systems which may affect our systems or data, including personal information.
During the year ended December 31, 2024, cybersecurity incidents and threats did not materially affect our business, results of operations or financial condition.
Governance
Our cybersecurity leadership team consists of our Director and Chief Information Security Officer, Vice President and Chief Information Officer and Senior Vice President of Shared Services. These individuals collectively provide the strategic oversight of our cybersecurity governance, cyber risk management and security operations and are responsible for maintaining our technology defense posture and program. As part of their governance and risk management responsibilities, these individuals oversee the efforts to prevent, detect, mitigate and remediate cybersecurity risks and incidents, including the systems deployed in our technology infrastructure to monitor for threats, perform security control testing and assessments, and incorporate threat intelligence into our day-to-day cybersecurity operations and strategic initiatives. They have decades of experience managing strategic technology operations, including the identification of cybersecurity risk and the defense of information technology assets from global threats.
Risks that could affect us are an integral part of our Board and Audit Committee deliberations throughout the year. Cybersecurity risks are integrated into our enterprise risk assessment process, which is reviewed by our Board at least annually. Our Board has oversight responsibility for assessing the primary risks facing us (including cybersecurity risks), the relative magnitude of these risks and management’s plan for mitigating these risks, while the Audit Committee has been delegated the authority to oversee and periodically review the security of our information technology systems and controls, including
programs and defenses against cybersecurity threats. The Audit Committee discusses with management our cybersecurity risk exposures and the steps management has taken to mitigate such exposures, including our risk assessment and risk management policies. On a quarterly basis, our cybersecurity leadership team updates the Audit Committee on the overall status of our cybersecurity program, key operational metrics, current assessments, cybersecurity issues or events and pertinent events related to cybersecurity.
For additional information about cybersecurity risks, see the risk A cyber attack involving our business, operational control systems or related infrastructure, or that of third parties with whom we do business, including pipelines which supply our Liquefaction Projects, or an attack on our critical suppliers, could negatively impact our business or operations, result in data security breaches, impede the processing of transactions, delay financial or compliance reporting and potentially harm our reputation under Risks Relating to Our Operations and Industry in Item 1A.Risk Factors.
ITEM 3. LEGAL PROCEEDINGS
We are, and may in the future be, involved as a party to various legal proceedings, which are incidental to the ordinary course of business. We regularly analyze current information and, as necessary, provide accruals for probable liabilities on the eventual disposition of these matters.
LDEQ Matter
Certain of our subsidiaries are in discussions with the LDEQ to resolve alleged non-compliance with national emission standards for formaldehyde from combustion turbines at the Sabine Pass LNG Terminal. The allegations are identified in a Consolidated Compliance Order and Notice of Potential Penalty, Tracking No. AE-CN-22-00833 (the “2023 Compliance Order”) issued by the LDEQ on April 12, 2023. In August 2004, the EPA stayed the application of the emission standard to combustion turbines such as those at the Sabine Pass LNG Terminal. In March 2022, the EPA lifted the stay, and in June 2022 our subsidiaries petitioned the EPA and LDEQ for approval of additional operating parameters to demonstrate compliance with the emission limitation. The petition remains pending. Our subsidiaries continue to work with the LDEQ to resolve the matters identified in the 2023 Compliance Order, including the petition pending with the EPA. As of December 2024, our subsidiaries have filed test results with the LDEQ indicating that for the 2024 testing period all 44 turbines meet the relevant compliance standard. We do not expect that any ultimate penalty will have a material adverse impact on our financial results.
ITEM 4. MINE SAFETY DISCLOSURE
Not applicable.
PART II
ITEM 5. MARKET FOR REGISTRANT’S COMMON EQUITY, RELATED STOCKHOLDER MATTERS AND ISSUER PURCHASES OF EQUITY SECURITIES
Market Information, Holders and Dividend Policy
Our common stock has traded on the New York Stock Exchange under the symbol “LNG” since February 5, 2024, and previously traded on the NYSE American or its predecessors under the symbol “LNG” from March 24, 2003 through February 3, 2024. As of February 14, 2025, we had approximately 223.7 million shares of common stock outstanding held by 71 record owners. Because our shares are held by brokers and other institutions on behalf of our stockholders, we are unable to estimate the total number of actual stockholders represented by these record owners.
We intend to continue to declare and pay quarterly dividends, with the goal of increasing the dividend over time. The declaration of dividends is subject to the discretion of our Board, and will depend on our financial condition and other factors deemed relevant by the Board. See the risk Our ability to declare and pay dividends and repurchase shares is subject to certain considerations under Risks Relating to Our Financial Matters in Item 1A. Risk Factors.
Purchase of Equity Securities by the Issuer and Affiliated Purchasers
The following table summarizes stock repurchases for the three months ended December 31, 2024:
| | | | | | | | | | | | | | | | | | | | | | | | | | |
| Period | | Total Number of Shares Purchased | | Average Price Paid Per Share | | Total Number of Shares Purchased as a Part of Publicly Announced Plans | | Approximate Dollar Value of Shares That May Yet Be Purchased Under the Plans (in millions) (1) |
| October 1 - 31, 2024 | | 1,306,270 | | $184.72 | | 1,306,270 | | $3,930 |
| November 1 - 30, 2024 | | 139,533 | | $190.79 | | 139,533 | | $3,903 |
| December 1 - 31, 2024 | | 65,940 | | $203.79 | | 65,940 | | $3,890 |
| Total | | 1,511,743 | | | | 1,511,743 | | |
(1)See Note 18—Share Repurchase Programs of our Notes to Consolidated Financial Statements for details on the amount authorized by our Board under our share repurchase programs.
Total Stockholder Return
The following is a customized peer group consisting of 17 companies (the “Peer Group”) that were selected because they are publicly traded companies that have comparable Global Industry Classification Standards. We also took into consideration those companies that have similar market capitalization, enterprise values, operating characteristics and capital intensity.
| | | | | | | | |
| Peer Group |
Air Products and Chemicals, Inc. (APD) | | Marathon Petroleum Corporation (MPC) |
| Baker Hughes Company (BKR) | | Occidental Petroleum Corporation (OXY) |
| ConocoPhillips (COP) | | ONEOK, Inc. (OKE) |
Enterprise Products Partners L.P. (EPD) | | Phillips 66 (PSX) |
| EOG Resources, Inc. (EOG) | | Suncor Energy Inc. (SU) |
| Halliburton Company (HAL) | | Targa Resources Corp. (TRGP) |
| Hess Corporation (HES) | | Valero Energy Corporation (VLO) |
Kinder Morgan, Inc. (KMI) | | The Williams Companies, Inc. (WMB) |
| LyondellBasell Industries N.V. (LYB) | | |
The following graph compares the five-year total return on our common stock, the S&P 500 Index and our Peer Group. The graph was constructed on the assumption that $100 was invested in our common stock, the S&P 500 Index and our Peer Group on December 31, 2019 and that any dividends were fully reinvested.
| | | | | | | | | | | | | | | | | | | | | | | | | | | | | | | | | | | | | | |
| | December 31, |
| Company / Index | | 2019 | | 2020 | | 2021 | | 2022 | | 2023 | | 2024 |
| Cheniere Energy, Inc. | | $ | 100.00 | | | $ | 98.30 | | | $ | 166.59 | | | $ | 248.77 | | | $ | 284.11 | | | $ | 363.85 | |
| S&P 500 Index | | 100.00 | | | 118.39 | | | 152.34 | | | 124.72 | | | 157.47 | | | 196.84 | |
| Peer Group | | 100.00 | | | 73.79 | | | 106.70 | | | 158.40 | | | 173.86 | | | 201.79 | |
| | | | | | | | | | | | |
ITEM 6. [Reserved]
ITEM 7. MANAGEMENT’S DISCUSSION AND ANALYSIS OF FINANCIAL CONDITION AND RESULTS OF OPERATIONS
Introduction
The following discussion and analysis presents management’s view of our business, financial condition and overall performance and should be read in conjunction with our Consolidated Financial Statements and the accompanying notes. This information is intended to provide investors with an understanding of our past performance, current financial condition and outlook for the future. Discussion of items for the year ended December 31, 2022 and variance drivers between the year ended December 31, 2023 as compared to December 31, 2022 are not included herein and can be found in “Management’s Discussion and Analysis of Financial Condition and Results of Operations” in our annual report on Form 10-K for the fiscal year ended December 31, 2023.
Our discussion and analysis includes the following subjects:
Overview
We are an energy infrastructure company primarily engaged in LNG-related businesses. We provide clean, secure and affordable LNG to integrated energy companies, utilities and energy trading companies around the world. We operate two natural gas liquefaction and export facilities at Sabine Pass, Louisiana and near Corpus Christi, Texas. For further discussion of our business, see Items 1. and 2. Business and Properties.
Our long-term counterparty arrangements form the foundation of our business and provide us with significant, stable, long-term cash flows. Through our SPAs and IPM agreements currently in effect, with approximately 15 years of weighted average remaining life as of December 31, 2024, we have contracted approximately 95% of the total anticipated production from the Liquefaction Projects through the mid-2030s, excluding volumes from contracts with terms less than 10 years and volumes that are contractually subject to additional liquefaction capacity beyond what is currently in construction or operation. The majority of our contracts are fixed-priced, long-term SPAs consisting of a fixed fee per MMBtu of LNG plus a variable fee per MMBtu of LNG, with the variable fees generally structured to cover the cost of natural gas purchases, transportation and liquefaction fuel consumed to produce LNG. Since we procure most of our feedstock for LNG production from the U.S., the structure of these contracts helps limit our exposure to fluctuations in U.S. natural gas prices. During 2024, we continued to grow our portfolio of SPA and IPM agreements, and we believe that continued global demand for natural gas and LNG, as further described in Market Factors and Competition in Items 1. and 2. Business and Properties, will provide a foundation for additional growth in our business in the future. The continued strength and stability of our long-term cash flows served as the foundation of our updated comprehensive, long-term capital allocation plan announced in June 2024, which includes an increased share repurchase authorization and increased dividends, in addition to a continued decrease in consolidated long-term leverage and investment in accretive organic growth.
Overview of Significant Events
Our significant events since January 1, 2024 and through the filing date of this Form 10-K include the following:
Strategic
•In July 2024, Cheniere Marketing entered into a long-term SPA with Galp Trading S.A. (“Galp”), a subsidiary of Galp Energia, SGPS, S.A., under which Galp has agreed to purchase approximately 0.5 mtpa of LNG from Cheniere
Marketing on a free-on-board basis for a term of 20 years. Deliveries are expected to commence in the early 2030s and are subject to, among other things, a positive FID with respect to the second train of the SPL Expansion Project (“SPL Train 8”) and includes a limited number of early cargoes to be purchased by Galp prior to the start of SPL Train 8.
•In June 2024, we received a positive Environmental Assessment from the FERC relating to the CCL Midscale Trains 8 & 9 Project. We expect to receive all remaining necessary regulatory approvals for the project in 2025.
•In February 2024, certain subsidiaries of CQP submitted an application to the FERC under the NGA for authorization to site, construct and operate the SPL Expansion Project, as well as an application to the DOE requesting authorization to export LNG to FTA countries and non-FTA countries, both of which applications exclude debottlenecking. In October 2024, the authorization from the DOE to export LNG to FTA countries was received for the SPL Expansion Project.
Operational
•As of February 14, 2025, approximately 3,930 cumulative LNG cargoes totaling approximately 270 million tonnes of LNG have been produced, loaded and exported from the Liquefaction Projects.
•In December 2024, we achieved first LNG production from Train 1 of the Corpus Christi Stage 3 Project and in February 2025, the first cargo of LNG was produced from the Corpus Christi Stage 3 Project.
Financial
•In June 2024, we announced updates to our ‘20/20 Vision’ comprehensive long-term capital allocation plan, which included an increase to our share repurchase authorization by $4.0 billion through 2027 and a plan to increase our quarterly dividend by approximately 15% to $2.00 per common share on an annualized basis, which commenced with the dividend pertaining to the third quarter of 2024.
•In May 2024, CQP issued $1.2 billion aggregate principal amount of 5.750% Senior Notes due 2034 (the “2034 CQP Senior Notes”). In June 2024, the net proceeds, together with cash on hand, were used to redeem $1.2 billion of the outstanding aggregate principal amount of SPL’s 5.625% Senior Secured Notes due 2025 (the “2025 SPL Senior Notes”).
•In May 2024, in connection with the 2034 CQP Senior Notes issuance, Moody’s Ratings (“Moody’s”) upgraded CQP’s issuer credit rating to Baa2 from Ba1 and revised CQP’s outlook to stable from positive. Moody’s also upgraded SPL’s issuer credit rating to Baa1 from Baa2 and revised SPL’s outlook to stable from positive. In July 2024, Fitch Ratings upgraded CCH’s issuer credit rating to BBB+ from BBB with a stable outlook. In October 2024, S&P Global Ratings changed the outlook of CCH’s senior secured debt rating to positive from stable.
•In March 2024, we issued $1.5 billion aggregate principal amount of 5.650% Senior Notes due 2034 (the “2034 Cheniere Senior Notes”). In April 2024, the net proceeds, together with cash on hand, were used to retire the approximately $1.5 billion outstanding aggregate principal amount of CCH’s 5.875% Senior Secured Notes due 2025 (the “2025 CCH Senior Notes”).
•During the year ended December 31, 2024, we accomplished the following pursuant to our capital allocation priorities:
◦We repurchased approximately 13.8 million shares of our common stock as part of our share repurchase program for approximately $2.3 billion.
◦Excluding amounts refinanced, SPL redeemed $800 million of outstanding aggregate principal amount of its senior secured notes.
◦We paid dividends of $1.805 per share of common stock during the year ended December 31, 2024.
◦We continued to invest in accretive organic growth, including our investment in the Corpus Christi Stage 3 Project, as further described under Investing Cash Flows in Sources and Uses of Cash within Liquidity and Capital Resources.
Market Environment
The LNG market in 2024 remained relatively tight as a result of low supply capacity growth, strong demand outside Europe and continued geopolitical tensions. Global LNG imports registered a very modest growth in 2024, increasing by less than 4 mtpa year on year due to constrained supply from delays to projects under construction, Russian sanctions and a fallow period for new projects coming on-line. Consequently, a recovery in Asia’s LNG consumption had to be satisfied at the expense of other regions. Asian demand increased significantly from 2023, adding over 20 mtpa of import year-over-year. The largest single country contribution to this growth came from China, which increased 6.8 mtpa year-over-year after a slowdown during the previous two years. Growth outside of Asia tightened the balances further this year by increasing the call on supply away from Europe. Egypt and Brazil propelled imports from the Middle East, North Africa and Latin America regions by 6.2 mtpa to a total of 25.5 mtpa in 2024. In contrast, Europe’s imports declined 19% year-over-year, down approximately 22.7 mtpa, due to weak gas-fired power generation demand and sluggish growth in the industrial sector.
These market conditions contributed to a strong spot price environment albeit annual spot prices in 2024 were overall lower than in the previous year. The TTF monthly settlement prices averaged $10.91/MMBtu in 2024, 20.5% lower than the 2023 average of $13.73/MMBtu. Similarly, the average settlement price for the Japan Korea Marker (“JKM”) was $11.83/MMBtu in 2024, 26.6% lower than the 2023 average of $16.13/MMBtu. The Henry Hub benchmark also dropped from an average settlement price of $2.74/MMBtu in 2023 to $2.27/MMBtu in 2024, down 17.1% year-over-year.
However, a drop in temperatures in Europe toward the end of 2024 and into the beginning of 2025 has resulted in faster drawdowns from underground storage and a rebound in spot prices relative to the third quarter. This, along with the expiry of the gas transit agreement between Russia and Ukraine on December 31, 2024, is likely to increase the call on LNG imports in the coming months in order to replenish European gas storage facilities to 90% capacity by November 1, as required by the EU each year.
Results of Operations
Consolidated results of operations
| | | | | | | | | | | | | | | | | | | | | | | |
| | | Year Ended December 31, | | |
| (in millions, except per share data) | | | | | | | 2024 | | 2023 | | Variance |
| Revenues | | | | | | | | | | | |
| LNG revenues | | | | | | | $ | 14,899 | | | $ | 19,569 | | | $ | (4,670) | |
| Regasification revenues | | | | | | | 135 | | | 135 | | | — | |
| Other revenues | | | | | | | 669 | | | 690 | | | (21) | |
| | | | | | | | | | | |
| Total revenues | | | | | | | 15,703 | | | 20,394 | | | (4,691) | |
| | | | | | | | | | | |
| Operating costs and expenses | | | | | | | | | | | |
| Cost of sales (excluding items shown separately below) | | | | | | | 6,021 | | | 1,356 | | | 4,665 | |
| | | | | | | | | | | |
| Operating and maintenance expense | | | | | | | 1,857 | | | 1,835 | | | 22 | |
| Selling, general and administrative expense | | | | | | | 441 | | | 474 | | | (33) | |
| Depreciation, amortization and accretion expense | | | | | | | 1,220 | | | 1,196 | | | 24 | |
| | | | | | | | | | | |
| | | | | | | | | | | |
| | | | | | | | | | | |
| Other operating costs and expenses | | | | | | | 36 | | | 44 | | | (8) | |
| | | | | | | | | | | |
| Total operating costs and expenses | | | | | | | 9,575 | | | 4,905 | | | 4,670 | |
| | | | | | | | | | | |
| Income from operations | | | | | | | 6,128 | | | 15,489 | | | (9,361) | |
| | | | | | | | | | | |
| Other income (expense) | | | | | | | | | | | |
| Interest expense, net of capitalized interest | | | | | | | (1,010) | | | (1,141) | | | 131 | |
| Gain (loss) on modification or extinguishment of debt | | | | | | | (9) | | | 15 | | | (24) | |
| | | | | | | | | | | |
| Interest and dividend income | | | | | | | 189 | | | 211 | | | (22) | |
| Other income (expense), net | | | | | | | 5 | | | 4 | | | 1 | |
| Total other expense | | | | | | | (825) | | | (911) | | | 86 | |
| | | | | | | | | | | |
| Income before income taxes and non-controlling interests | | | | | | | 5,303 | | | 14,578 | | | (9,275) | |
| Less: income tax provision | | | | | | | 811 | | | 2,519 | | | (1,708) | |
| Net income | | | | | | | 4,492 | | | 12,059 | | | (7,567) | |
| Less: net income attributable to non-controlling interests | | | | | | | 1,240 | | | 2,178 | | | (938) | |
| Net income attributable to Cheniere | | | | | | | $ | 3,252 | | | $ | 9,881 | | | $ | (6,629) | |
| | | | | | | | | | | |
Net income per share attributable to Cheniere—basic | | | | | | | $ | 14.24 | | | $ | 40.99 | | | $ | (26.75) | |
Net income per share attributable to Cheniere—diluted | | | | | | | $ | 14.20 | | | $ | 40.72 | | | $ | (26.52) | |
Volumes loaded and recognized from the Liquefaction Projects
| | | | | | | | | | | | | | | | | | | | | | | | |
| | | | | | | | |
| | | | Year Ended December 31, | | |
| (in TBtu) | | | | | | | | 2024 | | 2023 | | Variance |
| Volumes loaded during the current period | | | | | | | | 2,327 | | | 2,299 | | | 28 | |
| Volumes loaded during the prior period but recognized during the current period | | | | | | | | 37 | | | 56 | | | (19) | |
| Less: volumes loaded during the current period and in transit at the end of the period | | | | | | | | (39) | | | (37) | | | (2) | |
| Total volumes recognized in the current period | | | | | | | | 2,325 | | | 2,318 | | | 7 | |
Components of LNG revenues and corresponding LNG volumes delivered
| | | | | | | | | | | | | | | | | | | | | | | |
| | | Year Ended December 31, | | |
| | | | | | | | 2024 | | 2023 | | Variance |
LNG revenues (in millions): | | | | | | | | | | | |
LNG from the Liquefaction Projects sold under third party long-term agreements (1) | | | | | | | $ | 12,144 | | | $ | 12,820 | | | $ | (676) | |
LNG from the Liquefaction Projects sold by our integrated marketing function under short-term agreements | | | | | | | 2,345 | | | 6,028 | | | (3,683) | |
| LNG procured from third parties | | | | | | | 280 | | | 359 | | | (79) | |
| | | | | | | | | | | |
Net derivative gain (loss) | | | | | | | (73) | | | 110 | | | (183) | |
| Other revenues | | | | | | | 203 | | | 252 | | | (49) | |
| Total LNG revenues | | | | | | | $ | 14,899 | | | $ | 19,569 | | | $ | (4,670) | |
| | | | | | | | | | | |
Volumes delivered as LNG revenues (in TBtu): | | | | | | | | | | | |
LNG from the Liquefaction Projects sold under third party long-term agreements (1) | | | | | | | 2,118 | | | 2,034 | | | 84 | |
LNG from the Liquefaction Projects sold by our integrated marketing function under short-term agreements | | | | | | | 207 | | | 284 | | | (77) | |
| LNG procured from third parties | | | | | | | 24 | | | 35 | | | (11) | |
| Total volumes delivered as LNG revenues | | | | | | | 2,349 | | | 2,353 | | | (4) | |
| | | | | | | | | | | |
| | | | | | | | | | | |
(1)Long-term agreements include agreements with an initial tenor of 12 months or more.
Net income attributable to Cheniere
Net income attributable to Cheniere declined $6.6 billion for the year ended December 31, 2024 as compared to the same period of 2023 and was primarily attributable to $6.7 billion of decreases in gains (before tax and the impact of non-controlling interests) from changes in fair value of derivatives. The majority of the decrease was attributable to our IPM agreements, where the associated gains that are primarily included in cost of sales decreased from $7.0 billion during the year ended December 31, 2023 to $1.5 billion during the year ended December 31, 2024, mainly due to the impact on fair value of the decline and sustained moderation of global LNG and gas price volatility and more subdued changes in the current period relative to the same period of 2023 as global prices and spreads narrowed as a result of market rebalancing. The remaining change in fair value of derivatives was primarily due to an unfavorable shift in long-term U.S. natural gas basis spreads. In addition, there was a $2.8 billion decrease in LNG revenues, net of cost of sales and excluding the effect of derivatives, for the year ended December 31, 2024 as compared to the same period of 2023, the majority of which was attributable to a reduction of volumes sold under short-term agreements as a higher proportion of our LNG was sold under long-term contracts, as further described in Revenues below.
These unfavorable variances were partially offset by:
•$1.7 billion favorable variance in income tax provision between the year ended December 31, 2024 as compared to the same period of 2023, primarily due to lower taxable earnings as described above; and
•$938 million reduction in net income attributable to non-controlling interests during the year ended December 31, 2024 as compared to the same period of 2023, substantially all of which is due to a decrease in CQP’s consolidated net income between the comparable periods from declining gains related to changes in fair value of derivatives between the years.
The following is an additional discussion of the significant drivers of the variance in net income attributable to Cheniere by line item:
Revenues
The $4.7 billion decrease in revenues between the year ended December 31, 2024 compared to the same period of 2023 was primarily attributable to:
•$3.8 billion decrease in revenues generated by our marketing function under short-term agreements between the comparative years due to declining global LNG and gas prices and a reduction of volumes sold under short-term agreements as a result of additional long-term agreements commencing in 2024 as compared to 2023; and
•$676 million decrease in revenues attributable to declining Henry Hub pricing, to which the majority of our long-term LNG sales contracts are indexed, between the years.
Operating costs and expenses
The $4.7 billion unfavorable variance between the year ended December 31, 2024 compared to the same period of 2023 was primarily attributable to:
•$6.5 billion of decreases in gains from changes in fair value of derivatives included in cost of sales, with the primary drivers of the variance described above under the caption Net income attributable to Cheniere;
This unfavorable variance was partially offset by:
•$1.7 billion decrease between the periods in cost of sales excluding the effect of derivative changes described above, primarily as a result of a $1.6 billion decrease in cost of natural gas feedstock largely due to the decline and sustained moderation of global LNG and gas prices as well as lower U.S. natural gas prices in the current year compared to the prior year.
Other income (expense)
The $86 million favorable variance between the year ended December 31, 2024 as compared to the same period of 2023 was primarily attributable to:
•$131 million decrease in interest expense, net of capitalized interest, between the comparable years primarily due to a $92 million increase in interest costs qualifying for capitalization, given the higher carrying value of assets under construction, and additionally due to lower overall interest cost due to debt reduction activities associated with our long-term capital allocation plan;
These favorable variances were partially offset by:
•$24 million increase in losses on modification or extinguishment of debt between the comparable years from debt reduction activities, as further detailed under Financing Cash Flows in Sources and Uses of Cash within Liquidity and Capital Resources; and •$22 million decrease in interest and dividend income between the comparable years, primarily as a result of lower average cash and cash equivalents balances between the respective periods.
Income tax provision
The $1.7 billion favorable variance between the years ended December 31, 2024 and 2023 was primarily attributable to a $9.3 billion decrease in pre-tax income and, to a lesser extent, a lower effective tax rate between the periods.
Our effective tax rate was 15.3% and 17.3% for years ended December 31, 2024 and 2023, respectively. Our effective tax rate decreased between the comparable periods and was lower than the statutory rate of 21.0% because a larger percentage of pre-tax income was attributable to CQP’s income that is not taxable to us.
Net income attributable to non-controlling interests
The $938 million decrease between the year ended December 31, 2024 as compared to the same period of 2023 was primarily attributable to a $1.7 billion decrease in CQP’s consolidated net income, primarily due to $1.5 billion of decreases in gains from the fair value of its IPM agreements accounted for as derivatives.
Significant factor affecting our results of operations
Below is a significant factor that affects our results of operations.
Gains and losses on derivative instruments
Derivative instruments, which we use to manage certain risks, are reported at fair value in our Consolidated Financial Statements. For commodity derivative instruments, including those related to our IPM agreements, the underlying LNG sales being economically hedged are accounted for under the accrual method of accounting, whereby revenues expected to be derived from the future LNG sales are recognized only upon delivery or realization of the underlying transaction. Notwithstanding the operational intent to mitigate risk exposure over time, the recognition of derivative instruments at fair value has the effect of recognizing gains or losses relating to future period exposure, and given the significant volumes, long-term duration and volatility in price basis for certain of our derivative contracts, the use of derivative instruments may result in continued volatility of our results of operations based on changes in market pricing, counterparty credit risk and other relevant factors that may be outside of our control. For example, as described in Note 6—Derivative Instruments of our Notes to Consolidated Financial Statements, the fair value of the Liquefaction Supply Derivatives incorporates, as applicable, market participant-based assumptions pertaining to certain contractual uncertainties, including those related to the availability of market information for delivery points, which may require future development of infrastructure, as well as the timing of satisfaction of certain events or development of infrastructure to support natural gas gathering and transport. We may recognize changes in fair value through earnings that could significantly impact our results of operations if and when such uncertainties are resolved.
Liquidity and Capital Resources
The following information describes our ability to generate and obtain adequate amounts of cash to meet our requirements in the short term and the long term. In the short term, we expect to meet our cash requirements using operating cash flows and available liquidity, consisting of cash and cash equivalents, restricted cash and cash equivalents and available commitments under our credit facilities. Additionally, we expect to meet our long term cash requirements by using operating cash flows and other future potential sources of liquidity, which may include debt and equity offerings by us or our subsidiaries. The table below provides a summary of our available liquidity (in millions). Future material sources of liquidity are discussed below.
| | | | | |
| December 31, 2024 |
| Cash and cash equivalents (1) | $ | 2,638 | |
| |
| |
| |
| |
| |
| |
| |
| Restricted cash and cash equivalents (1) | 552 | |
| Available commitments under our credit facilities (2): | |
| |
SPL Revolving Credit Facility | 776 | |
CQP Revolving Credit Facility | 1,000 | |
| |
CCH Credit Facility | 3,260 | |
CCH Working Capital Facility | 1,390 | |
| Cheniere Revolving Credit Facility | 1,250 | |
| |
| Total available commitments under our credit facilities | 7,676 | |
| |
| Total available liquidity | $ | 10,866 | |
(1)Amounts presented include balances held by our consolidated variable interest entities (“VIEs”), as discussed in Note 8—Non-controlling Interests and Variable Interest Entities of our Notes to Consolidated Financial Statements. As of December 31, 2024, assets of our VIEs, which are included in our Consolidated Balance Sheets, included $270 million of cash and cash equivalents and $125 million of restricted cash and cash equivalents. (2)Available commitments represent total commitments less loans outstanding and letters of credit issued under each of our credit facilities as of December 31, 2024. See Note 10—Debt of our Notes to Consolidated Financial Statements for additional information on our credit facilities and other debt instruments. Our liquidity position subsequent to December 31, 2024 will be driven by future sources of liquidity and future cash requirements, as further discussed under the caption Future Sources and Uses of Liquidity.
Although our sources and uses of cash are presented below from a consolidated standpoint, SPL, CQP, CCH and Cheniere operate with independent capital structures. Certain restrictions or requirements under debt and equity instruments executed by our subsidiaries limit the entity’s use of cash, including the following:
•SPL and CCH are required to deposit all cash received into restricted cash and cash equivalents accounts under certain of their debt agreements. The usage or withdrawal of such cash is restricted to the payment of liabilities related to the Liquefaction Projects and other restricted payments. In addition, SPL and CCH’s operating costs are managed by our subsidiaries under affiliate agreements, which may require SPL and CCH to advance cash to the respective affiliates, however the cash remains restricted for operation and construction of the Liquefaction Projects;
•CQP is required under its partnership agreement to distribute to unitholders all available cash on hand at the end of a quarter less the amount of any reserves established by its general partner. Beginning with the distribution paid in the second quarter of 2022, quarterly distributions by CQP are currently comprised of a base amount plus a variable amount equal to the remaining available cash per unit, which takes into consideration, among other things, amounts reserved for annual debt repayment and capital allocation goals, anticipated capital expenditures to be funded with cash, and cash reserves to provide for the proper conduct of CQP’s business;
•Our 48.6% limited partner interest, 100% general partner interest and incentive distribution rights in CQP limit our right to receive cash held by CQP to the amounts specified by the provisions of CQP’s partnership agreement; and
•SPL and CCH are restricted by affirmative and negative covenants included in certain of their debt agreements in their ability to make certain payments, including distributions, unless specific requirements are satisfied.
Despite the restrictions noted above, we believe that sufficient flexibility exists within the Cheniere complex to enable each independent capital structure to meet its currently anticipated cash requirements. The sources of liquidity at SPL, CQP and CCH primarily fund the cash requirements of the respective entity, and any remaining liquidity not subject to restriction, as supplemented by liquidity provided by Cheniere Marketing, is available to enable Cheniere to meet its cash requirements.
Future Sources and Uses of Liquidity
The following discussion of our future sources and uses of liquidity includes estimates that reflect management’s assumptions and currently known market conditions and other factors as of December 31, 2024. Estimates are not guarantees of future performance and actual results may differ materially as a result of a variety of factors described in this annual report on Form 10-K.
Future Sources of Liquidity under Executed Contracts
We expect future material sources of liquidity to be derived from our long-term customer arrangements and structured cash flows under our SPAs and IPM agreements. As described in Items 1. and 2. Business and Properties, these contracts with creditworthy counterparties form the foundation of our business and provide us with significant, stable, long-term cash flows. Under our long-term SPAs and IPM agreements, we have contracted substantially all of our total anticipated production through the mid-2030s from our liquefaction capacity that is currently under construction or in operation.
LNG Revenues from Executed SPAs
We are contractually entitled to significant future consideration contracted under our long-term SPAs that has not yet been recognized as revenue. The timing of revenue recognition under GAAP may not align with cash receipts, although we do not consider the timing difference to be significant to our future liquidity. In addition, a significant portion of this future consideration is subject to variability as discussed more specifically below. We have estimated revenues under agreements with
terms dependent on project milestone dates based on the estimated dates as of December 31, 2024. The following table summarizes our estimate of revenues to be received from executed long-term SPAs as of December 31, 2024 (in billions):
| | | | | | | | | | | | | | | | | | | | | | | | |
| | | Estimated Revenues Under Executed SPAs by Period (1) (2) |
| | | | | | | | |
| | | 2025 | | 2026 - 2029 | | Thereafter | | Total |
| LNG revenues (fixed fees) | | $ | 6.3 | | | $ | 27.9 | | | $ | 70.5 | | | $ | 104.7 | |
| LNG revenues (variable fees) (3) | | 9.2 | | | 42.0 | | | 124.2 | | | 175.4 | |
| Total | | $ | 15.5 | | | $ | 69.9 | | | $ | 194.7 | | | $ | 280.1 | |
(1)LNG revenues exclude estimated revenues from contracts with unsatisfied contractual conditions precedent. We may enter into contracts to sell LNG that are conditioned upon one or both of the parties achieving certain milestones, such as reaching FID on a certain liquefaction Train.
(2)LNG revenues exclude revenues from contracts with original expected durations of one year or less. LNG revenues also exclude volumes produced from the commissioning of certain Corpus Christi Stage 3 Project Trains, as volumes related to commissioning are not recognized as revenues. We recognize proceeds from commissioning activities prior to the start of commercial operations as offsets to LNG terminal costs as a component of the testing phase of a Train’s construction.
(3)LNG revenues (variable fees) reflect the assumption of delivery of all contractual volumes, irrespective of any contractual right of non-delivery. LNG revenues (variable fees) are based on estimated forward prices and basis spreads as of December 31, 2024.
Under our SPAs, customers purchase LNG on either an FOB basis (delivered to the customer at the Sabine Pass LNG Terminal or the Corpus Christi LNG Terminal, as applicable) or a DAT basis (delivered to the customer at their specified LNG receiving terminal) generally for a price consisting of a fixed fee per MMBtu of LNG (a portion of which is subject to annual adjustment for inflation) plus a variable fee per MMBtu of LNG generally equal to 115% of Henry Hub. The variable fees under our SPAs were generally sized with the intention to cover the supply and transportation of natural gas and the liquefaction fuel consumed to produce the LNG to be sold under each such SPA, thus limiting our exposure to future U.S. natural gas price increases. Certain customers may elect to cancel or suspend deliveries of LNG cargoes, with advance notice as governed by each respective SPA, in which case the customers would still be required to pay the fixed fee with respect to the contracted volumes that are not delivered as a result of such cancellation or suspension.
LNG produced by the Liquefaction Projects that is not contracted under long-term contracts is available for Cheniere Marketing, our integrated marketing function, to sell in the global market under spot sales or other short-term agreements. This LNG includes LNG produced from (1) the Liquefaction Projects prior to the date of first commercial delivery under long-term SPAs, (2) LNG production efficiencies and (3) natural gas procured under IPM agreements, as described below. These volumes may be supplemented by volumes procured from other locations worldwide to support operational requirements or take advantage of market opportunities.
Liquidity from Executed IPM Agreements
The table in the LNG Revenues from Executed SPAs section above excludes fees expected to be generated through sales of LNG produced from natural gas procured under our IPM agreements, under which we pay for natural gas feedstock based on global gas market prices less fixed liquefaction fees and certain costs incurred by us. While IPM agreements are not revenue contracts for accounting purposes, the payment structure under the IPM agreements generates a take-or-pay style fixed liquefaction fee. Although the IPM agreements secure natural gas purchases over long-term periods, the LNG produced from that natural gas is generally sold under short-term SPAs. Over a remaining fixed term of 18 years, we expect to generate liquidity from the approximately 3,825 TBtu of LNG to be produced from natural gas not yet received under IPM agreements as of December 31, 2024, excluding approximately 665 TBtu related to an IPM agreement that is subject to unsatisfied contractual conditions precedent.
Additional Future Sources of Liquidity
Available Commitments under Credit Facilities
As of December 31, 2024, we had $7.7 billion in available commitments under our credit facilities, as detailed earlier in the table summarizing our available liquidity, subject to compliance with the applicable covenants, to potentially meet liquidity needs. Our credit facilities mature between 2026 and 2029, based on estimated project milestone dates as of December 31, 2024.
Disciplined Accretive Growth
Our significant land positions at the Corpus Christi LNG Terminal and the Sabine Pass LNG Terminal provide potential development and investment opportunities for further liquefaction capacity expansion at strategically advantaged locations with proximity to pipeline infrastructure and resources. In February 2024, certain subsidiaries of CQP submitted an application to the FERC under the NGA for authorization to site, construct and operate the SPL Expansion Project, as well as an application to the DOE requesting authorization to export LNG to FTA countries and non-FTA countries, both of which applications exclude debottlenecking. In October 2024, the authorization from the DOE to export LNG to FTA countries was received. In June 2024, we received a positive Environmental Assessment from the FERC relating to the CCL Midscale Trains 8 & 9 Project, and we expect to receive all remaining necessary regulatory approvals for the project in 2025. The development of these sites or other projects, including infrastructure projects in support of natural gas supply and LNG demand, will require, among other things, acceptable commercial and financing arrangements before we make a positive FID.
Future Cash Requirements for Operations and Capital Expenditures under Executed Contracts
We are committed to make future cash payments for operations and capital expenditures pursuant to certain of our contracts. The following table summarizes our estimate of material cash requirements for operations and capital expenditures related to our core operations under executed contracts as of December 31, 2024 (in billions):
| | | | | | | | | | | | | | | | | | | | | | | | |
| | Estimated Payments Due Under Executed Contracts by Period (1) |
| | | | | | | | |
| | 2025 | | 2026 - 2029 | | Thereafter | | Total |
| Purchase obligations (2): | | | | | | | | |
Natural gas supply agreements excluding IPM agreements (3) (4) | | $ | 6.6 | | | $ | 16.4 | | | $ | 6.6 | | | $ | 29.6 | |
| Natural gas transportation and storage service agreements (5) | | 0.5 | | | 2.0 | | | 4.4 | | | 6.9 | |
| Capital expenditures | | 1.6 | | | 0.6 | | | — | | | 2.2 | |
| Other Purchase Obligations | | — | | | 0.2 | | | 0.5 | | | 0.7 | |
| Leases (6) | | 0.7 | | | 2.9 | | | 3.4 | | | 7.0 | |
| | | | | | | | |
| | | | | | | | |
| Total | | $ | 9.4 | | | $ | 22.1 | | | $ | 14.9 | | | $ | 46.4 | |
(1)Agreements in force as of December 31, 2024 that have terms dependent on project milestone dates are based on the estimated dates as of December 31, 2024.
(2)Purchase obligations consist of agreements to purchase goods or services that are enforceable and legally binding that specify fixed or minimum quantities to be purchased. We include contracts for which we have an early termination option if the option is not currently expected to be exercised. We include contracts with unsatisfied contractual conditions if the conditions are currently expected to be met.
(3)Natural gas supply agreements exclude IPM agreements, which are structured to generate a fixed margin when viewed in conjunction with the sale of LNG produced from the natural gas procured under the IPM agreements, as described under Liquidity from Executed IPM Agreements.
(4)Pricing of natural gas supply agreements is based on estimated forward prices and basis spreads as of December 31, 2024. Natural gas supply agreements are presented net of $0.3 billion in contracted sales of natural gas as of December 31, 2024.
(5)Natural gas transportation and storage services agreements include $1.2 billion in obligations to related parties.
(6)Leases include payments under (1) operating leases, (2) finance leases, (3) short-term leases and (4) vessel time charters that were executed as of December 31, 2024 but will commence in the future. Payments during future renewal option periods that are exercisable at our sole discretion are included only to the extent that the option is believed to be reasonably certain to be exercised. Leases are presented net of $1.2 billion in future income associated with vessel time charters that were subchartered to third parties.
Natural Gas Supply, Transportation and Storage Service Agreements
Excluding IPM agreements and unexercised extension options, we have secured approximately 7,980 TBtu of natural gas feedstock for our Liquefaction Projects through long-term natural gas supply agreements with remaining fixed terms of up to 15 years. As of December 31, 2024, we have secured approximately 74% of the natural gas supply required to support the total forecasted production capacity of the Liquefaction Projects during 2025, excluding the 6% of which has been secured under IPM agreements. Natural gas supply secured decreases as a percentage of forecasted production capacity beyond 2025. As further described in the LNG Revenues from Executed SPAs section, the pricing structure of our SPAs often incorporates a variable fee per MMBtu of LNG generally equal to 115% of Henry Hub, which is paid upon delivery, thus limiting our net exposure to future increases in natural gas prices.
To ensure that we are able to transport natural gas feedstock to the Liquefaction Projects, we have transportation precedent and other agreements to secure firm pipeline transportation capacity from interstate and intrastate pipeline companies. We have also entered into firm storage services agreements with third parties to assist in managing variability in natural gas needs for the Liquefaction Projects.
Capital Expenditures
We enter into lump sum turnkey contracts with third party contractors for the EPC of our Liquefaction Projects. The future capital expenditures included in the table above primarily consist of fixed costs under the lump sum Bechtel EPC contract for the Corpus Christi Stage 3 Project, in which Bechtel charges a lump sum and generally bears project cost, schedule and performance risks unless certain specified events occur, in which case Bechtel causes us to enter into a change order, or we agree with Bechtel to a change order. In addition to amounts presented in the table above, we expect to incur ongoing capital expenditures to maintain our facilities and other assets, as well as to optimize our existing assets and purchase new assets that are intended to grow our productive capacity.
Corpus Christi Stage 3 Project
The following table summarizes the project completion and construction status of the Corpus Christi Stage 3 Project as of December 31, 2024:
| | | | | | | | | | | |
| | |
| Overall project completion percentage | | 77.2% |
| Completion percentage of: | | |
| Engineering | | 97.2% |
| Procurement | | 97.2% |
| Subcontract work | | 88.2% |
| Construction | | 42.6% |
| Date of expected substantial completion | | 1H 2025 - 2H 2026 |
Leases
Our obligations under our lease arrangements primarily consist of LNG vessel time charters with terms of up to 15 years to ensure delivery of cargoes sold on a DAT basis. We have also entered into leases for the use of tug vessels, office space and facilities, land sites and equipment.
Additional Future Cash Requirements for Operations and Capital Expenditures
Corporate Activities
We are required to maintain corporate and general and administrative functions to serve our business activities. During the year ended December 31, 2024, selling, general and administrative expense was $0.4 billion, a portion of which was related to leases for office space which is included in the table of cash requirements for operations and capital expenditures under executed contracts above.
Taxes
CAMT accelerates our cash tax payments for federal income taxes due to near-term deferral of the realization of our existing NOL carryforwards and may cause volatility in future cash tax payments due to variability in adjusted financial statement income. Additionally, our cash tax payments may be substantially lower in the periods that the Corpus Christi Stage 3 Project is placed into service due to anticipated tax depreciation allowances from the project. Thus, the ongoing interplay between the CAMT, the utilization of our existing NOLs and bonus depreciation eligibility of our Corpus Christi Stage 3 Project is expected to cause volatility in our cash tax payments. See the risk Additions or changes in tax laws and regulations could potentially affect our financial results or liquidity under Risks Relating to Regulations in Item 1A. Risk Factors.
As part of our ongoing effort to mitigate our emissions from our shipping transport operations, we primarily utilize the LNG that we produce at our terminals as transport fuel in our shipping vessel operations, serving as a substitute for diesel and heavy fuel oils, which have higher emission factors. Our use of LNG as a cleaner burning fuel in our operations has enabled us to claim domestic alternative fuel excise tax credits which we are actively pursuing for the period spanning from 2018 to 2024. Although we believe we qualify and are entitled to claim such credits, we have not recognized any financial benefit of our credit claims in our results of operations to date. Our claims are currently under review by the IRS, and there is ongoing uncertainty regarding the final determination of our eligibility.
Disciplined Accretive Growth
The FID of any expansion projects will result in additional cash requirements to fund the construction and operations of such projects in excess of our current contractual obligations under executed contracts discussed above, although expansion may be designed to leverage shared infrastructure to reduce the incremental costs of any potential expansion.
Future Cash Requirements for Financing under Executed Contracts
We are committed to make future cash payments for financing pursuant to certain of our contracts. The following table summarizes our estimate of material cash requirements for financing under executed contracts as of December 31, 2024 (in billions):
| | | | | | | | | | | | | | | | | | | | | | | | |
| | | Estimated Payments Due Under Executed Contracts by Period (1) |
| | | | | | | | |
| | | 2025 | | 2026 - 2029 | | Thereafter | | Total |
| Debt | | $ | 0.4 | | | $ | 10.5 | | | $ | 12.2 | | | $ | 23.1 | |
| Interest payments | | 1.1 | | | 3.5 | | | 2.0 | | | 6.6 | |
| Total | | $ | 1.5 | | | $ | 14.0 | | | $ | 14.2 | | | $ | 29.7 | |
(1)Debt and interest payments are based on the total debt balance, scheduled contractual maturities and fixed or estimated forward interest rates in effect at December 31, 2024. Debt and interest payments do not contemplate repurchases, repayments and retirements that we may make prior to contractual maturity.
Debt
As of December 31, 2024, our debt complex was comprised of senior notes with an aggregate outstanding principal balance of $23.1 billion and credit facilities with no outstanding loan balances. As of December 31, 2024, each of our issuers was in compliance with all covenants related to their respective debt agreements. Further discussion of our debt obligations, including the restrictions imposed by these arrangements, can be found in Note 10—Debt of our Notes to Consolidated Financial Statements.
Interest
As of December 31, 2024, our senior notes had a weighted average contractual interest rate of 4.69%. Borrowings under our credit facilities are indexed to SOFR. Undrawn commitments under our credit facilities are subject to commitment fees ranging from 0.075% to 0.525%, subject to change based on the applicable entity’s credit rating. Issued letters of credit under our credit facilities are subject to letter of credit fees ranging from 1.0% to 2.20%, subject to change based on the applicable entity’s credit rating. We had $334 million aggregate amount of issued letters of credit under our credit facilities as of December 31, 2024.
Additional Future Cash Requirements for Financing
CQP Distributions
CQP is required by its partnership agreement to, within 45 days after the end of each quarter, distribute to unitholders all available cash at the end of a quarter less the amount of any reserves established by its general partner. We own a 48.6% limited partner interest in CQP in the form of 239.9 million common units, 100% of the general partner interest and 100% of the incentive distribution rights, with the remaining non-controlling limited partner interest held by Blackstone Inc., Brookfield Asset Management Inc. and the public. During the year ended December 31, 2024, $846 million in distributions were paid to our non-controlling interests.
Capital Allocation Plan
In June 2024, our Board approved an updated comprehensive long-term capital allocation plan, which included an increase to our share repurchase authorization by $4.0 billion through 2027. As of December 31, 2024, we had up to $3.9 billion available under the share repurchase program. The timing and amount of any shares of our common stock that are repurchased under the share repurchase program will be determined by management based on market conditions and other factors, with repurchases executed within trading parameters pre-established for each applicable trading period in compliance with SEC Rule 10b5-1. During the year ended December 31, 2024, we repurchased approximately 13.8 million shares of our common stock for $2.3 billion at a weighted average price per share of $163.72. A discussion of our share repurchase program can be found in Item 5. Market for Registrant’s Common Equity, Related Stockholders Matters and Issuer Purchase of Equity Securities.
Another aspect of our capital allocation plan is to lower our long-term leverage target through debt paydown to approximately 4x, which may involve the repayment, redemption or repurchase, on the open market or otherwise, of our indebtedness, including senior notes of SPL, CQP, CCH and Cheniere. The timing and amount of any paydown of our indebtedness will be determined by management based on market conditions and other factors. During the year ended December 31, 2024, we used $800 million of available cash to reduce our outstanding indebtedness, all of which was pursuant to our capital allocation plan.
The updated capital allocation plan also included a plan to increase our quarterly dividend by approximately 15% to $2.00 per common share on an annualized basis, which commenced with the dividend pertaining to the third quarter of 2024. On January 28, 2025, we declared a quarterly dividend of $0.50 per share of common stock that is payable on February 21, 2025 to stockholders of record as of the close of business on February 7, 2025.
Financially Disciplined Growth
To the extent that liquefaction capacity at the Corpus Christi LNG Terminal and the Sabine Pass LNG Terminal is expanded beyond the Liquefaction Projects, such as the CCL Midscale Trains 8 & 9 Project and the SPL Expansion Project, we expect that additional financing would be used to fund construction of the expansion.
Sources and Uses of Cash
The following table summarizes the sources and uses of our cash, cash equivalents and restricted cash and cash equivalents (in millions). The table presents capital expenditures on a cash basis; therefore, these amounts differ from the amounts of capital expenditures, including accruals, which are referred to elsewhere in this report. Additional discussion of these items follows the table.
| | | | | | | | | | | | | |
| Year Ended December 31, |
| 2024 | | 2023 | | |
| | | | | |
| Net cash provided by operating activities | $ | 5,394 | | | $ | 8,418 | | | |
| Net cash used in investing activities | (2,279) | | | (2,202) | | | |
| Net cash used in financing activities | (4,451) | | | (4,180) | | | |
| Effect of exchange rate changes on cash, cash equivalents and restricted cash and cash equivalents | 1 | | | 2 | | | |
| | | | | |
| | | | | |
| | | | | |
| | | | | |
| | | | | |
| | | | | |
| | | | | |
| | | | | |
| | | | | |
| | | | | |
| | | | | |
| | | | | |
| | | | | |
| | | | | |
| | | | | |
| | | | | |
| | | | | |
Net increase (decrease) in cash, cash equivalents and restricted cash and cash equivalents | $ | (1,335) | | | $ | 2,038 | | | |
| | | | | |
| | | | | |
Operating Cash Flows
The $3.0 billion decrease between the periods was primarily related to lower cash receipts from the sale of LNG cargoes due to a reduction in both pricing per MMBtu and volumes sold under short-term agreements, although this exposed us less to declining international LNG and gas prices in the current year as a higher proportion of our LNG was sold under long-term agreements. The decrease was partially offset by lower cash outflows for natural gas feedstock, largely due to the decline and sustained moderation of global LNG and gas prices as well as lower U.S. natural gas prices during the year ended December 31, 2024 as compared to December 31, 2023.
We became subject to the 15% CAMT in 2024. For the period ended December 31, 2024, our CAMT liability exceeded our regular tax liability by $383 million which created a CAMT credit carryforward with indefinite life. Our CAMT liability exceeded our regular tax liability in 2024 primarily because we used approximately $2.8 billion of our NOL carryover from 2019 to offset our regular taxable income; however, such NOL carryover does not factor into our CAMT computation resulting in a higher CAMT tax base. We may continue to owe CAMT in future periods until the time our existing NOL carryovers are fully exhausted. Additionally, any final regulatory guidance related to the CAMT issued in the future could significantly affect the timing and amount of our CAMT obligations.
During 2024, the IRS issued Notice 2024-66 which extended the due date of our CAMT estimated payments to April 15, 2025. As a result, the majority of our current tax expense incurred for the year ended December 31, 2024 will be paid in 2025.
Additionally, our cash taxes in the near term could potentially be impacted by possible new federal tax legislation being enacted. Several key provisions of the Tax Cuts and Jobs Act (the “TCJA”) are set to expire or change after 2025, raising the prospects for a new tax bill being enacted in 2025. While the current corporate tax rate of 21% established by the TCJA is permanent and not set to expire, President Trump has proposed reducing the rate to 15% for U.S. manufacturers. Any significant changes to the corporate tax rate, Foreign-Derived Intangible Income provisions, immediate expensing rules or other key tax policies in 2025 could affect our financial position and liquidity. While we are unable to predict the timing and scope of any potential tax legislation, we continue to monitor and assess any proposed tax law changes to determine the impact on our business, cash flows and financial results.
Investing Cash Flows
Our investing net cash outflows in both periods primarily were for the construction costs for the Corpus Christi Stage 3 Project, which were $1.5 billion during both the years ended December 31, 2024 and 2023, as well as for optimization and other site improvement projects. We expect to incur a proportional level of capital expenditures in the upcoming year as construction work progresses on the Corpus Christi Stage 3 Project.
Financing Cash Flows
The following table summarizes our financing activities (in millions):
| | | | | | | | | | | | | | |
| | Year Ended December 31, |
| | 2024 | | 2023 |
| Proceeds from issuances of debt | | $ | 2,725 | | | $ | 1,397 | |
| Redemptions, repayments and repurchases of debt | | (3,521) | | | (2,598) | |
| | | | |
| | | | |
| Distributions to non-controlling interests | | (846) | | | (1,016) | |
| Payments related to tax withholdings for share-based compensation | | (46) | | | (63) | |
| Repurchase of common stock | | (2,262) | | | (1,473) | |
| Dividends to stockholders | | (412) | | | (393) | |
| Other, net | | (89) | | | (34) | |
| Net cash used in financing activities | | $ | (4,451) | | | $ | (4,180) | |
Debt Issuances
The following table shows our debt issuances (in millions):
| | | | | | | | | | | |
| Year Ended December 31, |
| 2024 | | 2023 |
| Proceeds from issuances of debt | | | |
| Cheniere: | | | |
| 2034 Cheniere Senior Notes | $ | 1,497 | | | $ | — | |
| | | |
| CQP: | | | |
| 2034 CQP Senior Notes | 1,198 | | | — | |
5.950% Senior Notes due 2033 | — | | | 1,397 | |
| | | |
| SPL: | | | |
| SPL Revolving Credit Facility | 30 | | | — | |
| Total proceeds from issuances of debt | $ | 2,725 | | | $ | 1,397 | |
Debt Redemptions, Repayments and Repurchases
The following table shows the redemptions, repayments and repurchases of debt, including intra-year repayments (in millions):
| | | | | | | | | | | | | | | | |
| | Year Ended December 31, |
| | 2024 | | 2023 | | |
| Redemptions, repayments and repurchases of debt | | | | | | |
| SPL: | | | | | | |
5.750% Senior Secured Notes due 2024 | | $ | (300) | | | $ | (1,700) | | | |
5.625% Senior Secured Notes due 2025 | | (1,700) | | | — | | | |
| | | | | | |
| SPL Revolving Capital Facility | | (30) | | | — | | | |
| | | | | | |
| | | | | | |
| | | | | | |
| | | | | | |
| | | | | | |
| | | | | | |
| CCH: | | | | | | |
| | | | | | |
| | | | | | |
7.000% Senior Notes due 2024 | | — | | | (498) | | | |
5.875% Senior Notes due 2025 | | (1,491) | | | — | | | |
5.125% Senior Notes due 2027 | | — | | | (69) | | | |
3.700% Senior Notes due 2029 | | — | | | (237) | | | |
| 2.742% Senior Notes due 2039 | | — | | | (94) | | | |
| | | | | | |
| | | | | | |
| | | | | | |
| | | | | | |
| | | | | | |
| | | | | | |
| | | | | | |
| | | | | | |
| | | | | | |
| Total redemptions, repayments and repurchases of debt | | $ | (3,521) | | | $ | (2,598) | | | |
Repurchase of Common Stock
During the years ended December 31, 2024 and 2023, we paid $2.3 billion and $1.5 billion to repurchase approximately 13.8 million and 9.5 million shares of our common stock, respectively, under our share repurchase program. As of December 31, 2024, we had approximately $3.9 billion remaining under our share repurchase program.
Cash Dividends to Stockholders
We paid aggregate dividends of $1.805 per share of common stock for a total of $412 million during the year ended December 31, 2024 and $1.62 per share of common stock for a total of $393 million during the year ended December 31, 2023.
On January 28, 2025, we declared a quarterly dividend of $0.50 per share of common stock that is payable on February 21, 2025 to stockholders of record as of the close of business on February 7, 2025.
Summary of Critical Accounting Estimates
The preparation of our Consolidated Financial Statements in conformity with GAAP requires management to make certain estimates and assumptions that affect the amounts reported in the Consolidated Financial Statements and the accompanying notes. Management evaluates its estimates and related assumptions regularly, including those related to the valuation of derivative instruments. Changes in facts and circumstances or additional information may result in revised estimates, and actual results may differ from these estimates. Management considers the following to be its most critical accounting estimates that involve significant judgment.
Fair Value of Level 3 Liquefaction Supply Derivatives
All of our derivative instruments are recorded at fair value, as described in Note 2—Summary of Significant Accounting Policies of our Notes to Consolidated Financial Statements. We record changes in the fair value of our derivative positions through earnings, based on the value for which the derivative instrument could be exchanged between willing parties. Valuation of our liquefaction supply derivative contracts is often developed through the use of internal models which includes significant unobservable inputs representing Level 3 fair value measurements as further described in Note 2—Summary of Significant Accounting Policies of our Notes to Consolidated Financial Statements. In instances where observable data is unavailable, consideration is given to the assumptions that market participants may use in valuing the asset or liability. To the extent valued using an option pricing model, we consider the future prices of energy units for unobservable periods to be a significant unobservable input to estimated net fair value. In estimating the future prices of energy units, we make judgments about market risk related to liquidity of commodity indices and volatility utilizing available market data. Changes in facts and circumstances or additional information may result in revised estimates and judgments, and actual results may differ from these estimates and judgments. We derive our volatility assumptions based on observed historical settled global LNG market pricing or accepted proxies for global LNG market pricing as well as settled domestic natural gas pricing. Such volatility assumptions also contemplate, as of the balance sheet date, observable forward curve data of such indices, as well as evolving available industry data and independent studies. In developing our volatility assumptions, we acknowledge that the global LNG industry is inherently influenced by events such as unplanned supply constraints, geopolitical incidents, unusual climate events including drought and uncommonly mild, by historical standards, winters and summers, and real or threatened disruptive operational impacts to global energy infrastructure. Our current estimate of volatility does not exclude the impact of otherwise rare events unless we believe market participants would exclude such events on account of their assertion that those events were specific to our company and deemed within our control. As applicable to our natural gas supply contracts, our fair value estimates incorporate market participant-based assumptions pertaining to applicable contractual uncertainties, including those related to the availability of market information for delivery points, as well as the timing of both satisfaction of contractual events or states of affairs and delivery commencement. We may recognize changes in fair value through earnings that could be significant to our results of operations if and when such uncertainties are resolved.
Additionally, the valuation of certain liquefaction supply derivatives requires significant judgment in estimating underlying forward commodity curves due to periods of unobservability or limited liquidity. Such valuations are more susceptible to variability particularly when markets are volatile. Provided below are the changes in fair value from valuation of instruments valued through the use of internal models which incorporate significant unobservable inputs for the years ended
December 31, 2024 and 2023 (in millions), which entirely consisted of liquefaction supply derivatives. The changes in fair value shown are limited to instruments still held at the end of each respective period.
| | | | | | | | | | | | |
| | Year Ended December 31, |
| | 2024 | | 2023 |
Favorable changes in fair value relating to instruments still held at the end of the period | | $ | 738 | | | $ | 5,700 | |
The changes in fair value on instruments held at the end of both years are primarily attributed to a significant variance in the estimated and observable forward international LNG commodity prices on our IPM agreements in effect during the years ended December 31, 2024 and 2023.
The estimated fair value of level 3 derivatives recognized in our Consolidated Balance Sheets as of December 31, 2024 and 2023 amounted to a liability of $801 million and $2.2 billion, respectively.
The ultimate fair value of our derivative instruments is uncertain, and we believe that it is reasonably possible that a material change in the estimated fair value could occur in the near future, particularly as it relates to commodity prices impacting the valuation of our liquefaction supply derivatives, given the level of volatility to which such prices are subjected. See Item 7A. Quantitative and Qualitative Disclosures About Market Risk for further analysis of the sensitivity of the fair value of our derivatives to hypothetical changes in underlying prices. Recent Accounting Standards
ITEM 7A. QUANTITATIVE AND QUALITATIVE DISCLOSURES ABOUT MARKET RISK
Marketing and Trading Commodity Price Risk
We have commodity derivatives consisting of natural gas and power supply contracts for the commissioning and operation of the Liquefaction Projects and the SPL Expansion Project, and associated economic hedges (collectively, the “Liquefaction Supply Derivatives”) and physical and financial derivatives to hedge the exposure to the commodity markets in which we have contractual arrangements to purchase or sell physical LNG (collectively, “LNG Trading Derivatives”). In order to test the sensitivity of the fair value of the Liquefaction Supply Derivatives and the LNG Trading Derivatives to changes in underlying commodity prices, management modeled a 10% change in the commodity price for natural gas for each delivery location and a 10% change in the commodity price for LNG, respectively, as follows (in millions):
| | | | | | | | | | | | | | | | | | | | | | | |
| December 31, 2024 | | December 31, 2023 |
| Fair Value | | Change in Fair Value | | Fair Value | | Change in Fair Value |
| Liquefaction Supply Derivatives | $ | (742) | | | $ | 2,516 | | | $ | (2,117) | | | $ | 1,526 | |
| LNG Trading Derivatives | 17 | | | 49 | | | 10 | | | 12 | |
See Note 6—Derivative Instruments of our Notes to Consolidated Financial Statements for additional details about our commodity derivative instruments.
ITEM 8. FINANCIAL STATEMENTS AND SUPPLEMENTARY DATA
INDEX TO CONSOLIDATED FINANCIAL STATEMENTS
CHENIERE ENERGY, INC. AND SUBSIDIARIES
MANAGEMENT’S REPORT TO THE STOCKHOLDERS OF CHENIERE ENERGY, INC.
Management’s Report on Internal Control Over Financial Reporting
As management, we are responsible for establishing and maintaining adequate internal control over financial reporting for Cheniere. In order to evaluate the effectiveness of internal control over financial reporting, as required by Section 404 of the Sarbanes-Oxley Act of 2002, we have conducted an assessment, including testing using the criteria in Internal Control — Integrated Framework (2013) issued by the Committee of Sponsoring Organizations of the Treadway Commission (“COSO”). Cheniere’s system of internal control over financial reporting is designed to provide reasonable assurance regarding the reliability of financial reporting and the preparation of financial statements for external purposes in accordance with GAAP. Because of its inherent limitations, internal control over financial reporting may not prevent or detect misstatements and, even when determined to be effective, can only provide reasonable assurance with respect to financial statement preparation and presentation.
Based on our assessment, we have concluded that Cheniere maintained effective internal control over financial reporting as of December 31, 2024, based on criteria in Internal Control—Integrated Framework (2013) issued by the COSO.
Cheniere’s independent registered public accounting firm, KPMG LLP, has issued an audit report on Cheniere’s internal control over financial reporting as of December 31, 2024, which is contained in this Form 10-K.
Management’s Certifications
The certifications of Cheniere’s Chief Executive Officer and Chief Financial Officer required by the Sarbanes-Oxley Act of 2002 have been included as Exhibits 31 and 32 in Cheniere’s Form 10-K.
CHENIERE ENERGY, INC.
| | | | | | | | | | | | | | |
| | | | | |
| By: | /s/ Jack A. Fusco | | By: | /s/ Zach Davis |
| Jack A. Fusco | | | Zach Davis |
| | President and Chief Executive Officer
(Principal Executive Officer) | | | Executive Vice President and Chief Financial Officer
(Principal Financial Officer) |
Report of Independent Registered Public Accounting Firm
To the Stockholders and Board of Directors
Cheniere Energy, Inc.:
Opinion on the Consolidated Financial Statements
We have audited the accompanying consolidated balance sheets of Cheniere Energy, Inc. and subsidiaries (the Company) as of December 31, 2024 and 2023, the related consolidated statements of operations, stockholders’ equity (deficit) and redeemable non-controlling interest, and cash flows for each of the years in the three-year period ended December 31, 2024, and the related notes (collectively, the consolidated financial statements). In our opinion, the consolidated financial statements present fairly, in all material respects, the financial position of the Company as of December 31, 2024 and 2023, and the results of its operations and its cash flows for each of the years in the three-year period ended December 31, 2024, in conformity with U.S. generally accepted accounting principles.
We also have audited, in accordance with the standards of the Public Company Accounting Oversight Board (United States) (PCAOB), the Company’s internal control over financial reporting as of December 31, 2024, based on criteria established in Internal Control – Integrated Framework (2013) issued by the Committee of Sponsoring Organizations of the Treadway Commission, and our report dated February 19, 2025 expressed an unqualified opinion on the effectiveness of the Company’s internal control over financial reporting.
Basis for Opinion
These consolidated financial statements are the responsibility of the Company’s management. Our responsibility is to express an opinion on these consolidated financial statements based on our audits. We are a public accounting firm registered with the PCAOB and are required to be independent with respect to the Company in accordance with the U.S. federal securities laws and the applicable rules and regulations of the Securities and Exchange Commission and the PCAOB.
We conducted our audits in accordance with the standards of the PCAOB. Those standards require that we plan and perform the audit to obtain reasonable assurance about whether the consolidated financial statements are free of material misstatement, whether due to error or fraud. Our audits included performing procedures to assess the risks of material misstatement of the consolidated financial statements, whether due to error or fraud, and performing procedures that respond to those risks. Such procedures included examining, on a test basis, evidence regarding the amounts and disclosures in the consolidated financial statements. Our audits also included evaluating the accounting principles used and significant estimates made by management, as well as evaluating the overall presentation of the consolidated financial statements. We believe that our audits provide a reasonable basis for our opinion.
Critical Audit Matter
The critical audit matter communicated below is a matter arising from the current period audit of the consolidated financial statements that was communicated or required to be communicated to the audit committee and that: (1) relates to accounts or disclosures that are material to the consolidated financial statements and (2) involved our especially challenging, subjective, or complex judgments. The communication of a critical audit matter does not alter in any way our opinion on the consolidated financial statements, taken as a whole, and we are not, by communicating the critical audit matter below, providing a separate opinion on the critical audit matter or on the accounts or disclosures to which it relates.
Fair value of the level 3 liquefaction supply derivatives
As discussed in Notes 2 and 6 to the consolidated financial statements, the Company recorded fair value of level 3 liquefaction supply derivatives of $(801) million as of December 31, 2024, which included the fair value of IPM agreements. The IPM agreements are natural gas supply contracts for the operation of the liquefied natural gas facilities. The fair value of the IPM agreements is developed using internal models, including option pricing models. The models incorporate significant unobservable inputs, including future prices of energy units in unobservable periods and volatility.
We identified the evaluation of the fair value of the level 3 liquefaction supply derivatives for certain IPM agreements as a critical audit matter. Specifically, complex auditor judgment and specialized skills and knowledge were required to evaluate the appropriateness and application of the option pricing model as well as the assumptions for future prices of energy units in unobservable periods and volatility.
The following are the primary procedures we performed to address this critical audit matter. We evaluated the design and tested the operating effectiveness of certain internal controls related to the valuation of liquefaction supply derivatives, including those under certain IPM agreements. This included controls related to the appropriateness and application of the option pricing model and the evaluation of assumptions for future prices of energy units in unobservable periods and volatility. We involved valuation professionals with specialized skills and knowledge who assisted in testing management’s process for developing the fair value of certain IPM agreements by:
•evaluating the design and testing the operating effectiveness of certain internal controls related to the appropriateness and application of the option pricing model
•evaluating the appropriateness and application of the option pricing model by inspecting the contractual agreements and model documentation to determine whether the model is suitable for its intended use
•evaluating the reasonableness of management’s assumptions for future prices of energy units in unobservable periods and volatility by comparing to market data.
We have served as the Company’s auditor since 2014.
Houston, Texas
February 19, 2025
REPORT OF INDEPENDENT REGISTERED PUBLIC ACCOUNTING FIRM
To the Stockholders and Board of Directors
Cheniere Energy, Inc.:
Opinion on Internal Control Over Financial Reporting
We have audited Cheniere Energy, Inc. and subsidiaries’ (the Company) internal control over financial reporting as of December 31, 2024, based on criteria established in Internal Control — Integrated Framework (2013) issued by the Committee of Sponsoring Organizations of the Treadway Commission. In our opinion, the Company maintained, in all material respects, effective internal control over financial reporting as of December 31, 2024, based on criteria established in Internal Control — Integrated Framework (2013) issued by the Committee of Sponsoring Organizations of the Treadway Commission.
We also have audited, in accordance with the standards of the Public Company Accounting Oversight Board (United States) (PCAOB), the consolidated balance sheets of the Company as of December 31, 2024 and 2023, the related consolidated statements of operations, stockholders’ equity (deficit) and redeemable non-controlling interest, and cash flows for each of the years in the three-year period ended December 31, 2024, and the related notes (collectively, the consolidated financial statements), and our report dated February 19, 2025 expressed an unqualified opinion on those consolidated financial statements.
Basis for Opinion
The Company’s management is responsible for maintaining effective internal control over financial reporting and for its assessment of the effectiveness of internal control over financial reporting, included in the accompanying Management’s Report on Internal Control Over Financial Reporting. Our responsibility is to express an opinion on the Company’s internal control over financial reporting based on our audit. We are a public accounting firm registered with the PCAOB and are required to be independent with respect to the Company in accordance with the U.S. federal securities laws and the applicable rules and regulations of the Securities and Exchange Commission and the PCAOB.
We conducted our audit in accordance with the standards of the PCAOB. Those standards require that we plan and perform the audit to obtain reasonable assurance about whether effective internal control over financial reporting was maintained in all material respects. Our audit of internal control over financial reporting included obtaining an understanding of internal control over financial reporting, assessing the risk that a material weakness exists, and testing and evaluating the design and operating effectiveness of internal control based on the assessed risk. Our audit also included performing such other procedures as we considered necessary in the circumstances. We believe that our audit provides a reasonable basis for our opinion.
Definition and Limitations of Internal Control Over Financial Reporting
A company’s internal control over financial reporting is a process designed to provide reasonable assurance regarding the reliability of financial reporting and the preparation of financial statements for external purposes in accordance with generally accepted accounting principles. A company’s internal control over financial reporting includes those policies and procedures that (1) pertain to the maintenance of records that, in reasonable detail, accurately and fairly reflect the transactions and dispositions of the assets of the company; (2) provide reasonable assurance that transactions are recorded as necessary to permit preparation of financial statements in accordance with generally accepted accounting principles, and that receipts and expenditures of the company are being made only in accordance with authorizations of management and directors of the company; and (3) provide reasonable assurance regarding prevention or timely detection of unauthorized acquisition, use, or disposition of the company’s assets that could have a material effect on the financial statements.
Because of its inherent limitations, internal control over financial reporting may not prevent or detect misstatements. Also, projections of any evaluation of effectiveness to future periods are subject to the risk that controls may become inadequate because of changes in conditions, or that the degree of compliance with the policies or procedures may deteriorate.
Houston, Texas
February 19, 2025
CHENIERE ENERGY, INC. AND SUBSIDIARIES
CONSOLIDATED STATEMENTS OF OPERATIONS
(in millions, except per share data)
| | | | | | | | | | | | | | | | | | | | | |
| | | Year Ended December 31, |
| | | | | 2024 | | 2023 | | 2022 |
| Revenues | | | | | | | | | |
| LNG revenues | | | | | $ | 14,899 | | | $ | 19,569 | | | $ | 31,804 | |
| Regasification revenues | | | | | 135 | | | 135 | | | 1,068 | |
| Other revenues | | | | | 669 | | | 690 | | | 556 | |
| | | | | | | | | |
| Total revenues | | | | | 15,703 | | | 20,394 | | | 33,428 | |
| | | | | | | | | |
| Operating costs and expenses | | | | | | | | | |
| Cost of sales (excluding items shown separately below) | | | | | 6,021 | | | 1,356 | | | 25,632 | |
| | | | | | | | | |
| Operating and maintenance expense | | | | | 1,857 | | | 1,835 | | | 1,681 | |
| | | | | | | | | |
| Selling, general and administrative expense | | | | | 441 | | | 474 | | | 416 | |
| Depreciation, amortization and accretion expense | | | | | 1,220 | | | 1,196 | | | 1,119 | |
| | | | | | | | | |
| | | | | | | | | |
| | | | | | | | | |
| Other operating costs and expenses | | | | | 36 | | | 44 | | | 21 | |
| | | | | | | | | |
| Total operating costs and expenses | | | | | 9,575 | | | 4,905 | | | 28,869 | |
| | | | | | | | | |
| Income from operations | | | | | 6,128 | | | 15,489 | | | 4,559 | |
| | | | | | | | | |
| Other income (expense) | | | | | | | | | |
| Interest expense, net of capitalized interest | | | | | (1,010) | | | (1,141) | | | (1,406) | |
| Gain (loss) on modification or extinguishment of debt | | | | | (9) | | | 15 | | | (66) | |
| | | | | | | | | |
| Interest and dividend income | | | | | 189 | | | 211 | | | 57 | |
| Other income (expense), net | | | | | 5 | | | 4 | | | (50) | |
| Total other expense | | | | | (825) | | | (911) | | | (1,465) | |
| | | | | | | | | |
| Income before income taxes and non-controlling interests | | | | | 5,303 | | | 14,578 | | | 3,094 | |
| Less: income tax provision | | | | | 811 | | | 2,519 | | | 459 | |
| Net income | | | | | 4,492 | | | 12,059 | | | 2,635 | |
| Less: net income attributable to non-controlling interests | | | | | 1,240 | | | 2,178 | | | 1,207 | |
| Net income attributable to Cheniere | | | | | $ | 3,252 | | | $ | 9,881 | | | $ | 1,428 | |
| | | | | | | | | |
Net income per share attributable to Cheniere—basic (1) | | | | | $ | 14.24 | | | $ | 40.99 | | | $ | 5.69 | |
Net income per share attributable to Cheniere—diluted (1) | | | | | $ | 14.20 | | | $ | 40.72 | | | $ | 5.64 | |
| | | | | | | | | |
| Weighted average number of common shares outstanding—basic | | | | | 228.4 | | | 241.0 | | | 251.1 | |
| Weighted average number of common shares outstanding—diluted | | | | | 229.1 | | | 242.6 | | | 253.4 | |
| ___________________ | | | | | | | | | |
(1)Earnings per share may not recalculate due to rounding because it is calculated based on whole numbers, not the rounded numbers presented.
The accompanying notes are an integral part of these consolidated financial statements.
56
CHENIERE ENERGY, INC. AND SUBSIDIARIES
CONSOLIDATED BALANCE SHEETS (1)
(in millions, except share data)
| | | | | | | | | | | |
| December 31, |
| | | |
| 2024 | | 2023 |
| | | |
| ASSETS |
| Current assets | | | |
| Cash and cash equivalents | $ | 2,638 | | | $ | 4,066 | |
| Restricted cash and cash equivalents | 552 | | | 459 | |
| Trade and other receivables, net of current expected credit losses | 727 | | | 1,106 | |
| | | |
| Inventory | 501 | | | 445 | |
| Current derivative assets | 155 | | | 141 | |
| Margin deposits | 128 | | | 18 | |
| | | |
| Other current assets, net | 100 | | | 96 | |
| Total current assets | 4,801 | | | 6,331 | |
| | | |
| | | |
| Property, plant and equipment, net of accumulated depreciation | 33,552 | | | 32,456 | |
| Operating lease assets | 2,684 | | | 2,641 | |
| | | |
| Derivative assets | 1,903 | | | 863 | |
| | | |
| Deferred tax assets | 19 | | | 26 | |
| Other non-current assets, net | 899 | | | 759 | |
| Total assets | $ | 43,858 | | | $ | 43,076 | |
| | | |
LIABILITIES, REDEEMABLE NON-CONTROLLING INTEREST AND STOCKHOLDERS’ EQUITY |
| Current liabilities | | | |
| Accounts payable | $ | 171 | | | $ | 181 | |
| Accrued liabilities | 2,179 | | | 1,780 | |
| | | |
| Current debt, net of unamortized discount and debt issuance costs | 351 | | | 300 | |
| Deferred revenue | 163 | | | 179 | |
| Current operating lease liabilities | 592 | | | 655 | |
| Current derivative liabilities | 902 | | | 750 | |
| Other current liabilities | 83 | | | 43 | |
| Total current liabilities | 4,441 | | | 3,888 | |
| | | |
| Long-term debt, net of unamortized discount and debt issuance costs | 22,554 | | | 23,397 | |
| Operating lease liabilities | 2,090 | | | 1,971 | |
| | | |
| | | |
| Derivative liabilities | 1,865 | | | 2,378 | |
| Deferred tax liabilities | 1,856 | | | 1,545 | |
| Other non-current liabilities | 992 | | | 877 | |
| Total liabilities | 33,798 | | | 34,056 | |
| | | |
Commitments and contingencies (see Note 19) | | | |
| | | |
| Redeemable non-controlling interest | 7 | | | — | |
| | | |
| Stockholders’ equity | | | |
Preferred stock: $0.0001 par value, 5.0 million shares authorized, none issued | — | | | — | |
Common stock: $0.003 par value, 480.0 million shares authorized; 278.7 million shares and 277.9 million shares issued at December 31, 2024 and 2023, respectively | 1 | | | 1 | |
| | | |
| | | |
| | | |
Treasury stock: 54.7 million shares and 40.9 million shares at December 31, 2024 and 2023, respectively, at cost | (6,136) | | | (3,864) | |
| Additional paid-in-capital | 4,452 | | | 4,377 | |
Retained earnings | 7,382 | | | 4,546 | |
Total Cheniere stockholders’ equity | 5,699 | | | 5,060 | |
| Non-controlling interests | 4,354 | | | 3,960 | |
| Total stockholders’ equity | 10,053 | | | 9,020 | |
Total liabilities, redeemable non-controlling interest and stockholders’ equity | $ | 43,858 | | | $ | 43,076 | |
(1)Amounts presented include balances held by our consolidated variable interest entities (“VIEs”), substantially all of which are related to CQP, as further discussed in Note 8—Non-Controlling Interests and Variable Interest Entities. As of December 31, 2024, total assets and liabilities of our VIEs were $17.3 billion and $17.9 billion, respectively, including $270 million of cash and cash equivalents and $125 million of restricted cash and cash equivalents. The accompanying notes are an integral part of these consolidated financial statements.
57
CHENIERE ENERGY, INC. AND SUBSIDIARIES
CONSOLIDATED STATEMENTS OF STOCKHOLDERS’ EQUITY (DEFICIT) AND REDEEMABLE NON-CONTROLLING INTEREST
(in millions)
| | | | | | | | | | | | | | | | | | | | | | | | | | | | | | | | | | | | | | | | | | | | | | | | | | | | | |
| | | | | | | | | | | | | | | |
| Total Stockholders’ Equity (Deficit) |
| | Common Stock | | Treasury Stock | | Additional Paid-in Capital | | Retained Earnings (Accumulated Deficit) | | Non-controlling Interests | | Total Equity (Deficit) | | Redeemable Non-Controlling Interest (1) |
| | Shares | | Par Value Amount | | Shares | | Amount | | | | | |
| Balance at December 31, 2021 | 253.6 | | | $ | 1 | | | 21.6 | | | $ | (928) | | | $ | 4,377 | | | $ | (6,021) | | | $ | 2,538 | | | $ | (33) | | | $ | — | |
| Vesting of share-based compensation awards | 1.5 | | | — | | | — | | | — | | | — | | | — | | | — | | | — | | | — | |
| Share-based compensation | — | | | — | | | — | | | — | | | 112 | | | — | | | — | | | 112 | | | — | |
| Issued shares withheld from employees related to share-based compensation, at cost | (0.3) | | | — | | | 0.3 | | | (41) | | | (22) | | | — | | | — | | | (63) | | | — | |
| Shares repurchased, at cost | (9.3) | | | — | | | 9.3 | | | (1,373) | | | — | | | — | | | — | | | (1,373) | | | — | |
| Adoption of ASU 2020-06, net of tax | — | | | — | | | — | | | — | | | (153) | | | 4 | | | — | | | (149) | | | — | |
| Net income | — | | | — | | | — | | | — | | | — | | | 1,428 | | | 1,207 | | | 2,635 | | | — | |
| | | | | | | | | | | | | | | | | |
| Distributions to non-controlling interests | — | | | — | | | — | | | — | | | — | | | — | | | (947) | | | (947) | | | — | |
Dividends declared ($1.385 per common share) | — | | | — | | | — | | | — | | | — | | | (353) | | | — | | | (353) | | | — | |
| | | | | | | | | | | | | | | | | |
| Balance at December 31, 2022 | 245.5 | | | 1 | | | 31.2 | | | (2,342) | | | 4,314 | | | (4,942) | | | 2,798 | | | (171) | | | — | |
| Vesting of share-based compensation awards | 1.2 | | | — | | | — | | | — | | | — | | | — | | | — | | | — | | | — | |
| Share-based compensation | — | | | — | | | — | | | — | | | 100 | | | — | | | — | | | 100 | | | — | |
| Issued shares withheld from employees related to share-based compensation, at cost | (0.2) | | | — | | | 0.2 | | | (26) | | | (37) | | | — | | | — | | | (63) | | | — | |
| Shares repurchased, at cost | (9.5) | | | — | | | 9.5 | | | (1,496) | | | — | | | — | | | — | | | (1,496) | | | — | |
| | | | | | | | | | | | | | | | | |
| Net income | — | | | — | | | — | | | — | | | — | | | 9,881 | | | 2,178 | | | 12,059 | | | — | |
| Distributions to non-controlling interests | — | | | — | | | — | | | — | | | — | | | — | | | (1,016) | | | (1,016) | | | — | |
Dividends declared ($1.62 per common share) | — | | | — | | | — | | | — | | | — | | | (393) | | | — | | | (393) | | | — | |
| | | | | | | | | | | | | | | | | |
| Balance at December 31, 2023 | 237.0 | | | 1 | | | 40.9 | | | (3,864) | | | 4,377 | | | 4,546 | | | 3,960 | | | 9,020 | | | — | |
| | | | | | | | | | | | | | | | | |
| | | | | | | | | | | | | | | | | |
| | | | | | | | | | | | | | | | | |
| | | | | | | | | | | | | | | | | |
| | | | | | | | | | | | | | | | | |
| | | | | | | | | | | | | | | | | |
| | | | | | | | | | | | | | | | | |
| | | | | | | | | | | | | | | | | |
| | | | | | | | | | | | | | | | | |
| | | | | | | | | | | | | | | | | |
| | | | | | | | | | | | | | | | | |
| | | | | | | | | | | | | | | | | |
| | | | | | | | | | | | | | | | | |
| | | | | | | | | | | | | | | | | |
| | | | | | | | | | | | | | | | | |
| | | | | | | | | | | | | | | | | |
| | | | | | | | | | | | | | | | | |
| | | | | | | | | | | | | | | | | |
| | | | | | | | | | | | | | | | | |
| | | | | | | | | | | | | | | | | |
| | | | | | | | | | | | | | | | | |
| | | | | | | | | | | | | | | | | |
| | | | | | | | | | | | | | | | | |
| | | | | | | | | | | | | | | | | |
| | | | | | | | | | | | | | | | | |
| | | | | | | | | | | | | | | | | |
| Vesting of share-based compensation awards | 0.8 | | | — | | | — | | | — | | | — | | | — | | | — | | | — | | | — | |
| Share-based compensation | — | | | — | | | — | | | — | | | 121 | | | — | | | — | | | 121 | | | — | |
| | | | | | | | | | | | | | | | | |
| Issued shares withheld from employees related to share-based compensation, at cost | — | | | — | | | — | | | — | | | (46) | | | — | | | — | | | (46) | | | — | |
| Shares repurchased, at cost | (13.8) | | | — | | | 13.8 | | | (2,272) | | | — | | | — | | | — | | | (2,272) | | | — | |
| Net income | — | | | — | | | — | | | — | | | — | | | 3,252 | | | 1,240 | | | 4,492 | | | — | |
| Contributions from redeemable non-controlling interest | — | | | — | | | — | | | — | | | — | | | — | | | — | | | — | | | 6 | |
| Distributions to non-controlling interests | — | | | — | | | — | | | — | | | — | | | — | | | (846) | | | (846) | | | — | |
Dividends declared ($1.805 per common share) | — | | | — | | | — | | | — | | | — | | | (415) | | | — | | | (415) | | | — | |
| Accretion of redeemable non-controlling interest, net of tax | — | | | — | | | — | | | — | | | — | | | (1) | | | — | | | (1) | | | 1 | |
| Balance at December 31, 2024 | 224.0 | | | $ | 1 | | | 54.7 | | | $ | (6,136) | | | $ | 4,452 | | | $ | 7,382 | | | $ | 4,354 | | | $ | 10,053 | | | $ | 7 | |
(1)Redeemable non-controlling interest represents the economic interest held by a third party in one of our consolidated VIEs that is redeemable for cash under certain circumstances, including those that are outside of our control. As such, the economic interest is not a component of permanent equity on our Consolidated Balance Sheets.
The accompanying notes are an integral part of these consolidated financial statements.
58
CHENIERE ENERGY, INC. AND SUBSIDIARIES
CONSOLIDATED STATEMENTS OF CASH FLOWS
(in millions)
| | | | | | | | | | | | | | | | | |
| Year Ended December 31, |
| 2024 | | 2023 | | 2022 |
| Cash flows from operating activities | | | | | |
Net income | $ | 4,492 | | | $ | 12,059 | | | $ | 2,635 | |
| Adjustments to reconcile net income to net cash provided by operating activities: | | | | | |
Unrealized foreign currency exchange gain, net | — | | | (2) | | | (5) | |
| Depreciation, amortization and accretion expense | 1,220 | | | 1,196 | | | 1,119 | |
| Share-based compensation expense | 215 | | | 250 | | | 205 | |
| | | | | |
| Amortization of discount and debt issuance costs | 42 | | | 44 | | | 57 | |
| Reduction of right-of-use assets | 670 | | | 623 | | | 607 | |
Loss (gain) on modification or extinguishment of debt | 9 | | | (15) | | | 66 | |
Total losses (gains) on derivative instruments, net | (1,315) | | | (7,890) | | | 6,531 | |
Net cash used for settlement of derivative instruments | (100) | | | (79) | | | (904) | |
| | | | | |
| | | | | |
| Deferred taxes | 330 | | | 2,389 | | | 440 | |
| Other, net | 19 | | | 20 | | | 79 | |
| Changes in operating assets and liabilities: | | | | | |
| Trade and other receivables | 380 | | | 840 | | | (502) | |
| | | | | |
| Inventory | (57) | | | 377 | | | (123) | |
| Margin deposits | (111) | | | 116 | | | 631 | |
| | | | | |
| Other non-current assets | (80) | | | (64) | | | (43) | |
| Accounts payable and accrued liabilities | 248 | | | (982) | | | 250 | |
| | | | | |
| Total deferred revenue | (2) | | | 3 | | | 124 | |
| Total operating lease liabilities | (658) | | | (607) | | | (622) | |
| | | | | |
| Other, net | 92 | | | 140 | | | (22) | |
Net cash provided by operating activities | 5,394 | | | 8,418 | | | 10,523 | |
| | | | | |
| Cash flows from investing activities | | | | | |
| Property, plant and equipment, net | (2,238) | | | (2,121) | | | (1,830) | |
| | | | | |
| Investment in equity method investments | (12) | | | (61) | | | (15) | |
| Other | (29) | | | (20) | | | 1 | |
Net cash used in investing activities | (2,279) | | | (2,202) | | | (1,844) | |
| | | | | |
| Cash flows from financing activities | | | | | |
| Proceeds from issuances of debt | 2,725 | | | 1,397 | | | 1,575 | |
| Redemptions, repayments and repurchases of debt | (3,521) | | | (2,598) | | | (6,771) | |
| | | | | |
| | | | | |
| | | | | |
| Distributions to non-controlling interests | (846) | | | (1,016) | | | (947) | |
| | | | | |
| Payments related to tax withholdings for share-based compensation | (46) | | | (63) | | | (63) | |
| Repurchase of common stock | (2,262) | | | (1,473) | | | (1,373) | |
| Dividends to stockholders | (412) | | | (393) | | | (349) | |
| | | | | |
| Other, net | (89) | | | (34) | | | (86) | |
Net cash used in financing activities | (4,451) | | | (4,180) | | | (8,014) | |
| | | | | |
| Effect of exchange rate changes on cash, cash equivalents and restricted cash and cash equivalents | 1 | | | 2 | | | 5 | |
| | | | | |
Net increase (decrease) in cash, cash equivalents and restricted cash and cash equivalents | (1,335) | | | 2,038 | | | 670 | |
| Cash, cash equivalents and restricted cash and cash equivalents—beginning of period | 4,525 | | | 2,487 | | | 1,817 | |
| Cash, cash equivalents and restricted cash and cash equivalents—end of period | $ | 3,190 | | | $ | 4,525 | | | $ | 2,487 | |
The accompanying notes are an integral part of these consolidated financial statements.
59
CHENIERE ENERGY, INC. AND SUBSIDIARIES
NOTES TO CONSOLIDATED FINANCIAL STATEMENTS
NOTE 1—ORGANIZATION AND NATURE OF OPERATIONS
We operate two natural gas liquefaction and export facilities located in Cameron Parish, Louisiana at Sabine Pass and near Corpus Christi, Texas (respectively, the “Sabine Pass LNG Terminal” and “Corpus Christi LNG Terminal”).
CQP owns the Sabine Pass LNG Terminal, which has natural gas liquefaction facilities consisting of six operational Trains, for a total production capacity of approximately 30 mtpa of LNG (the “SPL Project”). The Sabine Pass LNG Terminal also has operational regasification facilities that include five LNG storage tanks, vaporizers and three marine berths. We also own and operate a 94-mile natural gas supply pipeline that interconnects the Sabine Pass LNG Terminal with several large interstate and intrastate pipelines (the “Creole Trail Pipeline”). As of December 31, 2024, we owned 100% of the general partner interest, a 48.6% limited partner interest and 100% of the incentive distribution rights of CQP.
The Corpus Christi LNG Terminal has three operational Trains for a total production capacity of approximately 15 mtpa of LNG, three LNG storage tanks and two marine berths. Additionally, we are constructing an expansion of the Corpus Christi LNG Terminal (the “Corpus Christi Stage 3 Project”) consisting of seven midscale Trains with an expected total production capacity of over 10 mtpa of LNG. We also own an approximately 21-mile natural gas supply pipeline that interconnects the Corpus Christi LNG Terminal with several large interstate and intrastate natural gas pipelines (the “Corpus Christi Pipeline” and together with the existing assets at the Corpus Christi LNG Terminal and the Corpus Christi Stage 3 Project, the “CCL Project”).
We are pursuing expansion projects to provide additional liquefaction capacity at the SPL Project and the CCL Project (collectively, the “Liquefaction Projects”), and we have commenced commercialization to support the additional liquefaction capacity associated with these potential expansion projects. The development of these projects or other projects, including infrastructure projects in support of natural gas supply and LNG demand, will require, among other things, acceptable commercial and financing arrangements before we make a positive FID.
NOTE 2—SUMMARY OF SIGNIFICANT ACCOUNTING POLICIES
Basis of Presentation
Our Consolidated Financial Statements have been prepared in accordance with GAAP. The Consolidated Financial Statements include the accounts of Cheniere, its subsidiaries in which we hold a controlling interest and VIEs we consolidate under certain criteria discussed further below. All intercompany accounts and transactions have been eliminated in consolidation.
VIEs
We make a determination at the inception of each arrangement whether an entity in which we have made an investment or in which we have other variable interests is considered a VIE. Generally, an entity is a VIE if either (1) the entity does not have sufficient equity at risk to finance its activities without additional subordinated financial support from other parties, (2) the entity’s investors lack any characteristics of a controlling financial interest or (3) the entity was established with non-substantive voting rights.
We consolidate VIEs when we are deemed to be the primary beneficiary. The primary beneficiary of a VIE is generally the party that both: (1) has the power to make decisions that most significantly affect the economic performance of the VIE and (2) has the obligation to absorb losses or the right to receive benefits that in either case could potentially be significant to the VIE. If we are not deemed to be the primary beneficiary of a VIE, we account for the investment or other variable interests in a VIE in accordance with applicable GAAP.
Non-controlling Interests
When we consolidate an entity, we include 100% of the assets, liabilities, revenues and expenses of the entity in our Consolidated Financial Statements. For those entities that we consolidate in which our ownership is less than 100%, we record
CHENIERE ENERGY, INC. AND SUBSIDIARIES
NOTES TO CONSOLIDATED FINANCIAL STATEMENTS—CONTINUED
a non-controlling interest as a component of equity on our Consolidated Balance Sheets, which represents the third party ownership in the net assets of the respective consolidated subsidiary. Changes in our ownership interests in an entity that do not result in deconsolidation are generally recognized within equity.
Non-controlling interests are presented in permanent equity within our Consolidated Balance Sheets unless they are redeemable at a fixed or determinable price on a fixed or determinable date at the option of the holder or upon the occurrence of an event that is not solely within our control, in which case they are presented in temporary equity. The carrying amount of the redeemable non-controlling interest is equal to the greater of (1) the carrying value of the non-controlling interest adjusted each reporting period for income or loss attributable to the non-controlling interest as well as any applicable distributions made or (2) the redemption value. Remeasurements to the redemption value of the redeemable non-controlling interest are recognized in retained earnings within the Consolidated Balance Sheets.
The portion of the net income or loss attributable to the non-controlling interests and redeemable non-controlling interest is reported as net income or loss attributable to non-controlling interests on our Consolidated Statements of Operations. See Note 8—Non-controlling Interests and Variable Interest Entities for additional details about our non-controlling interests.
Estimates
The preparation of our Consolidated Financial Statements in conformity with GAAP requires management to make certain estimates and assumptions that affect the amounts reported in the Consolidated Financial Statements and the accompanying notes. Management evaluates its estimates and related assumptions regularly, including those related to fair value measurements of derivatives and other instruments, useful lives of property, plant and equipment and certain valuations including leases, asset retirement obligations (“AROs”) and recoverability of deferred tax assets, each as further discussed under the respective sections within this note. Changes in facts and circumstances or additional information may result in revised estimates, and actual results may differ from these estimates.
Fair Value Measurements
Fair value is the price that would be received to sell an asset or paid to transfer a liability in an orderly transaction between market participants. Hierarchy Levels 1, 2 and 3 are terms for the priority of inputs to valuation approaches used to measure fair value. Hierarchy Level 1 inputs are quoted prices in active markets for identical assets or liabilities. Hierarchy Level 2 inputs are inputs that are directly or indirectly observable for the asset or liability, other than quoted prices included within Level 1. Hierarchy Level 3 inputs are inputs that are not observable in the market.
In determining fair value, we use observable market data when available, or models that incorporate observable market data. In addition to market information, we incorporate transaction-specific details that, in management’s judgment, market participants would take into account in measuring fair value. We attempt to maximize our use of observable inputs and minimize our use of unobservable inputs in arriving at fair value estimates.
The carrying amount of cash and cash equivalents, restricted cash and cash equivalents, trade and other receivables, net of current expected credit losses, margin deposits, accounts payable and accrued liabilities reported on the Consolidated Balance Sheets approximates fair value. The fair value of debt is the estimated amount we would have to pay to repurchase our debt in the open market, including any premium or discount attributable to the difference between the stated interest rate and market interest rate at each balance sheet date. Refer to Note 10—Debt for our debt fair value estimates, including our estimation methods. Revenue Recognition
Revenues from the sale of LNG are recognized at a point in time when the LNG is delivered to the customer based on the delivery terms, which is the point legal title, physical possession and the risks and rewards of ownership transfer to the customer, and consists of either an FOB or DAT basis. Each individual molecule of LNG is viewed as a separate performance obligation. We allocate the contract price (including both fixed and variable fees) in each LNG sales arrangement based on the
CHENIERE ENERGY, INC. AND SUBSIDIARIES
NOTES TO CONSOLIDATED FINANCIAL STATEMENTS—CONTINUED
stand-alone selling price of each performance obligation as of the time the contract was negotiated. We have concluded that the variable fees meet the exception for allocating variable consideration to specific parts of the contract. As such, the variable consideration for these contracts is allocated to each distinct molecule of LNG and recognized when that distinct molecule of LNG is delivered to the customer. Because of the use of the exception, variable consideration related to the sale of LNG is not included in the transaction price.
Sales generated during the commissioning phase of a Train, which includes test activities such as production and removal of LNG from storage, are offset against the cost of construction for the respective Train, as commissioning is necessary to test the facility and bring the asset to the condition necessary for its intended use. After substantial completion of a Train is achieved, fees received for LNG volumes produced are recognized as LNG revenues.
For transactions where we receive consideration from the customer, we assess whether we are the principal or the agent in the arrangement. Arrangements where we have concluded that we act as a principal are presented within our Consolidated Statements of Operations on a gross basis, and arrangements where we have concluded that we act as an agent are presented within our Consolidated Statements of Operations on a net basis.
Cash and Cash Equivalents
We consider all highly liquid investments with an original maturity of three months or less to be cash equivalents.
Restricted Cash and Cash Equivalents
Restricted cash and cash equivalents consist of funds that are contractually or legally restricted as to usage or withdrawal and have been presented separately from cash and cash equivalents on our Consolidated Balance Sheets. Our restricted cash and cash equivalents were primarily restricted for the payment of liabilities related to the Liquefaction Projects, as required under certain debt arrangements.
Current Expected Credit Losses
Current expected credit losses consider the risk of loss based on past events, current conditions and reasonable and supportable forecasts. A counterparty’s ability to pay is assessed through a credit review process that considers contract and payment terms, the counterparty’s established credit rating and credit worthiness and other risks or available financial assurances. We calculate the allowance for credit losses under a probability-of-default method applied to pools of assets with similar risk characteristics, and reflect credit enhancements such as letters of credit and guarantees to the extent that such enhancements are contractually linked to the underlying asset and with the same counterparty. Quarterly, we evaluate whether our method continues to be appropriate based on historical collections and additional information as it becomes available and adjust our reserve as necessary. We record charges and reversals of current expected credit losses in our Consolidated Statements of Operations within the line item that corresponds to the nature of the underlying asset, primarily selling, general and administrative expense.
The following table reflects the changes in our current expected credit losses (in millions):
| | | | | | | | | | | | | | | | | | | | |
| | Year Ended December 31, |
| | 2024 | | 2023 | | 2022 |
Current expected credit losses, beginning of period | | $ | 3 | | | $ | 5 | | | $ | 9 | |
| Charges (reversals), net | | 1 | | | (2) | | | (4) | |
Current expected credit losses, end of period | | $ | 4 | | | $ | 3 | | | $ | 5 | |
Inventory
LNG, natural gas and other commodity inventory are recorded at the lower of weighted average cost and net realizable value. Materials and other inventory are recorded at the lower of cost and net realizable value. Inventory is charged to expense
CHENIERE ENERGY, INC. AND SUBSIDIARIES
NOTES TO CONSOLIDATED FINANCIAL STATEMENTS—CONTINUED
when sold, or, for certain qualifying costs, capitalized to property, plant and equipment when issued, primarily using the weighted average method.
Property, Plant and Equipment
Property, plant and equipment are recorded at cost. Expenditures for construction, acquisition, commissioning activities and costs that significantly extend the useful life or increase the functionality and/or capacity of an asset are capitalized. Expenditures for maintenance and repairs (including those for planned major maintenance projects) to maintain property, plant and equipment in operating condition are generally expensed as incurred.
Generally, we begin capitalizing the costs of LNG terminal construction once the individual project meets the following criteria: (1) regulatory approval has been received, (2) financing for the project is available and (3) management has committed to commence construction.
Generally, costs that benefit us more broadly than for a specific project are capitalized prior to a project meeting the criteria otherwise necessary for capitalization and typically include land and land acquisition costs and engineering design work.
We realize offsets to LNG terminal costs for sales of commissioning cargoes that were earned or loaded prior to the start of commercial operations of the respective Train during the testing phase for its construction.
We depreciate our property, plant and equipment using the straight-line depreciation method over assigned useful lives, except land which is not depreciated. Refer to Note 5—Property, Plant and Equipment, Net of Accumulated Depreciation for additional discussion of our useful lives by asset category. Upon retirement or other disposition of property, plant and equipment, the cost and related accumulated depreciation are removed from the account, and the resulting gains or losses on disposal are recorded in other operating costs and expenses.
Management tests property, plant and equipment for impairment whenever events or changes in circumstances have indicated that the carrying amount of property, plant and equipment might not be recoverable. Assets are grouped at the lowest level for which there are identifiable cash flows that are largely independent of the cash flows of other groups of assets for purposes of assessing recoverability. Recoverability generally is determined by comparing the carrying value of the asset to the expected undiscounted future cash flows of the asset. If the carrying value of the asset is not recoverable, the amount of impairment loss is measured as the excess, if any, of the carrying value of the asset over its estimated fair value.
We did not record any material impairments related to property, plant and equipment during the years ended December 31, 2024, 2023 and 2022.
Interest Capitalization
We capitalize interest costs mainly during the construction period of our LNG terminals and related assets. Upon placing the underlying asset in service, these costs are depreciated over the estimated useful life of the corresponding assets for which interest costs were incurred, except for capitalized interest associated with land, which is not depreciated.
Derivative Instruments
We use derivative instruments to hedge our exposure to cash flow variability from commodity price and foreign currency exchange (“FX”) rate risk. Derivative instruments are recorded at fair value and included in our Consolidated Balance Sheets as current or non-current assets or liabilities depending on the derivative position and the expected timing of settlement.
CHENIERE ENERGY, INC. AND SUBSIDIARIES
NOTES TO CONSOLIDATED FINANCIAL STATEMENTS—CONTINUED
We did not have any derivative instruments designated as cash flow, fair value or net investment hedges during the years ended December 31, 2024, 2023 and 2022; therefore, the changes in the fair value of our derivative instruments are recorded in earnings.
As described in Concentration of Credit Risk below, the use of derivative instruments exposes us to counterparty credit risk, or the risk that a counterparty will be unable to meet its commitments, in instances when our derivative instruments are in an asset position. Additionally, counterparties are at risk that we will be unable to meet our commitments in instances where our derivative instruments are in a liability position. We incorporate both our own nonperformance risk and the respective counterparty’s nonperformance risk in fair value measurements depending on the position of the derivative. In adjusting the fair value of our derivative contracts for the effect of nonperformance risk, we have considered the impact of any applicable credit enhancements, such as collateral postings, set-off rights and guarantees. Variation margins or other daily margining posted for exchange-traded transactions that are contractually characterized as settlement of the respective derivative position are netted against the respective derivative asset or liability positions.
We have elected to report derivative assets and liabilities under master netting arrangements with the same counterparty on a net basis. Additionally, the fair value amounts recognized as cash collateral pledged or received, such as initial margins and other collateral that are not contractually characterized as settlement of the respective derivative positions, are offset against the fair value of derivatives executed with the same counterparty under a master netting arrangement. Collateral balances not offset against a derivative position are presented on our Consolidated Balance Sheets within margin deposits. Derivative assets and liabilities not subject to master netting arrangements are presented net when we have a legally enforceable right and the intent to offset amounts with the same counterparty.
Leases
We determine if an arrangement is, or contains, a lease at inception of the arrangement. When we determine the arrangement is, or contains, a lease in which we are the lessee, we classify the lease as either an operating lease or a finance lease. Operating and finance leases are recognized on our Consolidated Balance Sheets by recording a lease liability representing the obligation to make future lease payments and a right-of-use asset representing the future right to use the underlying asset over the lease term.
Operating and finance lease right-of-use assets and liabilities are generally recognized based on the present value of minimum lease payments over the lease term. In determining the present value of minimum lease payments, we use the implicit interest rate in the lease if readily determinable. In the absence of a readily determinable implicit interest rate, we discount our expected future lease payments using the incremental borrowing rate of the relevant Cheniere entity, which can be a parent entity when the terms of the lease arrangements are significantly influenced by the parent’s credit standing. The incremental borrowing rate is an estimate of the interest rate that a given entity would have to pay to borrow on a collateralized basis over a similar term to that of the lease term. Options to renew a lease are included in the lease term and recognized as part of the right-of-use asset and lease liability when they are reasonably certain to be exercised.
We have elected practical expedients to (1) omit leases with an initial term of 12 months or less from recognition on our Consolidated Balance Sheets and (2) to combine both the lease and non-lease components of an arrangement in calculating the right-of-use asset and lease liability for all classes of leased assets.
Lease expense for operating lease payments is recognized on a straight-line basis over the lease term. Lease expense for finance leases is recognized as the sum of the amortization of the right-of-use assets on a straight-line basis and the interest on lease liabilities using the effective interest method over the lease term.
Certain of our leases also contain variable payments that are included in the right-of-use asset and lease liability only when the payments are in-substance fixed payments that are, in effect, unavoidable.
When we determine the arrangement is, or contains, a lease in which we are the lessor or sublessor, we assess classification of the lease as either an operating lease, sales-type lease or direct financing lease. All such arrangements have
CHENIERE ENERGY, INC. AND SUBSIDIARIES
NOTES TO CONSOLIDATED FINANCIAL STATEMENTS—CONTINUED
been assessed as operating leases and consist of sublessor arrangements in which we have not been relieved of our primary obligation under the original lease. Our sublessor arrangements are not recognized on our Consolidated Balance Sheets and we recognize income from fixed lease payments under these arrangements on a straight-line basis over the sublease term. We recognize income from variable lease payments in the period in which the changes in facts and circumstances on which the variable lease payments are based occur.
Concentration of Credit Risk
Financial instruments that potentially subject us to a concentration of credit risk consist principally of (1) derivative instruments and (2) accounts receivable and contract assets related to our long-term SPAs, each discussed further above. Additionally, we maintain cash balances at financial institutions, which may at times be in excess of federally insured levels. We have not incurred credit losses related to these cash balances to date.
The use of derivative instruments exposes us to counterparty credit risk, or the risk that a counterparty will be unable to meet its commitments. Our commodity derivatives executed over-the-counter or through an exchange are subject to nominal credit risk as these transactions often require collateral that is returned to us (or to the counterparty) on or near the settlement date or are settled on a daily margin basis with investment grade financial institutions and are primarily facilitated by independent system operators and by clearing brokers. Payments on margin deposits, either by us or by the counterparty depending on the position, are required for non-exchange traded transactions when the value of a derivative exceeds the pre-established credit limit with the counterparty. Our FX derivative instruments are placed with investment grade financial institutions whom we believe are acceptable credit risks. We monitor counterparty creditworthiness on an ongoing basis; however, we cannot predict sudden changes in counterparties’ creditworthiness. In addition, even if such changes are not sudden, we may be limited in our ability to mitigate an increase in counterparty credit risk. Should one of these counterparties not perform, we may not realize the benefit of some of our derivative instruments.
Our contracted LNG sales are primarily under SPAs with terms exceeding 10 years. As of December 31, 2024, we had SPAs with initial terms of 10 or more years with a total of 29 different third party customers. We are dependent on the respective customers’ creditworthiness and their ability to perform under their respective agreements. While substantially all of our long-term third party customer arrangements are executed with a creditworthy parent company or secured by a parent company guarantee or other form of collateral, we are nonetheless exposed to credit risk in the event of a customer default that requires us to seek recourse.
Debt
Our debt consists of current and long-term secured and unsecured debt securities and credit facilities with banks and other lenders. Debt issuances are placed directly by us or through securities dealers or underwriters and are held by institutional and retail investors.
Debt is recorded on our Consolidated Balance Sheets at par value adjusted for unamortized discount or premium and net of unamortized debt issuance costs related to term notes. Debt issuance costs consist primarily of arrangement fees, professional fees, legal fees, printing costs and commitment fees. Costs associated with entering into a line of credit or on undrawn funds are presented as an asset and classified as current or non-current, consistent with the respective credit facility. As of December 31, 2024 and 2023, all of such costs were classified as other non-current assets, net, on our Consolidated Balance Sheets. Discounts, premiums and debt issuance costs directly related to the issuance of debt are amortized over the life of the debt and are recorded in interest expense, net of capitalized interest using the effective interest method except in the case of our credit facilities, in which discounts, premiums and debt issuance costs are amortized on a straight-line basis over the contractual term.
We classify debt on our Consolidated Balance Sheets based on contractual maturity, with the following exceptions:
•We classify term debt that is contractually due within one year as long-term debt if management has the intent and ability to refinance the current portion of such debt with future cash proceeds from an executed long-term debt or equity agreement.
•We evaluate the classification of long-term debt extinguished after the balance sheet date but before the financial statements are issued based on facts and circumstances existing as of the balance sheet date.
CHENIERE ENERGY, INC. AND SUBSIDIARIES
NOTES TO CONSOLIDATED FINANCIAL STATEMENTS—CONTINUED
Asset Retirement Obligations
We recognize AROs for legal obligations associated with the retirement of long-lived assets that result from the acquisition, construction, development and/or normal use of the asset and for conditional AROs in which the timing or method of settlement are conditional on a future event that may or may not be within our control. The fair value of a liability for an ARO is recognized in the period in which it is incurred, if a reasonable estimate of fair value can be made. The fair value of the liability is added to the carrying amount of the associated asset. This additional carrying amount is depreciated over the estimated useful life of the asset.
Our real property lease agreements at the Sabine Pass LNG Terminal require us to surrender the LNG terminal in good working order and repair, with normal wear and tear and casualty excepted, at the expiration of the term of the leases, with such terms being up to 90 years including renewal options. We have determined that the cost to surrender the Sabine Pass LNG Terminal in good order and repair, with normal wear and tear and casualty excepted, is immaterial, thus we have not recorded an ARO associated with the Sabine Pass LNG Terminal.
Our Creole Trail Pipeline and Corpus Christi Pipeline are subject to regulations by the FERC for proper abandonment of a pipeline, including the disconnection of the pipeline from all sources and supplies of gas and other decommissioning costs. We believe that it is not feasible to predict when the natural gas transportation services provided by the Creole Trail Pipeline or the Corpus Christi Pipeline will no longer be utilized. In addition, our right-of-way agreements associated with the Creole Trail Pipeline and the Corpus Christi Pipeline have no stipulated termination dates. We intend to operate the Creole Trail Pipeline and the Corpus Christi Pipeline as long as supply and demand for natural gas exists in the United States and intend to maintain them regularly. For these reasons, we have not recorded an ARO associated with the Creole Trail Pipeline or the Corpus Christi Pipeline.
Share-based Compensation
We have awarded share-based compensation in the form of restricted stock shares, restricted stock units, performance stock units and phantom units, as further described in Note 15—Share-based Compensation. We initially measure share-based compensation based upon the estimated fair value of awards. The recognition period for these costs begins at the earlier of the applicable service inception date or grant date and continues throughout the requisite service period.
For equity-classified share-based compensation awards, compensation cost is recognized based on the grant-date fair value and not subsequently remeasured unless modified. For liability-classified share-based compensation awards that cash settle or include an election to be cash settled, compensation costs are remeasured at fair value through settlement or maturity. Except for awards that contain market conditions, the grant-date fair value is estimated based on our stock price on the grant date. The grant-date fair value of awards containing market conditions is estimated using a Monte Carlo model as of the grant date, which utilizes inputs such as expected stock volatility, risk-free rates and dividend yield and remains constant through the vesting period for the equity-settled component.
For awards that contain graded vesting periods, the fair value is recognized as expense (net of any capitalization in accordance with GAAP) using the straight-line basis, generally over the term of the entire award, except when modifications may require an accelerated method. For awards that contain cliff vesting periods, the fair value is recognized as expense (net of any capitalization in accordance with GAAP) using the straight-line basis over the requisite service period.
For awards with both time and performance-based conditions, we recognize compensation cost based on the probable outcome of the performance condition at each reporting period.
We account for forfeitures as they occur.
Foreign Currency
The functional currency of all of our subsidiaries is the U.S. dollar. Certain of our subsidiaries transact in currencies outside of the U.S. dollar, which gives rise to the recognition of transaction gains and losses based on the change in exchange rates between the U.S. dollar and the currency in which the foreign currency transaction is denominated. During the years
CHENIERE ENERGY, INC. AND SUBSIDIARIES
NOTES TO CONSOLIDATED FINANCIAL STATEMENTS—CONTINUED
ended December 31, 2024, 2023 and 2022, we recognized net transaction gains (losses) totaling $45 million, $(20) million and $60 million, respectively, substantially all of which related to commercial transactions executed by Cheniere Marketing, primarily consisting of Euro denominated receivables and related foreign currency hedges arising from the sale of cargoes, which are presented within LNG revenues in our Consolidated Statements of Operations with the underlying activities. The remaining transaction gains and losses are presented primarily within other income (expense), net in our Consolidated Statements of Operations.
Income Taxes
Provisions for income taxes are based on taxes payable or refundable for the current year and deferred taxes on temporary differences between the tax basis of assets and liabilities and their reported amounts in our Consolidated Financial Statements. Deferred tax assets and liabilities are included in our Consolidated Financial Statements at currently enacted income tax rates applicable to the period in which the deferred tax assets and liabilities are expected to be realized or settled. As changes in tax laws or rates are enacted, deferred tax assets and liabilities are adjusted through the current period’s provision for income taxes.
A valuation allowance is recorded to reduce the carrying value of our deferred tax assets when it is more likely than not that some or all of our deferred tax assets will not be realized. We evaluate the realizability of our deferred tax assets as of each reporting date, weighing all positive and negative evidence. The assessment requires significant judgment and is performed in each of our applicable jurisdictions. In making such determination, we consider various factors such as historical profitability, future projections of sustained profitability underpinned by fixed-price long-term SPAs and reversal of existing deferred tax liabilities.
We recognize the financial statement effects of a tax position when it is more likely than not, based on the technical merits, that the position will be sustained upon examination.
We account for our federal investment tax credits under the flow-through method.
The Inflation Reduction Act of 2022 (“IRA”) imposed a 15% CAMT effective in 2023, that is based on 15% of an applicable corporation’s adjusted financial statement income. We have elected to account for the effects of the CAMT on deferred tax assets, carryforwards and tax credits in the period they arise.
Net Income or Loss Per Share
Basic net income or loss per share attributable to common stockholders excludes dilution and is computed by dividing net income or loss attributable to common stockholders during the period by the weighted average number of common shares outstanding during the period. Diluted net income or loss per share reflects potential dilution from our unvested stock and is computed by dividing net income or loss attributable to common stockholders by the weighted average number of common shares outstanding during the period, which is increased by the number of additional common shares that would have been outstanding if the potential common shares had been issued. However, if the effect of any additional securities are anti-dilutive (i.e., resulting in a higher net income per share or lower net loss per share), they are excluded from the dilutive net income or loss computation. The dilutive effect of unvested stock is calculated using the treasury-stock method.
Recent Accounting Standards
ASU 2023-07
In November 2023, the FASB issued ASU No. 2023-07, Segment Reporting (Topic 280), which we adopted on December 31, 2024. This guidance requires a public entity, including entities with a single reportable segment, to disclose significant segment expenses and other segment information on an annual and interim basis and provide in interim periods all disclosures about a reportable segment’s profit or loss and assets that are currently required annually. Refer to Note 20—Segment Information and Customer Concentration for the required disclosures.
CHENIERE ENERGY, INC. AND SUBSIDIARIES
NOTES TO CONSOLIDATED FINANCIAL STATEMENTS—CONTINUED
ASU 2023-09
In December 2023, the FASB issued ASU No. 2023-09, Income Taxes (Topic 740). This guidance further enhances income tax disclosures, primarily through standardization and disaggregation of rate reconciliation categories and income taxes paid by jurisdiction. We plan to adopt this guidance and conform with the disclosure requirements when it becomes mandatorily effective for our annual report for the year ending December 31, 2025.
ASU 2024-03
In November 2024, the FASB issued ASU No. 2024-03, Income Statement – Reporting Comprehensive Income – Expense Disaggregation Disclosures (Subtopic 220-40): Disaggregation of Income Statement Expenses, as clarified by ASU No. 2025-01 in January 2025. This guidance requires disaggregated disclosures about certain income statement expense line items on an annual and interim basis. We continue to evaluate the impact of the provisions of this guidance on our disclosures, but plan to adopt this guidance prospectively and conform with the disclosure requirements when it becomes mandatorily effective for our annual report for the year ending December 31, 2027.
NOTE 3—TRADE AND OTHER RECEIVABLES, NET OF CURRENT EXPECTED CREDIT LOSSES
Trade and other receivables, net of current expected credit losses, consisted of the following (in millions):
| | | | | | | | | | | | | | |
| | December 31, |
| | | | |
| | 2024 | | 2023 |
| Trade receivables | | | | |
SPL and CCL | | $ | 548 | | | $ | 525 | |
| | | | |
Cheniere Marketing | | 109 | | | 451 | |
| Other subsidiaries | | 4 | | | 4 | |
| Other receivables | | 66 | | | 126 | |
| Total trade and other receivables, net of current expected credit losses | | $ | 727 | | | $ | 1,106 | |
NOTE 4—INVENTORY
Inventory consisted of the following (in millions):
| | | | | | | | | | | | | | |
| | December 31, |
| | | | |
| | 2024 | | 2023 |
| Materials | | $ | 226 | | | $ | 207 | |
| LNG | | 93 | | | 88 | |
| LNG in-transit | | 137 | | | 112 | |
| Natural gas | | 30 | | | 35 | |
| Other | | 15 | | | 3 | |
| Total inventory | | $ | 501 | | | $ | 445 | |
CHENIERE ENERGY, INC. AND SUBSIDIARIES
NOTES TO CONSOLIDATED FINANCIAL STATEMENTS—CONTINUED
NOTE 5—PROPERTY, PLANT AND EQUIPMENT, NET OF ACCUMULATED DEPRECIATION
Property, plant and equipment, net of accumulated depreciation consisted of the following (in millions):
| | | | | | | | | | | | | | |
| | | | |
| | December 31, |
| | 2024 | | 2023 |
| Terminal and related assets | | | | |
| Terminal and interconnecting pipeline facilities | | $ | 34,282 | | | $ | 34,069 | |
| Land | | 465 | | | 463 | |
| Construction-in-process | | 5,486 | | | 3,480 | |
| Accumulated depreciation | | (7,231) | | | (6,099) | |
| Total terminal and related assets, net of accumulated depreciation | | 33,002 | | | 31,913 | |
| Fixed assets and other | | | | |
| Computer and office equipment | | 36 | | | 37 | |
| Furniture and fixtures | | 31 | | | 31 | |
| Computer software | | 122 | | | 125 | |
| Leasehold improvements | | 47 | | | 43 | |
| | | | |
| Other | | 24 | | | 21 | |
| Accumulated depreciation | | (188) | | | (183) | |
| Total fixed assets and other, net of accumulated depreciation | | 72 | | | 74 | |
| Assets under finance leases | | | | |
| Marine assets | | 587 | | | 532 | |
| Accumulated depreciation | | (109) | | | (63) | |
| Total assets under finance leases, net of accumulated depreciation | | 478 | | | 469 | |
| Property, plant and equipment, net of accumulated depreciation | | $ | 33,552 | | | $ | 32,456 | |
The following table shows depreciation expense and offsets to LNG terminal costs (in millions):
| | | | | | | | | | | | | | | | | | | | | | |
| | | | Year Ended December 31, |
| | | | | | 2024 | | 2023 | | 2022 |
| Depreciation expense | | | | | | $ | 1,213 | | | $ | 1,190 | | | $ | 1,113 | |
| Offsets to LNG terminal costs (1) | | | | | | — | | | — | | | 204 | |
(1)We recognize offsets to LNG terminal costs related to the sale of commissioning cargoes because these amounts were earned or loaded prior to the start of commercial operations of the respective Trains of the Liquefaction Projects during the testing phase for its construction.
Terminal and related assets
Our terminal and related assets are depreciated using the straight-line depreciation method applied to groups of LNG terminal assets with varying useful lives. The identifiable components of our terminal and related assets have depreciable lives between 6 and 50 years, as follows:
| | | | | | | | |
| Components | | Useful life (years) |
| LNG storage tanks | | 50 |
| Natural gas pipeline facilities | | 40 |
| Marine berth, electrical, facility and roads | | 35 |
| Water pipelines | | 30 |
| Regasification processing equipment | | 30 |
| Sendout pumps | | 20 |
| Liquefaction processing equipment | | 6-50 |
| Other | | 10-30 |
CHENIERE ENERGY, INC. AND SUBSIDIARIES
NOTES TO CONSOLIDATED FINANCIAL STATEMENTS—CONTINUED
Fixed Assets and Other
Our fixed assets and other are recorded at cost and are depreciated on a straight-line method based on estimated lives of the individual assets or groups of assets.
Assets under Finance Leases
Our assets under finance leases primarily consist of certain tug vessels and LNG vessel time charters that meet the criteria to be classified as finance leases. These assets are depreciated on a straight-line method over the respective lease term. See Note 11—Leases for additional details of our finance leases.
NOTE 6—DERIVATIVE INSTRUMENTS
We have the following derivative instruments:
•commodity derivatives consisting of the following (collectively, “Commodity Derivatives”):
◦natural gas and power supply contracts, including those under our IPM agreements, for the development, commissioning and operation of the Liquefaction Projects and expansion projects, as well as the associated economic hedges (collectively, the “Liquefaction Supply Derivatives”); and,
◦LNG derivatives in which we have contractual net settlement and economic hedges on the exposure to the commodity markets in which we have contractual arrangements to purchase or sell physical LNG (collectively, “LNG Trading Derivatives”); and
•FX contracts to hedge exposure to currency risk associated with cash flows denominated in currencies other than U.S. dollar (“FX Derivatives”), associated with both LNG Trading Derivatives and operations in countries outside of the United States.
The following table shows the fair value of our derivative instruments that are required to be measured at fair value on a recurring basis, distinguished by the fair value hierarchy levels prescribed by GAAP (in millions):
| | | | | | | | | | | | | | | | | | | | | | | | | | | | | | | | | | | | | | | | | | | | | | | |
| Fair Value Measurements as of |
| December 31, 2024 | | December 31, 2023 |
| Quoted Prices in Active Markets
(Level 1) | | Significant Other Observable Inputs
(Level 2) | | Significant Unobservable Inputs
(Level 3) | | Total | | Quoted Prices in Active Markets
(Level 1) | | Significant Other Observable Inputs
(Level 2) | | Significant Unobservable Inputs
(Level 3) | | Total |
| | | | | | | | | | | | | | | |
| | | | | | | | | | | | | | | |
Liquefaction Supply Derivatives asset (liability) | $ | — | | | $ | 59 | | | $ | (801) | | | $ | (742) | | | $ | 25 | | | $ | 36 | | | $ | (2,178) | | | $ | (2,117) | |
LNG Trading Derivatives asset (liability) | — | | | 17 | | | — | | | 17 | | | 30 | | | (20) | | | — | | | 10 | |
FX Derivatives asset (liability) | — | | | 16 | | | — | | | 16 | | | — | | | (17) | | | — | | | (17) | |
| | | | | | | | | | | | | | | |
We value the Liquefaction Supply Derivatives and LNG Trading Derivatives using a market or option-based approach incorporating present value techniques, as needed, which incorporates observable commodity price curves, when available, and other relevant data. We value our FX Derivatives with a market approach using observable FX rates and other relevant data.
We include a significant portion of the Liquefaction Supply Derivatives as Level 3 within the valuation hierarchy as the fair value is developed through the use of internal models which incorporate significant unobservable inputs. In instances where observable data is unavailable, consideration is given to the assumptions that market participants may use in valuing the asset or liability. To the extent valued using an option pricing model, we consider the future prices of energy units for unobservable periods to be a significant unobservable input to estimated net fair value. In estimating the future prices of energy units, we make judgments about market risk related to liquidity of commodity indices and volatility utilizing available market data. Changes in facts and circumstances or additional information may result in revised estimates and judgments, and actual results may differ from these estimates and judgments. We derive our volatility assumptions based on observed historical settled global LNG market pricing or accepted proxies for global LNG market pricing as well as settled domestic natural gas
CHENIERE ENERGY, INC. AND SUBSIDIARIES
NOTES TO CONSOLIDATED FINANCIAL STATEMENTS—CONTINUED
pricing. Such volatility assumptions also contemplate, as of the balance sheet date, observable forward curve data of such indices, as well as evolving available industry data and independent studies.
In developing our volatility assumptions, we acknowledge that the global LNG industry is inherently influenced by events such as unplanned supply constraints, geopolitical incidents, unusual climate events including drought and uncommonly mild, by historical standards, winters and summers, and real or threatened disruptive operational impacts to global energy infrastructure. Our current estimate of volatility includes the impact of otherwise rare events unless we believe market participants would exclude such events on account of their assertion that those events were specific to our company and deemed within our control. As applicable to our natural gas supply contracts, our fair value estimates incorporate market participant-based assumptions pertaining to certain contractual uncertainties, including those related to the availability of market information for delivery points, as well as the timing of satisfaction of certain events or development of infrastructure to support natural gas gathering and transport. We may recognize changes in fair value through earnings that could significantly impact our results of operations if and when such uncertainties are resolved.
The Level 3 fair value measurements of our natural gas positions within the Liquefaction Supply Derivatives could be materially impacted by a significant change in certain natural gas and international LNG prices. The following table includes quantitative information for the unobservable inputs for the Level 3 Liquefaction Supply Derivatives as of December 31, 2024:
| | | | | | | | | | | | | | | | | | | | | | | | | | |
| | Net Fair Value Liability (in millions) | | Valuation Approach | | Significant Unobservable Input | | Range of Significant Unobservable Inputs / Weighted Average (1) |
| Liquefaction Supply Derivatives | | $(801) | | Market approach incorporating present value techniques | | Henry Hub basis spread | | $(2.005) - $1.144 / $(0.069) |
| | | | Option pricing model | | International LNG pricing spread, relative to Henry Hub (2) | | 90% - 410% / 197% |
(1)Unobservable inputs were weighted by the relative fair value of the instruments.
(2)Spread contemplates U.S. dollar-denominated pricing.
Increases or decreases in basis or pricing spreads, in isolation, would decrease or increase, respectively, the fair value of the Liquefaction Supply Derivatives.
The following table shows the changes in the fair value of the Level 3 Liquefaction Supply Derivatives (in millions):
| | | | | | | | | | | | | | | | | | | | | | | | |
| | | | Year Ended December 31, |
| | | | | | 2024 | | 2023 | | 2022 |
| Balance, beginning of period | | | | | | $ | (2,178) | | | $ | (9,924) | | | $ | (4,036) | |
Realized and change in fair value gains (losses) included in net income (1): | | | | | | | | | | |
| Included in cost of sales, existing deals (2) | | | | | | 716 | | | 5,685 | | | (5,120) | |
| Included in cost of sales, new deals (3) | | | | | | 22 | | | 15 | | | (1,373) | |
| Purchases and settlements: | | | | | | | | | | |
| Purchases (4) | | | | | | — | | | — | | | — | |
| Settlements (5) | | | | | | 639 | | | 2,045 | | | 605 | |
| | | | | | | | | | |
| | | | | | | | | | |
| Transfers out of level 3 (6) | | | | | | — | | | 1 | | | — | |
| Balance, end of period | | | | | | $ | (801) | | | $ | (2,178) | | | $ | (9,924) | |
Favorable (unfavorable) changes in fair value relating to instruments still held at the end of the period | | | | | | $ | 738 | | | $ | 5,700 | | | $ | (6,493) | |
(1)Does not include the realized value associated with derivative instruments that settle through physical delivery, as settlement is equal to the contractually fixed price from trade date multiplied by contractual volume. See settlements line item in this table.
(2)Impact to earnings on deals that existed at the beginning of the period and continue to exist at the end of the period.
(3)Impact to earnings on deals that were entered into during the reporting period and continue to exist at the end of the period.
CHENIERE ENERGY, INC. AND SUBSIDIARIES
NOTES TO CONSOLIDATED FINANCIAL STATEMENTS—CONTINUED
(4)Includes any day one gain (loss) recognized during the reporting period on deals that were entered into during the reporting period which continue to exist at the end of the period.
(5)Roll-off in the current period of amounts recognized in our Consolidated Balance Sheets at the end of the previous period due to settlement of the underlying instruments in the current period.
(6)Transferred out of Level 3 as a result of observable market for the underlying natural gas purchase agreements.
Commodity Derivatives
We hold Liquefaction Supply Derivatives which are primarily indexed to the natural gas market and international LNG indices. As of December 31, 2024, the remaining fixed terms of the Liquefaction Supply Derivatives ranged up to approximately 15 years, some of which commence or accelerate upon the satisfaction of certain events or development of infrastructure to support natural gas gathering and transport.
Cheniere Marketing has historically entered into, and may from time to time enter into, LNG transactions that provide for contractual net settlement. Such transactions are accounted for as LNG Trading Derivatives along with financial commodity contracts in the form of swaps or futures. The terms of LNG Trading Derivatives range up to approximately one year.
The following table shows the notional amounts of our Commodity Derivatives:
| | | | | | | | | | | | | | | | | | | | | | | |
| December 31, 2024 | | December 31, 2023 |
| Liquefaction Supply Derivatives (1) | | LNG Trading Derivatives | | Liquefaction Supply Derivatives (1) | | LNG Trading Derivatives |
| Notional amount, net (in TBtu) | 12,503 | | | (8) | | | 14,019 | | | 49 | |
| | | | | | | |
(1)Inclusive of amounts under contracts with unsatisfied contractual conditions and exclusive of extension options that were uncertain to be taken as of both December 31, 2024 and 2023.
The following table shows the effect and location of our Commodity Derivatives recorded on our Consolidated Statements of Operations (in millions):
| | | | | | | | | | | | | | | | | | | | | | | | | | | |
| | | | | | | Gain (Loss) Recognized in Consolidated Statements of Operations |
| Consolidated Statements of Operations Location (1) | | | | Year Ended December 31, |
| | | | | | 2024 | | 2023 | | 2022 |
| | | | | | | | | | | |
| LNG Trading Derivatives | LNG revenues | | | | | | $ | (111) | | | $ | 139 | | | $ | (387) | |
| LNG Trading Derivatives | Cost of sales | | | | | | (2) | | | (132) | | | (2) | |
| Liquefaction Supply Derivatives (2) | LNG revenues | | | | | | (3) | | | (5) | | | 2 | |
| Liquefaction Supply Derivatives (2) | Cost of sales | | | | | | 1,390 | | | 7,912 | | | (6,203) | |
| | | | | | | | | | | |
| | | | | | | | | | | |
(1)Fair value fluctuations associated with activities of our Commodity Derivatives are classified and presented consistently with the item economically hedged and the nature and intent of the derivative instrument.
(2)Does not include the realized value associated with the Liquefaction Supply Derivatives that settle through physical delivery.
FX Derivatives
Cheniere Marketing holds FX Derivatives to protect against the volatility in future cash flows attributable to changes in international currency exchange rates. The FX Derivatives are executed primarily to economically hedge the foreign currency exposure arising from cash flows expended for both physical and financial LNG transactions that are denominated in a currency other than the U.S. dollar. The terms of FX Derivatives range up to approximately one year.
The total notional amount of our FX Derivatives was $642 million and $789 million as of December 31, 2024 and 2023, respectively.
CHENIERE ENERGY, INC. AND SUBSIDIARIES
NOTES TO CONSOLIDATED FINANCIAL STATEMENTS—CONTINUED
The following table shows the effect and location of our FX Derivatives recorded on our Consolidated Statements of Operations (in millions):
| | | | | | | | | | | | | | | | | | | | | | | | | | | |
| | | | | | | Gain (Loss) Recognized in Consolidated Statements of Operations |
| Consolidated Statements of Operations Location | | | | Year Ended December 31, |
| | | | | | 2024 | | 2023 | | 2022 |
FX Derivatives | LNG revenues | | | | | | $ | 41 | | | $ | (24) | | | $ | 57 | |
| | | | | | | | | | | |
The following table shows the fair value and location of our derivative instruments on our Consolidated Balance Sheets (in millions):
| | | | | | | | | | | | | | | | | | | | | | | |
| December 31, 2024 |
| Liquefaction Supply Derivatives | | LNG Trading Derivatives | | FX Derivatives | | Total |
| Consolidated Balance Sheets Location | | | | | | | |
| Current derivative assets | $ | 105 | | | $ | 32 | | | $ | 18 | | | $ | 155 | |
| Derivative assets | 1,903 | | | — | | | — | | | 1,903 | |
| Total derivative assets | 2,008 | | | 32 | | | 18 | | | 2,058 | |
| | | | | | | |
| Current derivative liabilities | (885) | | | (15) | | | (2) | | | (902) | |
| Derivative liabilities | (1,865) | | | — | | | — | | | (1,865) | |
| Total derivative liabilities | (2,750) | | | (15) | | | (2) | | | (2,767) | |
| | | | | | | |
| Derivative asset (liability), net | $ | (742) | | | $ | 17 | | | $ | 16 | | | $ | (709) | |
| | | | | | | |
| December 31, 2023 |
| Liquefaction Supply Derivatives | | LNG Trading Derivatives | | FX Derivatives | | Total |
| Consolidated Balance Sheets Location | | | | | | | |
| Current derivative assets | $ | 49 | | | $ | 92 | | | $ | — | | | $ | 141 | |
| Derivative assets | 863 | | | — | | | — | | | 863 | |
| Total derivative assets | 912 | | | 92 | | | — | | | 1,004 | |
| | | | | | | |
| Current derivative liabilities | (651) | | | (82) | | | (17) | | | (750) | |
| Derivative liabilities | (2,378) | | | — | | | — | | | (2,378) | |
| Total derivative liabilities | (3,029) | | | (82) | | | (17) | | | (3,128) | |
| | | | | | | |
| Derivative asset (liability), net | $ | (2,117) | | | $ | 10 | | | $ | (17) | | | $ | (2,124) | |
CHENIERE ENERGY, INC. AND SUBSIDIARIES
NOTES TO CONSOLIDATED FINANCIAL STATEMENTS—CONTINUED
Consolidated Balance Sheets Presentation
The following table reconciles the fair value of our derivative assets and liabilities on a gross basis, by contract, to net amounts as presented on our Consolidated Balance Sheets after offsetting for any balances with the same counterparty under master netting arrangements or other relevant netting criteria under GAAP that are met (in millions):
| | | | | | | | | | | | | | | | | | | | |
| | Liquefaction Supply Derivatives | | LNG Trading Derivatives | | FX Derivatives |
| | | |
| As of December 31, 2024 | | | | | | |
| Gross assets | | $ | 3,064 | | | $ | 42 | | | $ | 25 | |
| Offsetting amounts | | (1,056) | | | (10) | | | (7) | |
| Net assets (1) | | $ | 2,008 | | | $ | 32 | | | $ | 18 | |
| | | | | | |
| Gross liabilities | | $ | (2,790) | | | $ | (16) | | | $ | (3) | |
| Offsetting amounts | | 40 | | | 1 | | | 1 | |
| Net liabilities (2) | | $ | (2,750) | | | $ | (15) | | | $ | (2) | |
| | | | | | |
| As of December 31, 2023 | | | | | | |
| Gross assets | | $ | 1,272 | | | $ | 94 | | | $ | — | |
| Offsetting amounts | | (360) | | | (2) | | | — | |
| Net assets (1) | | $ | 912 | | | $ | 92 | | | $ | — | |
| | | | | | |
| Gross liabilities | | $ | (3,095) | | | $ | (110) | | | $ | (17) | |
| Offsetting amounts | | 66 | | | 28 | | | — | |
| Net liabilities (2) | | $ | (3,029) | | | $ | (82) | | | $ | (17) | |
(1)Includes current and non-current derivative assets of $155 million and $1,903 million, respectively, as of December 31, 2024 and $141 million and $863 million, respectively, as of December 31, 2023.
(2)Includes current and non-current derivative liabilities of $902 million and $1,865 million, respectively, as of December 31, 2024 and $750 million and $2,378 million, respectively, as of December 31, 2023.
The table below shows the collateral balances that are recorded within margin deposits and not netted on our Consolidated Balance Sheets (in millions):
| | | | | | | | | | | | | | | |
| | | Year Ended December 31, |
| | | 2024 | | 2023 |
| Liquefaction Supply Derivatives | | | $ | 18 | | | $ | 3 | |
| | | | | |
| LNG Trading Derivatives | | | 110 | | | 15 | |
| | | | | |
NOTE 7—OTHER NON-CURRENT ASSETS, NET
Other non-current assets, net consisted of the following (in millions):
| | | | | | | | | | | | | | |
| | December 31, |
| | | | |
| | 2024 | | 2023 |
| Contract assets, net of current expected credit losses | | $ | 325 | | | $ | 244 | |
| Advances to service providers | | 203 | | | 175 | |
| Equity method investments | | 129 | | | 111 | |
| | | | |
| Goodwill | | 77 | | | 77 | |
| Debt issuance costs and deferred commitment fees, net of accumulated amortization | | 65 | | | 58 | |
| | | | |
| Advance ad valorem tax payments | | 20 | | | 20 | |
| Other, net | | 80 | | | 74 | |
| Total other non-current assets, net | | $ | 899 | | | $ | 759 | |
CHENIERE ENERGY, INC. AND SUBSIDIARIES
NOTES TO CONSOLIDATED FINANCIAL STATEMENTS—CONTINUED
NOTE 8—NON-CONTROLLING INTERESTS AND VARIABLE INTEREST ENTITIES
Substantially all of our consolidated VIEs’ assets and liabilities relate to CQP. We own a 48.6% limited partner interest in CQP, and we also own all of the 2% general partner interest and 100% of the incentive distribution rights in CQP. The remaining 49.4% non-controlling limited partner interest in CQP is held by affiliates of Blackstone Inc. and Brookfield Asset Management, Inc. (“Brookfield”) as well as the public.
CQP is a limited partnership formed by us in 2006 to own and operate the Sabine Pass LNG Terminal and related assets. Our wholly-owned subsidiary, Cheniere Partners GP, is the general partner of CQP. In 2012, CQP, Cheniere and Blackstone CQP Holdco LP (which was subsequently renamed to CQP Holdco LP, or “CQP Holdco”) entered into a unit purchase agreement whereby CQP sold 100.0 million Class B units to CQP Holdco in a private placement. The board of directors of Cheniere Partners GP was modified to include three directors appointed by CQP Holdco, four directors appointed by us and four independent directors mutually agreed upon by CQP Holdco and us and appointed by us. In addition, we provided CQP Holdco with a right to maintain one board seat on our Board of Directors (our “Board”). A quorum of Cheniere Partners GP directors consists of a majority of all directors, including at least two directors appointed by CQP Holdco, two directors appointed by us and two independent directors. CQP Holdco will no longer be entitled to appoint Cheniere Partners GP directors in the event that CQP Holdco’s ownership in CQP is less than 20% of outstanding common units and subordinated units.
As a holder of common units of CQP, we are not obligated to fund losses of CQP. However, our capital account, which would be considered in allocating the net assets of CQP were it to be liquidated, continues to share in losses of CQP. We have determined that Cheniere Partners GP is a VIE and that we, as the holder of the equity at risk, do not have a controlling financial interest due to the rights held by CQP Holdco. However, we continue to consolidate CQP as a result of CQP Holdco’s right to maintain one board seat on our Board which creates a de facto agency relationship between CQP Holdco and us. GAAP requires that when a de facto agency relationship exists, one of the members of the de facto agency relationship must consolidate the VIE based on certain criteria. As a result, we consolidate CQP in our Consolidated Financial Statements.
CHENIERE ENERGY, INC. AND SUBSIDIARIES
NOTES TO CONSOLIDATED FINANCIAL STATEMENTS—CONTINUED
The following table presents the summarized consolidated assets and liabilities (in millions) of our consolidated VIEs, which are included in our Consolidated Balance Sheets. The assets in the table below may only be used to settle obligations of the respective VIEs. In addition, there is no recourse to us for the consolidated VIEs’ liabilities. The assets and liabilities in the table below exclude intercompany balances between the respective VIEs and Cheniere that eliminate in our Consolidated Financial Statements.
| | | | | | | | | | | | | | |
| | December 31, |
| | | | |
| | 2024 | | 2023 |
| ASSETS | | | | |
| Current assets | | | | |
| Cash and cash equivalents | | $ | 270 | | | $ | 575 | |
| Restricted cash and cash equivalents | | 125 | | | 56 | |
| Trade and other receivables, net of current expected credit losses | | 381 | | | 373 | |
| Inventory | | 154 | | | 142 | |
| Current derivative assets | | 84 | | | 30 | |
| Margin deposits | | 13 | | | — | |
| Other current assets, net | | 54 | | | 43 | |
| Total current assets | | 1,081 | | | 1,219 | |
| | | | |
| | | | |
| Property, plant and equipment, net of accumulated depreciation | | 15,880 | | | 16,212 | |
| Operating lease assets | | 80 | | | 81 | |
| Derivative assets | | 98 | | | 40 | |
| Other non-current assets, net | | 206 | | | 188 | |
| | | | |
| Total assets | | $ | 17,345 | | | $ | 17,740 | |
| | | | |
| LIABILITIES | | | | |
| Current liabilities | | | | |
| Accounts payable | | $ | 70 | | | $ | 69 | |
| Accrued liabilities | | 881 | | | 811 | |
| Current debt, net of unamortized discount and debt issuance costs | | 351 | | | 300 | |
| Deferred revenue | | 120 | | | 114 | |
| Current operating lease liabilities | | 4 | | | 10 | |
| Current derivative liabilities | | 250 | | | 196 | |
| Other current liabilities | | 16 | | | 8 | |
| | | | |
| Total current liabilities | | 1,692 | | | 1,508 | |
| | | | |
| Long-term debt, net of unamortized discount and debt issuance costs | | 14,761 | | | 15,606 | |
| Operating lease liabilities | | 76 | | | 71 | |
| | | | |
| Derivative liabilities | | 1,213 | | | 1,531 | |
| Other non-current liabilities | | 176 | | | 89 | |
| Total liabilities | | $ | 17,918 | | | $ | 18,805 | |
| | | | |
| | | | |
| | | | |
| | | | |
| | | | |
NOTE 9—ACCRUED LIABILITIES
Accrued liabilities consisted of the following (in millions):
| | | | | | | | | | | | | | | | |
| | December 31, | | |
| | | | | | |
| | 2024 | | 2023 | | |
| Natural gas purchases | | $ | 886 | | | $ | 729 | | | |
| | | | | | |
| Tax-related liabilities | | 472 | | | 68 | | | |
| Interest costs and related debt fees | | 214 | | | 399 | | | |
| Compensation and benefits | | 283 | | | 266 | | | |
| Terminal and related asset costs | | 272 | | | 235 | | | |
| | | | | | |
| | | | | | |
| Other accrued liabilities | | 52 | | | 83 | | | |
| Total accrued liabilities | | $ | 2,179 | | | $ | 1,780 | | | |
CHENIERE ENERGY, INC. AND SUBSIDIARIES
NOTES TO CONSOLIDATED FINANCIAL STATEMENTS—CONTINUED
NOTE 10—DEBT
Debt consisted of the following (in millions):
| | | | | | | | | | | | | | |
| | December 31, |
| | | | |
| | 2024 | | 2023 |
SPL: | | | | |
| Senior Secured Notes: | | | | |
| | | | |
| | | | |
5.750% due 2024 | | $ | — | | | $ | 300 | |
5.625% due 2025 | | 300 | | | 2,000 | |
5.875% due 2026 | | 1,500 | | | 1,500 | |
5.00% due 2027 | | 1,500 | | | 1,500 | |
4.200% due 2028 | | 1,350 | | | 1,350 | |
4.500% due 2030 | | 2,000 | | | 2,000 | |
4.746% weighted average rate due 2037 (1) | | 1,782 | | | 1,782 | |
Total SPL Senior Secured Notes | | 8,432 | | | 10,432 | |
Revolving credit and guaranty agreement (the “SPL Revolving Credit Facility”) | | — | | | — | |
Total debt - SPL | | 8,432 | | | 10,432 | |
| | | | |
CQP: | | | | |
| Senior Notes: | | | | |
| | | | |
| | | | |
4.500% due 2029 | | 1,500 | | | 1,500 | |
4.000% due 2031 | | 1,500 | | | 1,500 | |
3.25% due 2032 | | 1,200 | | | 1,200 | |
5.950% due 2033 | | 1,400 | | | 1,400 | |
5.750% due 2034 | | 1,200 | | | — | |
Total CQP Senior Notes | | 6,800 | | | 5,600 | |
Revolving credit and guaranty agreement (the “CQP Revolving Credit Facility”) | | — | | | — | |
Total debt - CQP | | 6,800 | | | 5,600 | |
| | | | |
CCH: | | | | |
| Senior Secured Notes: | | | | |
| | | | |
5.875% due 2025 | | — | | | 1,491 | |
5.125% due 2027 | | 1,201 | | | 1,201 | |
3.700% due 2029 | | 1,125 | | | 1,125 | |
3.788% weighted average rate due 2039 (1) | | 2,539 | | | 2,539 | |
Total CCH Senior Secured Notes | | 4,865 | | | 6,356 | |
Term loan facility agreement (the “CCH Credit Facility”) | | — | | | — | |
Working capital facility agreement (the “CCH Working Capital Facility”) | | — | | | — | |
Total debt - CCH | | 4,865 | | | 6,356 | |
| | | | |
Cheniere: | | | | |
4.625% Senior Notes due 2028 | | 1,500 | | | 1,500 | |
5.650% Senior Notes due 2034 | | 1,500 | | | — | |
Total Cheniere Senior Notes | | 3,000 | | | 1,500 | |
Revolving credit agreement (the “Cheniere Revolving Credit Facility”) | | — | | | — | |
| | | | |
Total debt - Cheniere | | 3,000 | | | 1,500 | |
| | | | |
| | | | |
| Total debt | | 23,097 | | | 23,888 | |
| | | | |
| Current debt, net of unamortized discount and debt issuance costs (1) | | (351) | | | (300) | |
| | | | |
| Unamortized discount and debt issuance costs | | (192) | | | (191) | |
| Total long-term debt, net of unamortized discount and debt issuance costs | | $ | 22,554 | | | $ | 23,397 | |
(1)Includes notes that amortize based on a fixed amortization schedule as set forth in their respective indentures.
CHENIERE ENERGY, INC. AND SUBSIDIARIES
NOTES TO CONSOLIDATED FINANCIAL STATEMENTS—CONTINUED
Senior Notes
SPL Senior Secured Notes
The SPL Senior Secured Notes are senior secured obligations of SPL, ranking equally in right of payment with SPL’s other existing and future senior debt that is secured by the same collateral and senior in right of payment to any of its future subordinated debt. Subject to permitted liens, the SPL Senior Secured Notes are secured on a pari passu first-priority basis by a security interest in all of the membership interests in SPL and substantially all of SPL’s assets. SPL may, at any time, redeem all or part of the SPL Senior Secured Notes at specified prices set forth in the respective indentures governing the SPL Senior Secured Notes, plus accrued and unpaid interest, if any, to the date of redemption. The series of SPL Senior Secured Notes due in 2037 are fully amortizing according to a fixed sculpted amortization schedule, as set forth in the respective indentures.
CQP Senior Notes
The CQP Senior Notes are jointly and severally guaranteed by each of CQP’s current and certain future subsidiaries other than SPL and, subject to certain conditions governing its guarantee, Sabine Pass LP (each a “Guarantor” and collectively, the “CQP Guarantors”). The CQP Senior Notes are senior obligations of CQP, ranking equally in right of payment with CQP’s other existing and future unsubordinated debt and senior to any of its future subordinated debt. In the event that the aggregate amount of CQP’s secured indebtedness and the secured indebtedness of the CQP Guarantors (other than the CQP Senior Notes or any other series of notes issued under the CQP Base Indenture) outstanding at any one time exceeds the greater of (1) $1.5 billion and (2) 10% of net tangible assets, the CQP Senior Notes (except for the 2033 CQP Senior Notes and 2034 CQP Senior Notes) will be secured by a first-priority lien (subject to permitted encumbrances) on substantially all the existing and future tangible and intangible assets and rights of CQP and the CQP Guarantors, as well as the equity interests in the CQP Guarantors. The liens securing the CQP Senior Notes, if applicable, will be shared equally and ratably (subject to permitted liens) with the holders of any other senior secured obligations. CQP may, at any time, redeem all or part of the CQP Senior Notes at specified prices set forth in the respective indentures governing the CQP Senior Notes, plus accrued and unpaid interest, if any, to the date of redemption.
CCH Senior Secured Notes
The CCH Senior Secured Notes are jointly and severally guaranteed by CCH’s subsidiaries, CCL, CCP and Corpus Christi Pipeline GP, LLC (each a “CCH Guarantor” and collectively, the “CCH Guarantors”). The CCH Senior Secured Notes are senior secured obligations of CCH, ranking senior in right of payment to any and all of CCH’s future indebtedness that is subordinated to the CCH Senior Secured Notes and equal in right of payment with CCH’s other existing and future indebtedness that is senior and secured by the same collateral securing the CCH Senior Secured Notes. The CCH Senior Secured Notes are secured by a first-priority security interest in substantially all of CCH’s and the CCH Guarantors’ assets. CCH may, at any time, redeem all or part of the CCH Senior Secured Notes at specified prices set forth in the respective indentures governing the CCH Senior Secured Notes, plus accrued and unpaid interest, if any, to the date of redemption. The series of CCH Senior Secured Notes due in 2039 are fully amortizing according to a fixed sculpted amortization schedule, as set forth in the respective indentures.
Cheniere Senior Notes
The Cheniere Senior Notes are our general senior obligations and rank senior in right of payment to all of our future obligations that are, by their terms, expressly subordinated in right of payment to the Cheniere Senior Notes and equally in right of payment with all of our other existing and future unsubordinated indebtedness. The Cheniere Senior Notes are currently unsecured, but in certain instances may become secured in the future in connection with the incurrence of additional secured indebtedness by us. When required, the Cheniere Senior Notes will be secured on a first-priority basis by a lien on substantially all of our assets and equity interests in our direct subsidiaries (other than certain excluded subsidiaries), which liens rank pari passu with the liens securing the Cheniere Revolving Credit Facility. As of December 31, 2024, the Cheniere Senior Notes are not guaranteed by any of our subsidiaries. In the future, any subsidiary that guarantees any of our material indebtedness will also guarantee the Cheniere Senior Notes. We may, at any time, redeem all or part of the Cheniere Senior Notes at specified prices set forth in the indenture governing the Cheniere Senior Notes, plus accrued and unpaid interest, if any, to the date of redemption.
CHENIERE ENERGY, INC. AND SUBSIDIARIES
NOTES TO CONSOLIDATED FINANCIAL STATEMENTS—CONTINUED
Below is a schedule of future principal payments that we are obligated to make on our outstanding debt at December 31, 2024 (in millions):
| | | | | | | | |
| Years Ending December 31, | | Principal Payments |
| 2025 | | $ | 352 | |
| 2026 | | 1,607 | |
| 2027 | | 2,889 | |
| 2028 | | 3,091 | |
| 2029 | | 2,923 | |
| Thereafter | | 12,235 | |
| Total | | $ | 23,097 | |
Credit Facilities
Below is a summary of our committed credit facilities outstanding as of December 31, 2024 (in millions):
| | | | | | | | | | | | | | | | | | | | | | | | | | | | | | | | | | | | | | |
| | | | | | | | SPL Revolving Credit Facility (1) | | CQP Revolving Credit Facility (2) | | CCH Credit Facility (3) | | CCH Working Capital Facility (4) | | Cheniere Revolving Credit Facility (5) | | |
| Total facility size | | | | | | | | $ | 1,000 | | | $ | 1,000 | | | $ | 3,260 | | | $ | 1,500 | | | $ | 1,250 | | | |
| | | | | | | | | | | | | | | | | | |
| Less: | | | | | | | | | | | | | | | | | | |
| Outstanding balance | | | | | | | | — | | | — | | | — | | | — | | | — | | | |
| | | | | | | | | | | | | | | | | | |
| Letters of credit issued | | | | | | | | 224 | | | — | | | — | | | 110 | | | — | | | |
| Available commitment | | | | | | | | $ | 776 | | | $ | 1,000 | | | $ | 3,260 | | | $ | 1,390 | | | $ | 1,250 | | | |
| | | | | | | | | | | | | | | | | | |
| Priority ranking | | | | | | | | Senior secured | | Senior unsecured | | Senior secured | | Senior secured | | Senior unsecured | | |
| Interest rate on available balance (6) | | | | | | | | SOFR plus credit spread adjustment of 0.1%, plus margin of 1.0% - 1.75% or base rate plus 0.0% - 0.75% | | SOFR plus credit spread adjustment of 0.1%, plus margin of 1.125% - 2.0% or base rate plus 0.125% - 1.0% | | SOFR plus credit spread adjustment of 0.1%, plus margin of 1.5% or base rate plus 0.5% | | SOFR plus credit spread adjustment of 0.1%, plus margin of 1.0% - 1.5% or base rate plus 0.0% - 0.5% | | SOFR plus credit spread adjustment of 0.1%, plus margin of 1.075% - 2.20% or base rate plus 0.075% - 1.2% | | |
| | | | | | | | | | | | | | | | | | |
| Commitment fees on undrawn balance (6) | | | | | | | | 0.075% - 0.30% | | 0.10% - 0.30% | | 0.525% | | 0.10% - 0.20% | | 0.115% - 0.365% | | |
| Letter of credit fees (6) | | | | | | | | 1.0% - 1.75% | | 1.125% - 2.0% | | N/A | | 1.0% - 1.5% | | 1.075% - 2.20% | | |
| Maturity date | | | | | | | | June 23, 2028 | | June 23, 2028 | | (7) | | June 15, 2027 | | October 28, 2026 | | |
(1)The obligations of SPL under the SPL Revolving Credit Facility are secured by substantially all of the assets of SPL as well as a pledge of all of the membership interests in SPL and certain future subsidiaries of SPL on a pari passu basis by a first priority lien with the SPL Senior Secured Notes. The SPL Revolving Credit Facility contains customary contractual conditions for extensions of credit.
(2)The obligations under the CQP Revolving Credit Facility are jointly, severally and unconditionally guaranteed by Cheniere Investments, SPLNG, CTPL, Sabine Pass LNG-GP, LLC, Sabine Pass Tug Services, LLC and Cheniere Pipeline GP Interests, LLC.
(3)The obligations of CCH under the CCH Credit Facility are secured by a first priority lien on substantially all of the assets of CCH and its subsidiaries and by a pledge by CCH Holdco I of its limited liability company interests in CCH.
(4)The obligations of CCH under the CCH Working Capital Facility are secured by substantially all of the assets of CCH and the CCH Guarantors as well as all of the membership interests in CCH and each of the CCH Guarantors on a pari passu basis with the CCH Senior Secured Notes and the CCH Credit Facility.
(5)The Cheniere Revolving Credit Facility contains a financial covenant requiring us to maintain a non-consolidated leverage ratio not to exceed 5.50:1.00 as of the end of any fiscal quarter if (i) as of the last day of such fiscal quarter the aggregate principal amount of outstanding loans plus drawn and unreimbursed letters of credit is greater than 35% of the aggregate commitments under the Cheniere Revolving Credit Facility (a “Covenant Trigger Event”) or (ii) a Covenant Trigger Event had occurred and been continuing as of the last day of the immediately preceding fiscal quarter and as of the last day of such ending fiscal quarter such Covenant Trigger Event had not ceased for a period of at least thirty consecutive days.
CHENIERE ENERGY, INC. AND SUBSIDIARIES
NOTES TO CONSOLIDATED FINANCIAL STATEMENTS—CONTINUED
(6)The margin on the interest rate, the commitment fees and the letter of credit fees are subject to change based on the applicable entity’s credit rating.
(7)The CCH Credit Facility matures the earlier of June 15, 2029 or two years after the substantial completion of the last Train of the Corpus Christi Stage 3 Project.
Loss on Extinguishment of Debt Related to Termination of Agreement with Chevron
Our loss on modification or extinguishment of debt for the year ended December 31, 2022 includes a loss on extinguishment of prospective payment obligations of $31 million associated with a premium paid to Chevron U.S.A. Inc. (“Chevron”) to terminate a revenue sharing arrangement under the terminal marine services agreement with them. See Note 12—Revenue for further discussion of the termination of agreements with Chevron.
Restrictive Debt Covenants
The agreements governing our and our subsidiaries’ indebtedness contain customary terms and events of default and certain covenants that, among other things, may limit our and our subsidiaries’ ability to make certain investments or pay dividends or distributions. For example, SPL and CCH are restricted from making distributions under agreements governing their respective indebtedness generally until, among other requirements, appropriate reserves have been established for debt service using cash or letters of credit and a historical and projected debt service coverage ratio of at least 1.25:1.00 is satisfied. At December 31, 2024, our restricted net assets of consolidated subsidiaries were approximately $168 million.
As of December 31, 2024, each of our issuers was in compliance with all covenants related to their respective debt agreements.
Interest Expense
Total interest expense, net of capitalized interest, consisted of the following (in millions):
| | | | | | | | | | | | | | | | | | | | | | | | |
| | | | | Year Ended December 31, |
| | | | | | 2024 | | 2023 | | 2022 |
| Total interest cost | | | | | | $ | 1,226 | | | $ | 1,265 | | | $ | 1,485 | |
| Capitalized interest | | | | | | (216) | | | (124) | | | (79) | |
| Total interest expense, net of capitalized interest | | | | | | $ | 1,010 | | | $ | 1,141 | | | $ | 1,406 | |
Fair Value Disclosures
The following table shows the carrying amount and estimated fair value of our senior notes (in millions):
| | | | | | | | | | | | | | | | | | | | | | | | | | |
| | | December 31, 2024 | | December 31, 2023 |
| | | Carrying
Amount | | Estimated
Fair Value (1) | | Carrying
Amount | | Estimated
Fair Value (1) |
Senior notes | | $ | 23,097 | | | $ | 22,220 | | | $ | 23,888 | | | $ | 23,062 | |
| | | | | | | | |
| | | | | | | | |
| | | | | | | | |
| | | | | | | | |
| | | | | | | | |
(1)As of both December 31, 2024 and 2023, $3.0 billion of the fair value of our senior notes were classified as Level 3 since these senior notes were valued by applying an unobservable illiquidity adjustment to the price derived from trades or indicative bids of instruments with similar terms, maturities and credit standing. The remainder of the fair value of our senior notes was classified as Level 2, based on prices derived from trades or indicative bids of the instruments.
The estimated fair value of our credit facilities approximates the principal amount outstanding because the interest rates are variable and reflective of market rates and the debt may be repaid, in full or in part, at any time without penalty.
CHENIERE ENERGY, INC. AND SUBSIDIARIES
NOTES TO CONSOLIDATED FINANCIAL STATEMENTS—CONTINUED
NOTE 11—LEASES
We are the lessee of LNG vessels leased under time charters (“vessel charters”) as well as tug vessels, office space and facilities, land sites and equipment. All of our leases where we are the lessee are classified as operating leases except for certain of our vessel charters, tug vessels and equipment, which are classified as finance leases.
The following table shows the classification and location of our right-of-use assets and lease liabilities on our Consolidated Balance Sheets (in millions):
| | | | | | | | | | | | | | | | | |
| | | December 31, |
| | | | | |
| Consolidated Balance Sheets Location | | 2024 | | 2023 |
| Right-of-use assets—Operating | Operating lease assets | | $ | 2,684 | | | $ | 2,641 | |
| Right-of-use assets—Financing | Property, plant and equipment, net of accumulated depreciation | | 478 | | | 469 | |
| Total right-of-use assets | | | $ | 3,162 | | | $ | 3,110 | |
| | | | | |
| Current operating lease liabilities | Current operating lease liabilities | | $ | 592 | | | $ | 655 | |
| Current finance lease liabilities | Other current liabilities | | 44 | | | 35 | |
| Non-current operating lease liabilities | Operating lease liabilities | | 2,090 | | | 1,971 | |
| Non-current finance lease liabilities | Other non-current liabilities | | 486 | | | 467 | |
| Total lease liabilities | | | $ | 3,212 | | | $ | 3,128 | |
The following table shows the classification and location of our lease costs on our Consolidated Statements of Operations (in millions):
| | | | | | | | | | | | | | | | | | | | | | | | | | | |
| Consolidated Statements of Operations Location | | | | Year Ended December 31, |
| | | | | | 2024 | | 2023 | | 2022 |
| Operating lease cost (a) | Operating costs and expenses (1) | | | | | | $ | 839 | | | $ | 783 | | | $ | 828 | |
| Finance lease cost: | | | | | | | | | | | |
| Amortization of right-of-use assets | Depreciation, amortization and accretion expense | | | | | | 53 | | | 50 | | | 12 | |
| Interest on lease liabilities | Interest expense, net of capitalized interest | | | | | | 35 | | | 35 | | | 14 | |
| | | | | | | | | | | |
| Total lease cost | | | | | | | $ | 927 | | | $ | 868 | | | $ | 854 | |
| | | | | | | | | | | |
| (a) Included in operating lease cost: | | | | | | | | | | | |
| Short-term lease costs | | | | | | | $ | 16 | | | $ | 33 | | | $ | 122 | |
| Variable lease costs | | | | | | | 14 | | | 17 | | | 18 | |
(1)Presented in the appropriate line item within operating costs and expenses, consistent with the nature of our use of the asset under lease.
CHENIERE ENERGY, INC. AND SUBSIDIARIES
NOTES TO CONSOLIDATED FINANCIAL STATEMENTS—CONTINUED
Future annual minimum lease payments for operating and finance leases as of December 31, 2024 are as follows (in millions):
| | | | | | | | | | | |
| Years Ending December 31, | Operating Leases | | Finance Leases |
| 2025 | $ | 708 | | | $ | 78 | |
| 2026 | 584 | | | 80 | |
| 2027 | 489 | | | 82 | |
| 2028 | 321 | | | 84 | |
| 2029 | 232 | | | 84 | |
| Thereafter | 899 | | | 322 | |
| Total lease payments (1) | 3,233 | | | 730 | |
| Less: Interest | (551) | | | (200) | |
| Present value of lease liabilities | $ | 2,682 | | | $ | 530 | |
(1)Does not include approximately $3.3 billion of legally binding minimum payments for leases executed as of December 31, 2024 that will commence in future periods, consisting primarily of vessel charters, with fixed minimum lease terms of up to 15 years.
The following table shows the weighted-average remaining lease term and the weighted-average discount rate for our operating leases and finance leases:
| | | | | | | | | | | | | | | | | | | | | | | |
| December 31, 2024 | | December 31, 2023 |
| Operating Leases | | Finance Leases | | Operating Leases | | Finance Leases |
| Weighted-average remaining lease term (in years) | 7.0 | | 8.8 | | 6.3 | | 9.7 |
| Weighted-average discount rate (1) | 5.0% | | 7.4% | | 4.7% | | 7.7% |
(1)The weighted average discount rate is impacted by certain finance leases that commenced prior to the adoption of the current leasing standard under GAAP. In accordance with previous accounting guidance, the implied rate is based on the fair value of the underlying assets.
The following table includes other quantitative information for our operating and finance leases (in millions):
| | | | | | | | | | | | | | | | | |
| Year Ended December 31, |
| 2024 | | 2023 | | 2022 |
| Cash paid for amounts included in the measurement of lease liabilities: | | | | | |
| Operating cash flows from operating leases | $ | 803 | | | $ | 720 | | | $ | 713 | |
| Operating cash flows from finance leases | 35 | | | 35 | | | 14 | |
| Financing cash flows from finance leases | 35 | | | 28 | | | 7 | |
| Right-of-use assets obtained in exchange for operating lease liabilities (1) | 713 | | | 646 | | | 1,220 | |
| Right-of-use assets obtained in exchange for finance lease liabilities (2) | 61 | | | 8 | | | 473 | |
(1)Net of $33 million reclassified from operating leases to finance leases during the year ended December 31, 2024, as a result of modifications of the underlying tug vessel leases.
(2)Net of $15 million reclassified from finance leases to operating leases during the year ended December 31, 2024, as a result of modifications of the underlying tug vessel leases.
LNG Vessel Subleases
We sublease certain LNG vessels under charter to third parties while retaining our existing obligation to the original lessor. All of our sublease arrangements have been assessed as operating leases. The following table shows the sublease income recognized in other revenues on our Consolidated Statements of Operations (in millions):
| | | | | | | | | | | | | | | | | | | | | | | | |
| | | | Year Ended December 31, |
| | | | | | 2024 | | 2023 | | 2022 |
| Fixed income | | | | | | $ | 283 | | | $ | 446 | | | $ | 371 | |
| Variable income | | | | | | 39 | | | 57 | | | 79 | |
| Total sublease income | | | | | | $ | 322 | | | $ | 503 | | | $ | 450 | |
CHENIERE ENERGY, INC. AND SUBSIDIARIES
NOTES TO CONSOLIDATED FINANCIAL STATEMENTS—CONTINUED
As of December 31, 2024, the aggregate future annual minimum sublease payment to be received from LNG vessel subleases was $8 million and is expected to be received during the year ending December 31, 2025.
NOTE 12—REVENUES
The following table represents a disaggregation of revenue earned (in millions):
| | | | | | | | | | | | | | | | | | | | | | | | |
| | | | Year Ended December 31, |
| | | | | | 2024 | | 2023 | | 2022 |
| Revenues from contracts with customers | | | | | | | | | | |
LNG revenues (excluding net derivative gain (loss) below) | | | | | | $ | 14,972 | | | $ | 19,459 | | | $ | 32,132 | |
| Regasification revenues | | | | | | 135 | | | 135 | | | 1,068 | |
| Other revenues (1) | | | | | | 307 | | | 187 | | | 107 | |
| | | | | | | | | | |
| Total revenues from contracts with customers | | | | | | 15,414 | | | 19,781 | | | 33,307 | |
Net derivative gain (loss) (see Note 6) | | | | | | (73) | | | 110 | | | (328) | |
| | | | | | 322 | | | 503 | | | 450 | |
| Other revenues | | | | | | 40 | | | — | | | (1) | |
| Total revenues | | | | | | $ | 15,703 | | | $ | 20,394 | | | $ | 33,428 | |
(1)Includes revenues from LNG vessel subcharters that do not qualify as leases for accounting purposes.
LNG Revenues
We have numerous SPAs with third party customers for the sale of LNG on an FOB basis (delivered to the customer at the Sabine Pass LNG Terminal or the Corpus Christi LNG Terminal, as applicable) or a DAT basis (delivered to the customer at their specified LNG receiving terminal). Our customers generally purchase LNG for a price consisting of a fixed fee per MMBtu of LNG (a portion of which is subject to annual adjustment for inflation) plus a variable fee per MMBtu of LNG generally equal to 115% of Henry Hub. The fixed fee component is the amount payable to us regardless of a cancellation or suspension of LNG cargo deliveries by the customers. The variable fee component is the amount generally payable to us only upon delivery of LNG plus all future adjustments to the fixed fee for inflation. The SPAs and contracted volumes to be made available under the SPAs are not tied to a specific Train; however, the term of each SPA generally commences upon the date of first commercial delivery of a specified Train.
We intend to primarily use LNG sourced from our Sabine Pass LNG Terminal or our Corpus Christi LNG Terminal to provide contracted volumes to our customers. However, we supplement this LNG with volumes procured from third parties. LNG revenues recognized from LNG that was procured from third parties was $280 million, $359 million and $760 million for the years ended December 31, 2024, 2023 and 2022, respectively.
Regasification Revenues
The Sabine Pass LNG Terminal has operational regasification capacity of approximately 4 Bcf/d. Approximately 1 Bcf/d of the regasification capacity at the Sabine Pass LNG Terminal has been reserved under a long-term TUA with TotalEnergies Gas & Power North America, Inc. (“TotalEnergies”) under which they are required to pay fixed monthly fees to SPLNG, regardless of their use of the LNG terminal, aggregating approximately $125 million annually for 20 years that commenced in 2009, which is representative of fixed consideration in the contract. A portion of this fee is adjusted annually for inflation which is considered variable consideration. Prior to its cancellation effective December 31, 2022, SPLNG also had a TUA for 1 Bcf/d with Chevron, as further described under the caption Termination Agreement with Chevron. Approximately 2 Bcf/d of regasification capacity of the Sabine Pass LNG Terminal has been reserved by SPL, for which the associated revenues are eliminated in consolidation.
Because SPLNG is continuously available to provide regasification service on a daily basis with the same pattern of transfer, we have concluded that SPLNG provides a single performance obligation to its customers on a continuous basis over time. We have determined that an output method of recognition based on elapsed time best reflects the benefits of this service to the customer and accordingly, LNG regasification capacity reservation fees are recognized as regasification revenues on a straight-line basis over the term of the respective TUAs.
CHENIERE ENERGY, INC. AND SUBSIDIARIES
NOTES TO CONSOLIDATED FINANCIAL STATEMENTS—CONTINUED
In 2012, SPL entered into a partial TUA assignment agreement with TotalEnergies, whereby upon substantial completion of Train 5 of the SPL Project, SPL gained access to substantially all of TotalEnergies’ capacity and other services provided under TotalEnergies’ TUA with SPLNG. This agreement provides SPL with additional berthing and storage capacity at the Sabine Pass LNG Terminal that may be used to provide increased flexibility in managing LNG cargo loading and unloading activity and permit SPL to more flexibly manage its LNG storage capacity. Notwithstanding any arrangements between TotalEnergies and SPL, payments required to be made by TotalEnergies to SPLNG will continue to be made by TotalEnergies to SPLNG in accordance with its TUA and we continue to recognize the payments received from TotalEnergies as revenue. Costs incurred to TotalEnergies are recognized in operating and maintenance expense. During the years ended December 31, 2024, 2023 and 2022, SPL recorded $133 million, $132 million and $131 million, respectively, as operating and maintenance expense under this partial TUA assignment agreement.
Termination Agreement with Chevron
In June 2022, Chevron entered into an agreement with SPLNG providing for the early termination of the TUA and an associated terminal marine services agreement between the parties and their affiliates (the “Termination Agreement”), effective July 2022, for a lump sum fee of $765 million (the “Termination Fee”). Obligations pursuant to the TUA and associated agreement, including Chevron’s obligation to pay SPLNG capacity payments totaling $125 million annually (adjusted for inflation) from 2023 through 2029, terminated on December 31, 2022, upon SPLNG’s receipt of the Termination Fee in December 2022. We allocated the $765 million Termination Fee to the terminated commitments, with $796 million in cash inflows allocable to the termination of the TUA, which was recognized ratably over the July 6, 2022 to December 31, 2022 period as regasification revenues on our Consolidated Statements of Operations, and an offsetting $31 million reported, upon receipt of the Termination Fee, as a loss on extinguishment of debt on our Consolidated Statements of Operations allocable to a premium paid to Chevron to terminate a revenue sharing arrangement with them that was accounted for as debt.
Contract Assets and Liabilities
The following table shows our contract assets, net of current expected credit losses, which are classified as other current assets, net and other non-current assets, net on our Consolidated Balance Sheets (in millions):
| | | | | | | | | | | | | | |
| | December 31, |
| | | | |
| | 2024 | | 2023 |
| Contract assets, net of current expected credit losses | | $ | 331 | | | $ | 250 | |
Contract assets represent our right to consideration for transferring goods or services to the customer under the terms of a sales contract when the associated consideration is not yet due and also include consideration paid to our customers that will reduce the amount of revenue recognized as the remaining performance obligations in the contract are satisfied. The change in contract assets as of December 31, 2024 and 2023 was primarily attributable to differences between the timing of revenue recognition and the receipt of consideration related to delivery of LNG under certain SPAs.
The following table reflects the changes in our contract liabilities, which are included in deferred revenue and other non-current liabilities on our Consolidated Balance Sheets (in millions):
| | | | | | | | | | |
| | |
| | Year Ended December 31, 2024 | | |
| Deferred revenue, beginning of period | | $ | 294 | | | |
| Cash received but not yet recognized in revenue | | 190 | | | |
| Revenue recognized from prior period deferral | | (166) | | | |
| Deferred revenue, end of period | | $ | 318 | | | |
We record deferred revenue when we receive consideration, or such consideration is unconditionally due from a customer, prior to transferring goods or services to the customer under the terms of a sales contract. The change in deferred revenue as of December 31, 2024 and 2023 is primarily attributable to differences between the timing of revenue recognition and the receipt of advance payments related to delivery of LNG under certain SPAs.
CHENIERE ENERGY, INC. AND SUBSIDIARIES
NOTES TO CONSOLIDATED FINANCIAL STATEMENTS—CONTINUED
Transaction Price Allocated to Future Performance Obligations
Because many of our sales contracts have long-term durations, we are contractually entitled to significant future consideration which we have not yet recognized as revenue. The following table discloses the aggregate amount of the transaction price that is allocated to performance obligations that have not yet been satisfied:
| | | | | | | | | | | | | | | | | | | | | | | | | | |
| | December 31, 2024 | | December 31, 2023 |
| | Unsatisfied Transaction Price (in billions) | | Weighted Average Recognition Timing (years) (1) | | Unsatisfied Transaction Price (in billions) | | Weighted Average Recognition Timing (years) (1) |
| LNG revenues (2) | | $ | 104.7 | | | 8 | | $ | 111.0 | | | 9 |
| Regasification revenues | | 0.5 | | | 3 | | 0.7 | | | 3 |
| Total revenues | | $ | 105.2 | | | | | $ | 111.7 | | | |
(1)The weighted average recognition timing represents an estimate of the number of years during which we shall have recognized half of the unsatisfied transaction price.
(2)We may enter into contracts to sell LNG that are conditioned upon one or both of the parties achieving certain milestones such as reaching FID on a certain liquefaction Train, obtaining financing or achieving substantial completion of a Train and any related facilities. These contracts are included in the transaction price above when the conditions have been met and consideration is not otherwise constrained from ultimate pricing and receipt.
The following potential future sources of revenue are omitted from the table above under exemptions we have elected: (1) all performance obligations that are part of a contract that has an original expected duration of one year or less and (2) substantially all variable consideration under our SPAs and TUAs that is allocated entirely to a wholly unsatisfied performance obligation or to a wholly unsatisfied promise to transfer a distinct good or service that forms part of a single performance obligation when that performance obligation qualifies as a series. The amount of revenue from variable fees that is not included in the transaction price will vary based on the future prices of the underlying variable index, primarily Henry Hub, throughout the contract terms, to the extent customers elect to take delivery of their LNG, and adjustments to the consumer price index. Certain of our contracts contain additional variable consideration based on the outcome of contingent events and the movement of various indexes. We have not included such variable consideration in the transaction price to the extent the consideration is considered constrained due to the uncertainty of ultimate pricing and receipt.
The following table summarizes the percentage of variable consideration earned under contracts with customers included in the table above:
| | | | | | | | | | | | | | | | | |
| | | Year Ended December 31, | | |
| | | | | | | |
| | | | | 2024 | | 2023 | | |
| LNG revenues | | | | | 59 | % | | 69 | % | | |
| Regasification revenues | | | | | 8 | % | | 7 | % | | |
NOTE 13—RELATED PARTY TRANSACTIONS
Below is a summary of our related party transactions, all in the ordinary course of business, as reported on our Consolidated Statements of Operations (in millions):
| | | | | | | | | | | | | | | | | | | | | |
| | | Year Ended December 31, |
| | | | | 2024 | | 2023 | | 2022 |
| | | | | | | | | |
| | | | | | | | | |
| | | | | | | | | |
| Other revenues | | | | | | | | | |
| Operating agreement and construction management agreement with equity method investee | | | | | $ | 9 | | | $ | 10 | | | 7 | |
| | | | | | | | | |
| | | | | | | | | |
| | | | | | | | | |
| | | | | | | | | |
| | | | | | | | | |
| | | | | | | | | |
| | | | | | | | | |
| Operating and maintenance expense | | | | | | | | | |
| Natural gas transportation and storage agreements with equity method investees | | | | | 24 | | | 9 | | | 9 | |
| Natural gas transportation and storage agreements with other related party (1) | | | | | 73 | | | 62 | | | 72 | |
| | | | | | | | | |
| | | | | | | | | |
(1)These arrangements are with a party who indirectly owns a portion of CQP’s limited partner interests.
CHENIERE ENERGY, INC. AND SUBSIDIARIES
NOTES TO CONSOLIDATED FINANCIAL STATEMENTS—CONTINUED
During the year ended December 31, 2024, we sold certain physical assets to an equity method investee to support future natural gas transportation services to be provided to CCL involving such assets. We recognized the transaction as an exchange of other non-current assets totaling $34 million on our Consolidated Balance Sheets.
Below is a summary of our related party balances, all in the ordinary course of business, as reported on our Consolidated Balance Sheets (in millions):
| | | | | | | | | | | | | | |
| | December 31, |
| | | |
| 2024 | | 2023 |
| Trade and other receivables, net of current expected credit losses | $ | 4 | | | $ | 3 | |
| | | | |
| Accrued liabilities | 8 | | | 6 | |
| | | |
| | | |
| | | | |
| | | |
| | | |
NOTE 14—INCOME TAXES
The jurisdictional components of income before income taxes and non-controlling interests on our Consolidated Statements of Operations are as follows (in millions):
| | | | | | | | | | | | | | | | | | | | |
| | Year Ended December 31, |
| | 2024 | | 2023 | | 2022 |
| U.S. | | $ | 4,696 | | | $ | 11,176 | | | $ | (1,575) | |
| International | | 607 | | | 3,402 | | | 4,669 | |
| Total income before income taxes and non-controlling interests | | $ | 5,303 | | | $ | 14,578 | | | $ | 3,094 | |
Income tax provision included in our reported net income consisted of the following (in millions):
| | | | | | | | | | | | | | | | | | | | |
| | Year Ended December 31, |
| | 2024 | | 2023 | | 2022 |
| Current: | | | | | | |
| Federal | | $ | 471 | | | $ | 130 | | | $ | 6 | |
| State | | 2 | | | 1 | | | 2 | |
| Foreign | | 8 | | | (1) | | | 11 | |
| Total current | | 481 | | | 130 | | | 19 | |
| | | | | | |
| Deferred: | | | | | | |
| Federal | | 319 | | | 2,377 | | | 320 | |
| State | | 9 | | | 15 | | | 118 | |
| Foreign | | 2 | | | (3) | | | 2 | |
| Total deferred | | 330 | | | 2,389 | | | 440 | |
| Total income tax provision | | $ | 811 | | | $ | 2,519 | | | $ | 459 | |
Our income tax rates do not bear a customary relationship to statutory income tax rates. A reconciliation of the federal statutory income tax rate of 21% to our effective income tax rate is as follows:
| | | | | | | | | | | | | | | | | | | | |
| | Year Ended December 31, |
| | 2024 | | 2023 | | 2022 |
| U.S. federal statutory tax rate | | 21.0 | % | | 21.0 | % | | 21.0 | % |
| Income not taxable to Cheniere | | (5.0) | | | (3.1) | | | (8.2) | |
| | | | | | |
| Foreign-derived intangible income deduction | | (1.0) | | | (0.7) | | | (1.2) | |
| | | | | | |
| | | | | | |
| | | | | | |
| | | | | | |
| | | | | | |
| | | | | | |
| | | | | | |
| Valuation allowance | | (0.7) | | | — | | | 2.6 | |
| Other | | 1.0 | | | 0.1 | | | 0.6 | |
| Effective tax rate as reported | | 15.3 | % | | 17.3 | % | | 14.8 | % |
CHENIERE ENERGY, INC. AND SUBSIDIARIES
NOTES TO CONSOLIDATED FINANCIAL STATEMENTS—CONTINUED
Significant components of our deferred tax assets and liabilities are as follows (in millions):
| | | | | | | | | | | | | | |
| | December 31, |
| | 2024 | | 2023 |
| Deferred tax assets | | | | |
Net operating loss (“NOL”) carryforwards | | | | |
| Federal | | $ | 313 | | | $ | 915 | |
| | | | |
| State | | 119 | | | 163 | |
| Tax Credits | | | | |
| CAMT carryforward | | 383 | | | — | |
| Other tax credits | | 40 | | | 33 | |
| Derivative instruments | | — | | | 98 | |
| | | | |
| Operating lease liabilities | | 562 | | | 550 | |
| Other | | 306 | | | 298 | |
| Less: valuation allowance (1) | | (110) | | | (147) | |
| Total deferred tax assets | | 1,613 | | | 1,910 | |
| | | | |
| Deferred tax liabilities | | | | |
| Investment in partnerships | | (305) | | | (309) | |
| | | | |
| Property, plant and equipment | | (2,459) | | | (2,564) | |
| Operating lease assets | | (548) | | | (538) | |
| Derivative instruments | | (108) | | | — | |
| Other | | (30) | | | (18) | |
| Total deferred tax liabilities | | (3,450) | | | (3,429) | |
| | | | |
| Net deferred tax liabilities | | $ | (1,837) | | | $ | (1,519) | |
(1)Valuation allowance primarily relates to state NOL carryforward deferred tax assets and decreased by $37 million during the year ended December 31, 2024 primarily due to the reduced Louisiana corporate tax rate beginning January 1, 2025. The valuation allowance increased by $4 million and $80 million during the years ended December 31, 2023 and 2022, respectively.
NOL and tax credit carryforwards
Louisiana enacted legislation during the fourth quarter of 2024 which reduced the corporate tax rate from 7.5% to 5.5% beginning in 2025. As a result of such legislation, we remeasured our Louisiana deferred tax assets and liabilities at year end, resulting in a $43 million reduction to our Louisiana net deferred tax assets and $38 million reduction to our valuation allowance.
As of December 31, 2024, we had federal and state NOL carryforwards of approximately $1.5 billion and $2.2 billion, respectively. All of our NOLs have an indefinite carryforward period.
As of December 31, 2024, our CAMT credit carryforward has an indefinite life and our other tax credits expire between 2028 and 2034.
Our NOL and tax credit carryforwards are not subject to, nor impacted by, any prior tax ownership change. We continue to monitor public trading activity in our shares to identify potential tax ownership changes that could impact our timing and ability to utilize such attributes.
CHENIERE ENERGY, INC. AND SUBSIDIARIES
NOTES TO CONSOLIDATED FINANCIAL STATEMENTS—CONTINUED
Unrecognized Tax Benefits
As of December 31, 2024, we had unrecognized tax benefits of $72 million. If recognized, $65 million of unrecognized tax benefits would affect our effective tax rate in future periods. Interest and penalties related to income tax matters are recognized as part of income tax expense. Interest recognized as part of income tax provision was $6 million and $4 million as of December 31, 2024 and 2023, respectively, and cumulative accrued interest was $10 million and $4 million as of December 31, 2024 and 2023, respectively. There were no penalties associated with liabilities for unrecognized tax benefits recorded for the years ended December 31, 2024 and 2023. We do not expect the amount of our existing unrecognized tax benefit to significantly increase or decrease within the next 12 months.
We are subject to tax in the U.S. and various state and foreign jurisdictions and we are subject to periodic audits and reviews by taxing authorities. Federal and United Kingdom tax returns for the years after 2017 and state tax returns for the years after 2020 remain open for examination. Tax authorities may have the ability to review and adjust carryover attributes that were generated prior to these periods if utilized in an open tax year.
A reconciliation of the beginning and ending amounts of our unrecognized tax benefits is as follows (in millions):
| | | | | | | | | | | |
| Year Ended December 31, |
| 2024 | | 2023 |
| Balance at beginning of the year | $ | 73 | | | $ | 74 | |
| | | |
| | | |
| Reductions for tax positions of prior years | (1) | | | (1) | |
| | | |
| | | |
| Balance at end of the year | $ | 72 | | | $ | 73 | |
NOTE 15—SHARE-BASED COMPENSATION
Our Amended and Restated 2020 Incentive Plan (the “2020 Plan”) is a broad-based incentive plan which allows for the issuance of stock options and stock appreciation rights and awards of bonus stock, phantom stock, restricted stock, restricted stock units and performance awards and other stock-based awards to employees, consultants and non-employee directors. The 2020 Plan provides for the issuance of 12.5 million shares of our common stock, of which we had 7.6 million shares available for future issuance as of December 31, 2024. Our outstanding awards as of December 31, 2024 primarily consisted of restricted stock units (“RSUs”) and performance stock units (“PSUs”).
Restricted Stock Units
RSUs are stock awards that contain a graded vesting period of up to three years and, with the exception of awards to certain officers which contain a cash settlement option, as described in Liability-Classified Awards below, will settle in stock upon vesting subject to restrictions on transfer and to a risk of forfeiture if the recipient terminates employment with us prior to the lapse of the restrictions.
Performance Stock Units
PSUs provide for cliff vesting after a period of approximately three years with payouts dependent upon the achievement of metrics compared to pre-established performance targets over the defined performance period, including a performance condition consisting of cumulative distributable cash flow per share, and in certain circumstances, a market condition consisting of absolute total shareholder return (“ATSR”) of our common stock. All PSUs will settle in stock, with the exception of awards to certain officers which contain cash settlement features, either as granted or modified, as described in Liability-Classified Awards below.
Compensation cost attributed to the performance metric will vary due to changing estimates of units to be earned, based on expected achievement of the performance metric. The number of units that may be earned at the end of the vesting period ranges from 0% up to 300% of the target award amount.
Liability-Classified Awards
RSUs and PSUs granted to certain officers may be, as granted or modified, settled in cash in lieu of shares at the option of the officer following approval by the Compensation Committee, in order to limit the dilution from equity grants consistent
CHENIERE ENERGY, INC. AND SUBSIDIARIES
NOTES TO CONSOLIDATED FINANCIAL STATEMENTS—CONTINUED
with our share repurchase program under our long-term capital allocation plan, provided that we have sufficient liquidity to do so and the officers maintain certain stock ownership requirements. Notwithstanding those awards which contain a cash settlement option, PSUs granted to certain officers contain a cash settlement cap of $3 million.
During the years ended December 31, 2024, 2023 and 2022, we paid $109 million, $84 million and $38 million, respectively, in cash upon vesting of the liability-classified awards.
Total share-based compensation costs, net of forfeitures, consisted of the following (in millions):
| | | | | | | | | | | | | | | | | | | | | | | | |
| | | | Year Ended December 31, |
| | | | | | 2024 | | 2023 | | 2022 |
| Share-based compensation costs before income taxes: | | | | | | | | | | |
| Equity awards | | | | | | $ | 121 | | | $ | 100 | | | $ | 112 | |
| Liability awards | | | | | | 101 | | | 155 | | | 97 | |
| Total share-based compensation | | | | | | 222 | | | 255 | | | 209 | |
| Capitalized share-based compensation | | | | | | (7) | | | (5) | | | (4) | |
| Total share-based compensation expense before income taxes | | | | | | $ | 215 | | | $ | 250 | | | $ | 205 | |
| Tax benefit associated with share-based compensation costs | | | | | | $ | 46 | | | $ | 54 | | | $ | 48 | |
The table below provides a summary of activity related to our RSUs and PSUs (in millions, except for per unit information):
| | | | | | | | | | | | | | | | | | | | | | | | | | | | | | | | | | | | | | | | | | | | | | | | | | |
| | Restricted Stock Units | | Performance Stock Units |
| | Equity Awards | | Liability Awards | | Equity Awards | | Liability Awards |
| | | Units | | Weighted Average Grant Date Fair Value Per Unit | | Units | | Weighted Average Grant Date Fair Value Per Unit | | Units | | Weighted Average Grant Date Fair Value Per Unit | | Units | | Weighted Average Grant Date Fair Value Per Unit |
Non-vested at January 1, 2024 | | 1.6 | | | $ | 123.24 | | | 0.2 | | | $ | 182.15 | | | 0.5 | | | $ | 124.19 | | | 0.6 | | | $ | 261.24 | |
| Granted (1) | | 0.6 | | | 159.88 | | | 0.0 | | | 214.87 | | | 0.2 | | | 170.89 | | | — | | | — | |
| Incremental units achieved (2) | | — | | | — | | | — | | | — | | | 0.1 | | | 159.98 | | | — | | | — | |
| Forfeited | | 0.0 | | | 149.36 | | | — | | | — | | | — | | | — | | | — | | | — | |
| Reclassifications (3) | | (0.1) | | | 146.67 | | | 0.1 | | | 205.21 | | | (0.2) | | | 158.77 | | | 0.2 | | | 271.19 | |
| Vested (4) | | (0.8) | | | 108.69 | | | (0.1) | | | 167.20 | | | (0.2) | | | 69.14 | | | (0.3) | | | 252.30 | |
Non-vested at December 31, 2024 | | 1.3 | | | $ | 149.52 | | | 0.2 | | | $ | 214.87 | | | 0.4 | | | $ | 153.07 | | | 0.5 | | | $ | 298.22 | |
(1)The Equity Awards column for PSUs includes 0.1 million PSUs granted in 2024 to certain officers containing a cash settlement cap of $3 million.
(2)Represents incremental units recognized as a result of final performance measures or changes in estimated measures. As of December 31, 2024, there were 0.2 million PSUs that would be issued if the maximum level of performance under the target awards amount is achieved.
(3)During the years ended December 31, 2024, 2023 and 2022, we recognized $14 million, $86 million and $56 million, respectively, in incremental expense as a result of significant modifications involving reclassification between equity awards and liability awards, attributable to seven, six and six employees, respectively.
(4)The total fair value of RSUs and PSUs vested was $171 million and $112 million, respectively, for the year ended December 31, 2024.
CHENIERE ENERGY, INC. AND SUBSIDIARIES
NOTES TO CONSOLIDATED FINANCIAL STATEMENTS—CONTINUED
The table below provides the assumptions used in estimating the fair value of unvested awards containing market conditions as of the end of the respective periods, and for which the performance period had not yet ended:
| | | | | | | | | | | | | | | | | | | | | | | | |
| | | | Year Ended December 31, |
| | | | | | 2024 | | 2023 | | 2022 |
| Fair value assumptions: | | | | | | | | | | |
| Dividend yield (1) | | | | | | — | % | | — | % | | — | % |
| Expected volatility (2)(3) | | | | | | 21.5% - 24.3% | | 27.5% - 32.7% | | 36.4% - 40.2% |
| Weighted average expected volatility | | | | | | 22.9 | % | | 29.9 | % | | 38.6 | % |
| Risk-free interest rate (2) | | | | | | 4.2% - 4.3% | | 4.2% - 4.8% | | 4.4% - 4.7% |
| Weighted average expected remaining term, in years | | | | | | 1.5 | | 1.5 | | 1.4 |
(1)The performance stock units are entitled to dividend equivalents during the performance period. Therefore, when calculating simulated returns, we applied an annual dividend yield of zero percent.
(2)Represents the range associated with individual vesting years.
(3)The expected volatility is based on historical and implied volatilities of our common stock price.
The total unrecognized compensation cost at December 31, 2024 relating to non-vested share-based compensation arrangements was $157 million, which is expected to be recognized over a weighted average period of 1.3 years.
NOTE 16—EMPLOYEE BENEFIT PLAN
We have a defined contribution plan (“401(k) Plan”) which allows eligible employees to contribute up to 75% of their compensation up to the Internal Revenue Service maximum. We match each employee’s deferrals (contributions) up to 6% of compensation and may make additional contributions at our discretion. Employees are immediately vested in the contributions made by us. Our contributions to the 401(k) Plan were $18 million, $17 million and $16 million for of the years ended December 31, 2024, 2023 and 2022, respectively. We have made no discretionary contributions to the 401(k) Plan to date.
NOTE 17—NET INCOME PER SHARE ATTRIBUTABLE TO COMMON STOCKHOLDERS
The following table reconciles basic and diluted weighted average common shares outstanding and common stock dividends declared (in millions, except per share data):
| | | | | | | | | | | | | | | | | | | | | | |
| | | | Year Ended December 31, |
| | | | | | 2024 | | 2023 | | 2022 |
| Net income attributable to Cheniere | | | | | | $ | 3,252 | | | $ | 9,881 | | | $ | 1,428 | |
| | | | | | | | | | |
| | | | | | | | | | |
| | | | | | | | | | |
| Weighted average common shares outstanding: | | | | | | | | | | |
| Basic | | | | | | 228.4 | | | 241.0 | | | 251.1 | |
| Dilutive unvested stock | | | | | | 0.7 | | | 1.6 | | | 2.3 | |
| | | | | | | | | | |
| Diluted | | | | | | 229.1 | | | 242.6 | | | 253.4 | |
| | | | | | | | | | |
Net income per share attributable to common stockholders—basic (1) | | | | | | $ | 14.24 | | | $ | 40.99 | | | $ | 5.69 | |
Net income per share attributable to common stockholders—diluted (1) | | | | | | $ | 14.20 | | | $ | 40.72 | | | $ | 5.64 | |
| | | | | | | | | | |
| | | | | | | | | | |
(1)Earnings per share in the table may not recalculate exactly due to rounding because it is calculated based on whole numbers, not the rounded numbers presented.
On January 28, 2025, we declared a quarterly dividend of $0.50 per share of common stock that is payable on February 21, 2025 to stockholders of record as of the close of business on February 7, 2025.
During the year ended December 31, 2022, 0.3 million shares of potentially dilutive securities related to the 4.25% Convertible Senior Notes due 2045 (the “2045 Cheniere Convertible Senior Notes”) were excluded from the diluted net income per share computation because their effects would have been anti-dilutive. The 2045 Cheniere Convertible Senior Notes were redeemed or converted in cash on January 5, 2022. However, the adoption of ASU 2020-06 on January 1, 2022
CHENIERE ENERGY, INC. AND SUBSIDIARIES
NOTES TO CONSOLIDATED FINANCIAL STATEMENTS—CONTINUED
required a presumption of share settlement for the purpose of calculating the impact to diluted earnings per share during the period the notes were outstanding in 2022. Such impact was anti-dilutive as a result of the reported net loss attributable to common stockholders during the 2022 period.
NOTE 18—SHARE REPURCHASE PROGRAMS
The following table presents information with respect to common stock repurchased under our share repurchase program (in millions, except per share data):
| | | | | | | | | | | | | | | | | | | | | |
| | | Year Ended December 31, |
| | | | | 2024 | | 2023 | | 2022 |
| Total shares repurchased | | | | | 13.75 | | | 9.54 | | | 9.35 | |
| Weighted average price paid per share | | | | | $ | 163.72 | | | $ | 155.50 | | | $ | 146.88 | |
| Total cost of repurchases (1) | | | | | $ | 2,251 | | | $ | 1,484 | | | $ | 1,373 | |
(1)Amount excludes associated commission fees and excise taxes incurred, which are excluded costs under the repurchase program.
As of December 31, 2024, we had approximately $3.9 billion remaining under our share repurchase program, subsequent to authorization by our Board of Directors to increase our previous authorization by $4.0 billion on June 14, 2024. Our share repurchase program authorization is effective through December 31, 2027.
NOTE 19—COMMITMENTS AND CONTINGENCIES
Commitments
We have various future contractual commitments which do not meet the definition of a liability as of December 31, 2024 and thus are not recognized as liabilities in our Consolidated Financial Statements. Executed contracts containing such future commitments include agreements for capital expenditures, the use of LNG vessels contracted for future delivery, natural gas transportation and storage services, goods and services necessary to operate our Liquefaction Projects and letters of credit.
CCL has a contractual commitment under a lump sum turnkey contract with Bechtel Energy Inc. (“Bechtel”) for the engineering, procurement and construction of the Corpus Christi Stage 3 Project. As of December 31, 2024, the total contract price of the EPC contract was approximately $6.0 billion, inclusive of amounts incurred under change orders, of which we had approximately $1.9 billion remaining obligations under this contract. Additionally, we had approximately $0.3 billion in contractual commitments under other construction agreements in support of our Liquefaction Projects as of December 31, 2024.
Environmental and Regulatory Matters
Our LNG terminals and pipelines are subject to extensive regulation under federal, state and local statutes, rules, regulations and laws. These laws require that we engage in consultations with appropriate federal and state agencies and that we obtain and maintain applicable permits and other authorizations. Failure to comply with such laws could result in legal proceedings, which may include substantial penalties. We believe that, based on currently known information, compliance with these laws and regulations will not have a material adverse effect on our results of operations, financial condition or cash flows.
Legal Proceedings
We are, and may in the future be, involved as a party to various legal proceedings, which are incidental to the ordinary course of business. We regularly analyze current information and, as necessary, provide accruals for probable liabilities on the eventual disposition of these matters. We recognize legal costs in connection with legal and regulatory matters as they are incurred. While the results of these litigation matters and claims cannot be predicted with certainty, we believe the reasonably possible losses from such matters, individually and in the aggregate, are not material. Additionally, we believe the probable final outcome of such matters will not have a material impact on our operating results, financial position or cash flows.
CHENIERE ENERGY, INC. AND SUBSIDIARIES
NOTES TO CONSOLIDATED FINANCIAL STATEMENTS—CONTINUED
NOTE 20—SEGMENT INFORMATION AND CUSTOMER CONCENTRATION
We have determined that we operate as a single operating and reportable segment. Our executive team is organized by function, rather than legal entity or discrete financial data oversight, with no business component managers reporting to the chief operating decision maker (“CODM”), who is our president and chief executive officer. The CODM regularly analyzes financial and operational data on a single basis of segmentation at the consolidated level, consistent with our integrated service offering, in order to allocate resources and assess performance.
The measure of profit and loss regularly provided to the CODM that is most consistent with GAAP is net income attributable to Cheniere, as presented in our Consolidated Statements of Operations. This measure contributes to the CODM’s assessment of performance and resource allocation, which includes monitoring of budget versus actual results, establishing compensation and deciding on capital allocation priorities. Significant expenses regularly provided to the CODM, and included in the measure of profit and loss, are the following consolidated expenses as reported in our Consolidated Statements of Operations: (1) cost of sales, (2) operating and maintenance expense and (3) selling, general and administrative expense. Included in the measure of profit and loss is a significant noncash item of changes in the fair value of our derivative instruments, which was $1.3 billion in gains, $8.0 billion in gains and $5.7 billion in losses for the years ended December 31, 2024, 2023 and 2022, respectively. Interest income was $188 million, $206 million and $48 million for the years ended December 31, 2024, 2023 and 2022, respectively, which is included in interest and dividend income on our Consolidated Statements of Operations.
The measure of segment assets is reported on our Consolidated Balance Sheets as total assets. Substantially all of our tangible long-lived assets, which consist of property, plant and equipment, are located in the United States. Total expenditures for additions to long-lived assets is reported on our Consolidated Statements of Cash Flows.
For the years ended December 31, 2024, 2023 and 2022, we had no customers with revenues in excess of 10% of total revenues. We had one customer with balance of trade and other receivables and contract assets, both net of current expected credit losses, representing 20% and 13% of total trade and other receivables and contract assets, both net of current expected credit losses, as of December 31, 2024 and 2023, respectively.
The following table shows revenues from external customers attributable to the country in which the revenues were derived (in millions). We attribute revenues from external customers to the country in which the party to the applicable agreement has its principal place of business.
| | | | | | | | | | | | | | | | | |
| Revenues from External Customers |
| Year Ended December 31, |
| 2024 | | 2023 | | 2022 |
| United States | $ | 2,472 | | | $ | 2,868 | | | $ | 5,213 | |
| Singapore | 1,991 | | | 3,407 | | | 3,273 | |
| Ireland | 1,431 | | | 1,596 | | | 2,726 | |
| United Kingdom | 1,317 | | | 2,908 | | | 4,642 | |
| South Korea | 1,178 | | | 1,503 | | | 2,225 | |
| Spain | 1,175 | | | 1,357 | | | 2,226 | |
| India | 1,015 | | | 1,166 | | | 2,109 | |
| Switzerland | 874 | | | 534 | | | 1,725 | |
| China | 854 | | | 667 | | | 552 | |
| Taiwan | 720 | | | 828 | | | 1,223 | |
| Other countries | 2,676 | | | 3,560 | | | 7,514 | |
| Total | $ | 15,703 | | | $ | 20,394 | | | $ | 33,428 | |
CHENIERE ENERGY, INC. AND SUBSIDIARIES
NOTES TO CONSOLIDATED FINANCIAL STATEMENTS—CONTINUED
NOTE 21—SUPPLEMENTAL CASH FLOW INFORMATION
The following table provides supplemental disclosure of substantive cash flow information (in millions):
| | | | | | | | | | | | | | | | | |
| Year Ended December 31, |
| 2024 | | 2023 | | 2022 |
| Cash paid during the period for interest on debt, net of amounts capitalized | $ | 1,075 | | | $ | 1,032 | | | $ | 891 | |
| Cash paid (refunded) for income taxes, net | (92) | | | 117 | | | 30 | |
| Non-cash investing activity: | | | | | |
| Unpaid purchases of property, plant and equipment (1) | 256 | | | 204 | | | 181 | |
| | | | | |
| | | | | |
| Conveyance of property, plant and equipment in exchange for other non-current assets | — | | | — | | | 17 | |
| | | | | |
| Conveyance of other non-current assets to equity method investee in exchange for equity method investment or infrastructure support | 34 | | | 30 | | | — | |
| Non-cash financing activity (1): | | | | | |
| | | | | |
| Unpaid excise taxes on repurchase of common stock | 21 | | | 13 | | | — | |
| Unpaid repurchase on common stock | — | | | 10 | | | — | |
| Unpaid dividends on common stock | — | | | 3 | | | 4 | |
(1)Reflects unpaid portion, as of the end of each period, of assets and liabilities recognized during the respective periods.
See Note 11—Leases for supplemental cash flow information related to our leases.
ITEM 9. CHANGES IN AND DISAGREEMENTS WITH ACCOUNTANTS ON ACCOUNTING AND FINANCIAL DISCLOSURE
None.
ITEM 9A. CONTROLS AND PROCEDURES
Evaluation of Disclosure Controls and Procedures
Disclosure controls and procedures include, without limitation, controls and procedures designed to ensure that information required to be disclosed by us in reports we file or submit under the Exchange Act is recorded, processed, summarized and reported within the time periods specified in the SEC’s rules and forms, and that such information is accumulated and communicated to our management, including our principal executive officer and principal financial officer, as appropriate, to allow timely decisions regarding required disclosure.
Based on their evaluation as of the end of the fiscal year ended December 31, 2024, our principal executive officer and principal financial officer have concluded that our disclosure controls and procedures (as defined in Rules 13a-15(e) and 15d-15(e) under the Exchange Act) are effective to ensure that information required to be disclosed in reports that we file or submit under the Exchange Act are (1) accumulated and communicated to our management, including our principal executive officer and principal financial officer, as appropriate, to allow timely decisions regarding required disclosure and (2) recorded, processed, summarized and reported within the time periods specified in the SEC’s rules and forms.
During the most recent fiscal quarter, there have been no changes in our internal control over financial reporting that have materially affected, or are reasonably likely to materially affect, our internal control over financial reporting.
Management’s Report on Internal Control Over Financial Reporting
ITEM 9B. OTHER INFORMATION
Rule 10b5-1 under the Exchange Act provides an affirmative defense that enables prearranged transactions in securities in a manner that avoids concerns about initiating transactions at a future date while possibly in possession of material nonpublic information. Our Insider Trading Policy permits our directors and executive officers to enter into trading plans designed to comply with Rule 10b5-1. During the three-month period ending December 31, 2024, none of our executive officers or directors adopted or terminated a Rule 10b5-1 trading plan or adopted or terminated a non-Rule 10b5-1 trading arrangement (as defined in Item 408(c) of Regulation S-K).
ITEM 9C. DISCLOSURE REGARDING FOREIGN JURISDICTIONS THAT PREVENT INSPECTIONS
Not applicable.
PART III
Pursuant to paragraph 3 of General Instruction G to Form 10-K, the information required by Items 10 through 13 of Part III of this Report is incorporated by reference from Cheniere’s definitive proxy statement, which is to be filed pursuant to Regulation 14A within 120 days after the end of Cheniere’s fiscal year ended December 31, 2024.
ITEM 14. PRINCIPAL ACCOUNTANT FEES AND SERVICES
Our independent registered public accounting firm is KPMG LLP, Houston, Texas, Auditor Firm ID 185.
The remaining information required by this Item is incorporated by reference from Cheniere’s definitive proxy statement, which is to be filed pursuant to Regulation 14A within 120 days after the end of Cheniere’s fiscal year ended December 31, 2024.
PART IV
ITEM 15. EXHIBITS AND FINANCIAL STATEMENT SCHEDULES
(a) Financial Statements, Schedules and Exhibits
(1) Financial Statements—Cheniere Energy, Inc. and Subsidiaries:
(2) Financial Statement Schedules:
All financial statement schedules have been omitted because they are not required, are not applicable, or the required information has been included in the consolidated financial statements and accompanying notes included in this Form 10-K.
(3) Exhibits:
Certain of the agreements filed as exhibits to this Form 10-K contain representations, warranties, covenants and conditions by the parties to the agreements that have been made solely for the benefit of the parties to the agreement. These representations, warranties, covenants and conditions:
•should not in all instances be treated as categorical statements of fact, but rather as a way of allocating the risk to one of the parties if those statements prove to be inaccurate;
•may have been qualified by disclosures that were made to the other parties in connection with the negotiation of the agreements, which disclosures are not necessarily reflected in the agreements;
•may apply standards of materiality that differ from those of a reasonable investor; and
•were made only as of specified dates contained in the agreements and are subject to subsequent developments and changed circumstances.
Accordingly, these representations and warranties may not describe the actual state of affairs as of the date they were made or at any other time. These agreements are included to provide you with information regarding their terms and are not intended to provide any other factual or disclosure information about the Company or the other parties to the agreements. Investors should not rely on them as statements of fact.
| | | | | | | | | | | | | | | | | | | | | | | | | | | | | | | | | |
| Exhibit No. | | | | Incorporated by Reference (1) | |
| Description | | Entity | | Form | | Exhibit | | Filing Date | |
| 2.1 | | | | CQP | | 8-K | | 10.2 | | 8/9/2012 | |
| 3.1 | | | | Cheniere | | 10-Q | | 3.1 | | 8/10/2004 | |
| 3.2 | | | | Cheniere | | 8-K | | 3.1 | | 2/8/2005 | |
| | | | | | | | | | | | | | | | | | | | | | | | | | | | | | | | | |
| Exhibit No. | | | | Incorporated by Reference (1) | |
| Description | | Entity | | Form | | Exhibit | | Filing Date | |
| 3.3 | | | | Cheniere (SEC File No. 333-160017) | | S-8 | | 4.3 | | 6/16/2009 | |
| 3.4 | | | | Cheniere | | 8-K | | 3.1 | | 6/7/2012 | |
| 3.5 | | | | Cheniere | | 8-K | | 3.1 | | 2/5/2013 | |
| 3.6 | | | | Cheniere | | 8-K | | 3.1 | | 5/24/2024 | |
| 3.7 | | | | Cheniere | | 8-K | | 3.1 | | 9/3/2024 | |
| 4.1 | | | | Cheniere (SEC File No. 333-10905) | | S-1 | | 4.1 | | 8/27/1996 | |
| 4.2 | | | | CQP | | 8-K | | 4.1 | | 2/4/2013 | |
| 4.3 | | | | CQP | | 8-K | | 4.1.1 | | 4/16/2013 | |
| 4.4 | | | | CQP | | 8-K | | 4.1.2 | | 4/16/2013 | |
| 4.5 | | | | CQP | | 8-K | | 4.1 | | 11/25/2013 | |
4.6 | | | | CQP | | 8-K | | 4.1 | | 5/22/2014 | |
4.7 | | | | CQP | | 8-K | | 4.2 | | 5/22/2014 | |
| 4.8 | | | | CQP | | 8-K | | 4.1 | | 3/3/2015 | |
| 4.9 | | | | CQP | | 8-K | | 4.1 | | 3/3/2015 | |
| 4.10 | | | | CQP | | 8-K | | 4.1 | | 6/14/2016 | |
| 4.11 | | | | CQP | | 8-K | | 4.1 | | 6/14/2016 | |
| 4.12 | | | | CQP | | 8-K | | 4.1 | | 9/23/2016 | |
| 4.13 | | | | CQP | | 8-K | | 4.2 | | 9/23/2016 | |
| 4.14 | | | | CQP | | 8-K | | 4.2 | | 9/23/2016 | |
| 4.15 | | | | CQP | | 8-K | | 4.1 | | 3/6/2017 | |
| 4.16 | | | | CQP | | 8-K | | 4.1 | | 3/6/2017 | |
| 4.17 | | | | SPL | | 8-K | | 4.1 | | 5/8/2020 | |
| 4.18 | | | | SPL | | 8-K | | 4.1 | | 5/8/2020 | |
| | | | | | | | | | | | | | | | | | | | | | | | | | | | | | | | | |
| Exhibit No. | | | | Incorporated by Reference (1) | |
| Description | | Entity | | Form | | Exhibit | | Filing Date | |
| 4.19 | | | | SPL | | 8-K | | 4.1 | | 11/29/2022 | |
| 4.20 | | | | SPL | | 8-K | | 4.1 | | 11/29/2022 | |
| 4.21 | | | | CQP | | 8-K | | 4.1 | | 2/27/2017 | |
| 4.22 | | | | CQP | | 8-K | | 4.1 | | 2/27/2017 | |
| 4.23 | | | | Cheniere | | 10-K | | 4.24 | | 2/24/2022 | |
| 4.24 | | | | Cheniere | | 10-K | | 4.24 | | 2/24/2022 | |
| 4.25 | | | | Cheniere | | 10-K | | 4.26 | | 2/24/2022 | |
| 4.26 | | | | Cheniere | | 10-K | | 4.26 | | 2/24/2022 | |
| 4.27 | | | | Cheniere | | 10-K | | 4.28 | | 2/24/2022 | |
| 4.28 | | | | Cheniere | | 10-K | | 4.28 | | 2/24/2022 | |
| 4.29 | | | | Cheniere | | 10-K | | 4.30 | | 2/24/2022 | |
| 4.30 | | | | Cheniere | | 10-K | | 4.30 | | 2/24/2022 | |
| 4.31 | | | | Cheniere | | 10-K | | 4.32 | | 2/24/2022 | |
| 4.32 | | | | Cheniere | | 10-K | | 4.32 | | 2/24/2022 | |
| 4.33 | | | | Cheniere | | 8-K | | 4.1 | | 9/22/2020 | |
| 4.34 | | | | Cheniere | | 8-K | | 4.2 | | 9/22/2020 | |
| 4.35 | | | | Cheniere | | 8-K | | 4.2 | | 9/22/2020 | |
| 4.36 | | | | Cheniere | | 8-K | | 4.1 | | 3/19/2024 | |
| 4.37 | | | | Cheniere | | 8-K | | 4.2 | | 3/19/2024 | |
| 4.38 | | | | Cheniere | | 8-K | | 4.2 | | 3/19/2024 | |
| 4.39 | | Indenture, dated as of May 18, 2016, among CCH, as Issuer, CCL, CCP and Corpus Christi Pipeline GP, LLC, as Guarantors, and The Bank of New York Mellon, as Trustee | | Cheniere | | 8-K | | 4.1 | | 5/18/2016 | |
| 4.40 | | First Supplemental Indenture, dated as of December 9, 2016, among CCH, as Issuer, CCL, CCP and Corpus Christi Pipeline GP, LLC, as Guarantors, and The Bank of New York Mellon, as Trustee | | Cheniere | | 8-K | | 4.1 | | 12/9/2016 | |
| 4.41 | | Second Supplemental Indenture, dated as of May 19, 2017, among CCH, as issuer, CCL, CCP and Corpus Christi Pipeline GP, LLC, as Guarantors, and The Bank of New York Mellon, as trustee | | CCH | | 8-K | | 4.1 | | 5/19/2017 | |
| | | | | | | | | | | | | | | | | | | | | | | | | | | | | | | | | |
| Exhibit No. | | | | Incorporated by Reference (1) | |
| Description | | Entity | | Form | | Exhibit | | Filing Date | |
| 4.42 | | | | CCH | | 8-K | | 4.1 | | 5/19/2017 | |
| 4.43 | | Third Supplemental Indenture, dated as of September 6, 2019, among CCH, as issuer, CCL, CCP and Corpus Christi Pipeline GP, LLC, as Guarantors, and The Bank of New York Mellon, as Trustee | | CCH | | 8-K | | 4.1 | | 9/12/2019 | |
| 4.44 | | Fourth Supplemental Indenture, dated as of November 13, 2019, among CCH, as issuer, CCL, CCP and Corpus Christi Pipeline GP, LLC, as guarantors, and The Bank of New York Mellon, as trustee | | CCH | | 8-K | | 4.1 | | 11/13/2019 | |
| 4.45 | | | | CCH | | 8-K | | 4.1 | | 11/13/2019 | |
| 4.46 | | Fifth Supplemental Indenture, dated as of August 24, 2021, among CCH, as issuer, CCL, CCP, and Corpus Christi Pipeline GP, LLC, as guarantors, and The Bank of New York Mellon, as trustee | | CCH | | 8-K | | 4.1 | | 8/24/2021 | |
| 4.47 | | | | CCH | | 8-K | | 4.1 | | 8/24/2021 | |
| 4.48 | | Indenture, dated as of August 20, 2020, among CCH, as issuer, and CCL, CCP and Corpus Christi Pipeline GP, LLC, as guarantors, and The Bank of New York Mellon, as trustee | | CCH | | 8-K | | 4.1 | | 8/21/2020 | |
| 4.49 | | | | CCH | | 8-K | | 4.1 | | 8/21/2020 | |
| 4.50 | | Indenture, dated as of September 27, 2019, among CCH, as issuer, and CCL, CCP and Corpus Christi Pipeline GP, LLC, as guarantors, and The Bank of New York Mellon, as trustee | | CCH | | 8-K | | 4.1 | | 9/30/2019 | |
| 4.51 | | | | CCH | | 8-K | | 4.1 | | 9/30/2019 | |
| 4.52 | | Indenture, dated as of October 17, 2019, among CCH, as issuer, and CCL, CCP and Corpus Christi Pipeline GP, LLC, as guarantors, and The Bank of New York Mellon, as trustee | | CCH | | 8-K | | 4.1 | | 10/18/2019 | |
| 4.53 | | | | CCH | | 8-K | | 4.1 | | 10/18/2019 | |
| 4.54 | | | | CQP | | 8-K | | 4.1 | | 9/18/2017 | |
| 4.55 | | | | CQP | | 8-K | | 4.2 | | 9/18/2017 | |
| 4.56 | | | | CQP | | 8-K | | 4.1 | | 9/12/2018 | |
| 4.57 | | | | CQP | | 8-K | | 4.1 | | 9/12/2019 | |
| 4.58 | | | | CQP | | 8-K | | 4.1 | | 9/12/2019 | |
| 4.59 | | | | Cheniere | | 10-Q | | 4.4 | | 11/6/2020 | |
| 4.60 | | | | CQP | | 8-K | | 4.1 | | 3/11/2021 | |
| 4.61 | | | | CQP | | 8-K | | 4.1 | | 3/11/2021 | |
| | | | | | | | | | | | | | | | | | | | | | | | | | | | | | | | | |
| Exhibit No. | | | | Incorporated by Reference (1) | |
| Description | | Entity | | Form | | Exhibit | | Filing Date | |
| 4.62 | | | | CQP | | 8-K | | 4.1 | | 9/27/2021 | |
| 4.63 | | | | CQP | | 8-K | | 4.1 | | 9/27/2021 | |
| 4.64 | | | | CQP | | 8-K | | 4.1 | | 10/1/2021 | |
4.65 | | | | CQP | | 8-K | | 4.1 | | 6/21/2023 | |
4.66 | | | | CQP | | 8-K | | 4.1 | | 6/21/2023 | |
4.67 | | | | CQP | | 8-K | | 4.1 | | 5/22/2024 | |
4.68 | | | | CQP | | 8-K | | 4.1 | | 5/22/2024 | |
4.69* | | | | | | | | | | | |
| 10.1† | | | | Cheniere (SEC No. 333-238261) | | S-8 | | 4.9 | | 5/14/2020 | |
| 10.2† | | | | Cheniere | | 8-K | | 10.1 | | 5/24/2024 | |
| 10.3† | | | | Cheniere | | 10-Q | | 10.1 | | 8/5/2021 | |
| 10.4† | | | | Cheniere | | 10-K | | 10.43 | | 2/23/2023 | |
| 10.5† | | | | Cheniere | | 10-K | | 10.5 | | 2/2/2024 | |
| 10.6† | | | | Cheniere | | 10-K | | 10.46 | | 2/23/2023 | |
| 10.7† | | | | Cheniere | | 10-K | | 10.8 | | 2/22/2024 | |
| 10.8† | | | | Cheniere | | 10-K | | 10.9 | | 2/22/2024 | |
| 10.9† | | | | Cheniere | | 10-K | | 10.46 | | 2/24/2022 | |
| 10.10† | | | | Cheniere | | 10-K | | 10.47 | | 2/24/2022 | |
| 10.11† | | | | Cheniere | | 8-K | | 10.1 | | 5/12/2016 | |
| 10.12† | | | | Cheniere | | 8-K | | 10.1 | | 8/15/2019 | |
| 10.13† | | | | Cheniere | | 8-K | | 10.1 | | 8/13/2021 | |
| 10.14† | | | | Cheniere | | 10-K | | 10.15 | | 2/22/2024 | |
| 10.15† | | | | Cheniere | | 8-K | | 10.2 | | 5/20/2020 | |
| 10.16† | | | | Cheniere | | 8-K | | 10.1 | | 5/20/2020 | |
| | | | | | | | | | | | | | | | | | | | | | | | | | | | | | | | | |
| Exhibit No. | | | | Incorporated by Reference (1) | |
| Description | | Entity | | Form | | Exhibit | | Filing Date | |
| 10.17† | | | | Cheniere | | 8-K | | 10.1 | | 10/3/2024 | |
| 10.18 | | | | SPL (SEC File No. 333-273238) | | S-4 | | 10.46 | | 7/13/2023 | |
| 10.19 | | | | SPL (SEC File No. 333-273238) | | S-4 | | 10.44 | | 7/13/2023 | |
| 10.20 | | | | SPL | | 8-K | | 10.3 | | 3/23/2020 | |
| 10.21 | | | | Cheniere | | 8-K | | 10.1 | | 6/22/2022 | |
| 10.22 | | | | Cheniere | | 10-Q | | 10.4 | | 8/8/2024 | |
| 10.23 | | Second Amended and Restated Common Terms Agreement, dated June 15, 2022, among CCH, CCP, Corpus Christi Pipeline GP, LLC, CCL, Société Générale, as Term Loan Facility Agent, The Bank of Nova Scotia as Working Capital Facility Agent, and Société Générale as Intercreditor Agent, and any other facility lenders party thereto from time to time | | Cheniere | | 8-K | | 10.3 | | 6/22/2022 | |
| 10.24 | | | | Cheniere | | 10-Q | | 10.5 | | 8/8/2024 | |
| 10.25 | | Second Amended and Restated Common Security and Account Agreement, dated June 15, 2022, among CCH, CCP, Corpus Christi Pipeline GP, LLC, CCL, the Senior Creditor Group Representatives, Société Générale as the Intercreditor Agent, Société Générale as Security Trustee and Mizuho Bank, Ltd as the Account Bank | | Cheniere | | 8-K | | 10.4 | | 6/22/2022 | |
| 10.26 | | | | Cheniere | | 10-Q | | 10.6 | | 8/8/2024 | |
| 10.27 | | | | Cheniere | | 8-K | | 10.4 | | 5/24/2018 | |
| 10.28 | | | | Cheniere | | 8-K | | 10.5 | | 5/24/2018 | |
| 10.29 | | Second Amended and Restated Working Capital Facility Agreement, dated June 15, 2022, among CCH, CCP, Corpus Christi Pipeline GP, LLC, CCL, the lenders party thereto from time to time, the issuing banks party thereto from time to time, the swing line lenders party thereto from time to time, The Bank of Nova Scotia as Working Capital Facility Agent and Société Générale as Security Trustee | | Cheniere | | 8-K | | 10.2 | | 6/22/2022 | |
| 10.30 | | | | Cheniere | | 10-Q | | 10.7 | | 8/8/2024 | |
| 10.31 | | | | Cheniere | | 8-K | | 10.1 | | 11/1/2021 | |
| | | | | | | | | | | | | | | | | | | | | | | | | | | | | | | | | |
| Exhibit No. | | | | Incorporated by Reference (1) | |
| Description | | Entity | | Form | | Exhibit | | Filing Date | |
| 10.32 | | | | Cheniere | | 10-Q | | 10.2 | | 8/3/2023 | |
| 10.33 | | | | Cheniere | | 8-K | | 10.1 | | 6/19/2020 | |
| 10.34 | | Credit and Guaranty Agreement, dated as of June 23, 2023, among CQP, as borrower, certain subsidiaries of CQP, as Subsidiary Guarantors, the lenders from time to time party thereto, Société Générale, Natixis, Sumitomo Mitsui Banking Corporation, The Bank of Nova Scotia, and Wells Fargo Bank, as Issuing Banks, MUFG Bank, LTD as Administrative Agent and Coordinating Lead Arranger, and certain arrangers and other participants | | Cheniere | | 10-Q | | 10.4 | | 8/3/2023 | |
| 10.35 | | | | Cheniere | | 10-Q | | 10.1 | | 5/4/2022 | |
| 10.36 | | Change orders to the Lump Sum Turnkey Agreement for the Engineering, Procurement and Construction of the Corpus Christi Liquefaction Stage 3 Project, dated March 1, 2022, by and between CCL Stage III and Bechtel Oil Gas and Chemicals, Inc.: (i) the Change Order CO-00001 Maintaining Elevated Ground Flare Option, dated March 28, 2022, (ii) the Change Order CO-00002 Package 7 Pre-Investment of Trains 8 and 9 (Without Site Work), dated April 29, 2022 and (iii) the Change Order CO-00003 Modifications to Insurance Language, dated June 13, 2022 (Portions of this exhibit have been omitted) | | Cheniere | | 10-Q | | 10.7 | | 8/4/2022 | |
| 10.37 | | Change orders to the Lump Sum Turnkey Agreement for the Engineering, Procurement and Construction of the Corpus Christi Liquefaction Stage 3 Project, dated March 1, 2022, by and between CCL and Bechtel Oil Gas and Chemicals, Inc.: (i) the Change Order CO-00004 Currency Conversion, dated June 27, 2022, (ii) the Change Order CO-00005 Fuel Adjustment, dated July 15, 2022, (iii) the Change Order CO-00006 Removal of Laydown Yard Scope Option, dated August 2, 2022, (iv) the Change Order CO-00007 Removal of Air Bridges Scope Option, dated August 22, 2022, (v) the Change Order CO-00008 Acid Gas Flare K/O Drum, dated August 16, 2022, and (vi) the Change Order CO-00009 Package 7A (Without Site Work), dated August 16, 2022 (Portions of this exhibit have been omitted) | | Cheniere | | 10-Q | | 10.2 | | 11/3/2022 | |
| 10.38 | | | | Cheniere | | 10-K | | 10.96 | | 2/23/2023 | |
| | | | | | | | | | | | | | | | | | | | | | | | | | | | | | | | | |
| Exhibit No. | | | | Incorporated by Reference (1) | |
| Description | | Entity | | Form | | Exhibit | | Filing Date | |
| 10.39 | | Change orders to the Lump Sum Turnkey Agreement for the Engineering, Procurement and Construction of the Corpus Christi Liquefaction Stage 3 Project, dated March 1, 2022, by and between Corpus Christi Liquefaction Stage III, LLC and Bechtel Oil Gas and Chemicals, Inc.: (i) the Change Order CO-00012 Chart License Fee Provisional Sum Closure, dated September 16, 2022, (ii) the Change Order CO-00013 HRU Nozzles and Block Headers, dated September 21, 2022, (iii) the Change Order CO-00014 Addition of Nitrogen Receiver, dated December 13, 2022, (iv) the Change Order CO-00015 Package 6 Feed Gas Pipeline Interfaces, dated December 14, 2022, (v) the Change Order CO-00016 Old Sherwin Building Security, dated November 23, 2022, (vi) the Change Order CO-00017 Remote Monitoring Diagnostic for Mixed Refrigerant (MR) Compressors, dated December 14, 2022, (vii) the Change Order CO-00018 EFG Package #1, dated January 9, 2023, (viii) the Change Order CO-00019 Q3 2022 Commodity Price Rise and Fall (ATT MM), dated January 17, 2023, (ix) the Change Order CO-00020 ICSS Vendor Selection and EPC Warranty (Yokogawa), dated September 21, 2022 and (x) the Change Order CO-00021 Laydown Development Package, dated February 6, 2023 (Portions of this exhibit have been omitted.) | | Cheniere | | 10-Q | | 10.2 | | 5/2/2023 | |
| 10.40 | | Change orders to the Lump Sum Turnkey Agreement for the Engineering, Procurement and Construction of the Corpus Christi Liquefaction Stage 3 Project, dated March 1, 2022, by and between Corpus Christi Liquefaction, LLC and Bechtel Energy, Inc.: (i) the Change Order CO-00022 Refrigerant Storage Packages 1 and 2, dated February 13, 2023, (ii) the Change Order CO-00023 EFG Package #2, dated February 21, 2023, (iii) the Change Order CO-00024 Defrost Improvements (Cold Box), dated February 23, 2023, (iv) the Change Order CO-00025 Miscellaneous Design Improvements, dated February 23, 2023, (v) the Change Order CO-00026 EFG Package #3, dated February 23, 2023, (vi) the Change Order CO-00027 Addition of 86 Lockout Relay on Transformers, dated February 14, 2023, (vii) the Change Order CO-00028 Additional Duct Banks, dated September 15, 2022, (viii) the Change Order CO-00029 2022 FERC Support Hours Interim Adjustment, dated March 13, 2023, (ix) the Change Order CO-00030 Drainage Blanket (A Street), dated April 6, 2023, (x) the Change Order CO-00031 Refrigerant Storage Interface Package #3, dated April 7, 2023, (xi) the Change Order CO-00032 Q4 2022 Commodity Price Rise and Fall (ATT MM), dated April 24, 2023, (xii) the Change Order CO-00033 Lift Owner-Provided Dewar System (Nitrogen Receiver Facility), dated March 1, 2022, (xiii) the Change Order CO-00034 HAZOP Package #1 - Addition of Flame Arrestors for Oil Mist Eliminator Vent, dated April 25, 2023 and (xiv) the Change Order CO-00035 EFG Package #4 (Water Pipeline Pipe Bridge), dated May 19, 2023 (Portions of this exhibit have been omitted.) | | Cheniere | | 10-Q | | 10.1 | | 8/3/2023 | |
| 10.41 | | Change orders to the Lump Sum Turnkey Agreement for the Engineering, Procurement and Construction of the Corpus Christi Liquefaction Stage 3 Project, dated March 1, 2022, by and between CCL and Bechtel Energy, Inc.: (i) the Change Order CO-00036 Payment Milestone Updates (Schedule C-1), dated June 19, 2023, (ii) the Change Order CO-00037 Geotechnical Soils Investigation Period & Security Division of Responsibility Change, dated June 20, 2023, (iii) the Change Order CO-00038 Power Monitoring System (ETAP HMI), dated June 29, 2023 and (iv) the Change Order CO-00039 EFG Firewater Connection, dated June 30, 2023 (Portions of this exhibit have been omitted.) | | Cheniere | | 10-Q | | 10.2 | | 11/2/2023 | |
| | | | | | | | | | | | | | | | | | | | | | | | | | | | | | | | | |
| Exhibit No. | | | | Incorporated by Reference (1) | |
| Description | | Entity | | Form | | Exhibit | | Filing Date | |
| 10.42 | | Change orders to the Lump Sum Turnkey Agreement for the Engineering, Procurement and Construction of the Corpus Christi Liquefaction Stage 3 Project, dated March 1, 2022, by and between CCL and Bechtel Energy, Inc.: (i) the Change Order CO-00040 Q1 2023 Commodity Price Rise and Fall (ATT MM), dated August 29, 2023, (ii) the Change Order CO-00041 Q2 2023 Commodity Price Rise and Fall (ATT MM), dated August 29, 2023, (iii) the Change Order CO-00042 HAZOP Package #2 – Additional IPL (Pressure Transmitter Across the Strainer), dated July 5, 2023, (iv) the Change Order CO-00043 Total Condensate Flowmeter on Three (3) Inch Condensate Line, dated August 31, 2023, (v) the Change Order CO-00044 FERC Package #1 ISA 84 (Accommodation for Two Hundred and Fifty (250) Fire and Gas Detectors), dated August 31, 2023, (vi) the Change Order CO-00045 Increase LNG Rundown Line Check Valve Bypass Size to Six (6) Inches, dated August 31, 2023, (vii) the Change Order CO-00046 Add Manual Bypass Valves Around 31XV-13071, dated September 13, 2023, (viii) the Change Order CO-00047 Relocate Existing 16” Process Water Line and Provide Tie-In, dated September 8, 2023, (ix) the Change Order CO-00048 Future HRU Bypass Tie-In and Thermowell Updates, dated September 12, 2023, (x) the Change Order CO-00049 Butterfly Valves for Flare Drums, dated September 5, 2023, (xi) the Change Order CO-00050 Condensate Shroud on Condensate Rundown Line (Blue Engineering Report), dated September 12, 2023, (xii) the Change Order CO-00051 EFG Package #5 (138KV Feeder Cable), dated September 8, 2023, (xiii) the Change Order CO-00052 Defect Correction Period for Cementitious Fireproofing, dated August 7, 2023, (xiv) the Change Order CO-00053 Chart Transition Joint Spares, dated October 5, 2023, (xv) the Change Order CO-00054 CCL Tank(s) “A” and “C” Tie-In Study & Long Lead Item Purchases, dated September 19, 2023, (xvi) the Change Order CO-00055 FERC Package #2 Firewater Layout, dated September 13, 2023, (xvii) the Change Order CO-00056 HAZOP Package #3 – Stainless Steel C And D Pass Piping / Two Temperature Transmitters per Train, dated February 14, 2023, (xviii) the Change Order CO-00057 HAZOP Package #4 (“Phase Two Items”), dated October 10, 2023, (xix) the Change Order CO-00058 E-HAZOP Package #1 (“LV MCC Ride Through”), dated September 8, 2023, (xx) the Change Order CO-00059 Level Transmitter on Stand Pipe Inside Liquefaction Cold Boxes, dated October 13, 2023, (xxi) the Change Order CO-00060 Small Spill Containment (Additional Curbs), dated July 5, 2023, (xxii) the Change Order CO-00061 Remote Input/Output (RIO) Junction Box Grounding, dated October 10, 2023, (xxiii) the Change Order CO-00062 Geomembrane Liner and Geocell for Laydown 6 Channel, dated August 31, 2023, (xxiv) the Change Order CO-00063 Phased Surfacing of Permanent Plant Roads, dated August 7, 2023, (xxv) the Change Order CO-00064 Provisional Sum Interim Adjustment - Schedule KK-1 12-Month COVID Countermeasures, dated July 24, 2023, (xxvi) the Change Order CO-00065 Modification to FTZ Zone Site (Exhibit A of Attachment LL), dated August 3, 2023, (xxvii) the Change Order CO-00066 Attachment B (Contract Deliverables), dated June 2, 2023, (xxviii) the Change Order CO-00067 Sheet Pile Joint Sealing 310Q02 Sump, dated October 5, 2023, (xxix) the Change Order CO-00068 E-HAZOP Package #2 (“Phase One Items”), dated October 19, 2023, (xxx) the Change Order CO-00069 Package 6 Feed Gas Pipeline and Pig Receiver DMM, dated August 3, 2023, (xxxi) the Change Order CO-00070 Dry Flare Knockout Drum Spill Pad Drain Specification Change, dated October 5, 2023, (xxxii) the Change Order CO-00071 Viewing Platform Piles, dated October 18, 2023, (xxxiii) the Change Order CO-00072 Site Plan Update Package #1 – Re-Route Contractor’S Utility Water & Nitrogen Pipelines and Provide Power & Fiber Cables To Nitrogen Tie-In Point, dated November 2, 2023, (Portions of this exhibit have been omitted.) | | Cheniere | | 10-K | | 10.57 | | 2/22/2024 | |
| | | | | | | | | | | | | | | | | | | | | | | | | | | | | | | | | |
| Exhibit No. | | | | Incorporated by Reference (1) | |
| Description | | Entity | | Form | | Exhibit | | Filing Date | |
| 10.43 | | Change orders to the Lump Sum Turnkey Agreement for the Engineering, Procurement and Construction of the Corpus Christi Liquefaction Stage 3 Project, dated March 1, 2022, by and between CCL and Bechtel Energy, Inc.: (i) the Change Order CO-00073 Amendment to Add Provisional Sums for the Performance and Attendance Bonus (PAB) and Saturday Work Shift Program, dated November 6, 2023, (ii) the Change Order CO-00074 Q3 2023 Commodity Price Rise and Fall Adjustment (Final Attachment MM Adjustment), dated November 6, 2023, (iii) the Change Order CO-00075 Surcharge Fill Material Transportation, dated October 11, 2023, (iv) the Change Order CO-00076 FERC Package #3 Firewall Layout (310R18), dated November 6, 2023, (v) the Change Order CO-00077 Site Plan Update Package #2 - Re-route Heavy Haul Road, dated November 2, 2023, (vi) the Change Order CO-00078 Firewater Loop Interconnect with CCL Stage 1 and CCL Stage 2, dated December 6, 2023, (vii) the Change Order CO-00079 Refrigerant Loading Manifold Design Changes, dated December 6, 2023, (viii) the Change Order CO-00080 CCL Tank(s) “A” and “C” Tie-in Long Lead Item Purchases Package #2, dated January 26, 2024, (ix) the Change Order CO-00081 CCL Tank(s) “A” and “C” Tie-in Bridging Engineering (Through 29-Mar-2024), dated February 8, 2024, (x) the Change Order CO-00082 ISA 84 Owner Requested Changes, dated January 24, 2024, (xi) the Change Order CO-00083 HAZOP Package #5 (“Phase Three Items”), dated October 19, 2023, (xii) the Change Order CO-00084 CCL Tank(s) “A” and “C” Long-Lead Item Purchases Package #3, dated March 4, 2024, (xiii) the Change Order CO-00085 Site Plan Update Package #3 - Fencing, dated January 17, 2024 (Portions of this exhibit have been omitted.) | | Cheniere | | 10-Q | | 10.2 | | 5/3/2024 | |
| 10.44 | | Change orders to the Lump Sum Turnkey Agreement for the Engineering, Procurement and Construction of the Corpus Christi Liquefaction Stage 3 Project, dated March 1, 2022, by and between CCL and Bechtel Energy, Inc.: (i) the Change Order CO-00086 CCL Tanks “A” and “C” Engineering, Procurement and Construction, dated March 15, 2024, (ii) the Change Order CO-00087 HAZOP Package #6 (“Phase Four Items”), dated January 1, 2024, (iii) the Change Order CO-00088 FERC & PHMSA (DOT) Support Hours (Through to Period 24-Dec-2023), dated February 2, 2024, and (iv) the Change Order CO-00089 30PK-3301A/B/C Firewater Pump Protection - Blast Analysis, Design and Calculation Report, dated May 7, 2024 (Portions of this exhibit have been omitted.) | | Cheniere | | 10-Q | | 10.1 | | 8/8/2024 | |
| 10.45 | | Change orders to the Lump Sum Turnkey Agreement for the Engineering, Procurement and Construction of the Corpus Christi Liquefaction Stage 3 Project, dated March 1, 2022, by and between CCL and Bechtel Energy, Inc.: (i) the Change Order CO-00090 30PK-3301 A/B/C Firewater Pump Protection - Detailed Design and Partial Procurement of Blast Resistant Doors, dated June 11, 2024, (ii) the Change Order CO-00091 30PK-3301 A/B/C Firewater Pump Protection - Purchase and Installation of Retrofit Steel, dated July 30, 2024, and (iii) the Change Order CO-00092 Intermediate Work Platform for the Tank(s) “A” and “C” Finger Rack, dated July 31, 2024 (Portions of this exhibit have been omitted.) | | Cheniere | | 10-Q | | 10.2 | | 10/31/2024 | |
| | | | | | | | | | | | | | | | | | | | | | | | | | | | | | | | | |
| Exhibit No. | | | | Incorporated by Reference (1) | |
| Description | | Entity | | Form | | Exhibit | | Filing Date | |
| 10.46* | | Change orders to the Lump Sum Turnkey Agreement for the Engineering, Procurement and Construction of the Corpus Christi Liquefaction Stage 3 Project, dated March 1, 2022, by and between CCL and Bechtel Energy, Inc.: (i) the Change Order CO-00093 Local Temperature Indication at LNG Rundown Line, dated September 23, 2024, (ii) the Change Order CO-00094 Tie-In Connection for Future Isopentane Injection, dated October 21, 2024, (iii) the Change Order CO-00095 Flame Detection Coverage Package #1, dated October 21, 2024, (iv) the Change Order CO-00096 Metering Telemetry in GIS Substation, dated November 13, 2024, (v) the Change Order CO-00097 Sifting and Sorting Operations, dated October 1, 2024, and (vi) the Change Order CO-000-98 Acceleration Program Provisional Sum, dated December 20, 2024 (Portions of this exhibit have been omitted.) | | | | | | | | | |
| 10.47 | | | | CQP | | 8-K | | 10.1 | | 11/21/2011 | |
| 10.48 | | | | CQP | | 10-Q | | 10.1 | | 5/3/2013 | |
| 10.49 | | | | SPL (SEC File No. 333-215882) | | S-4 | | 10.3 | | 2/3/2017 | |
| 10.50 | | | | Cheniere | | 10-Q | | 10.13 | | 8/3/2023 | |
| 10.51 | | | | CQP | | 8-K | | 10.1 | | 1/26/2012 | |
| 10.52 | | | | Cheniere | | 10-Q | | 10.10 | | 8/3/2023 | |
| 10.53 | | | | Cheniere | | 8-K | | 10.1 | | 6/2/2014 | |
| 10.54 | | | | Cheniere | | 10-Q | | 10.6 | | 5/4/2018 | |
| 10.55 | | | | Cheniere | | 10-Q | | 10.9 | | 8/3/2023 | |
| 10.56 | | | | Cheniere | | 10-Q | | 10.7 | | 11/6/2007 | |
| 10.57 | | | | CQP | | 8-K | | 10.1 | | 8/6/2012 | |
| | | | | | | | | | | | | | | | | | | | | | | | | | | | | | | | | |
| Exhibit No. | | | | Incorporated by Reference (1) | |
| Description | | Entity | | Form | | Exhibit | | Filing Date | |
| 10.58 | | | | CQP | | 8-K | | 3.1 | | 2/21/2017 | |
| 10.59 | | | | Cheniere Holdings | | 8-K | | 10.3 | | 12/18/2013 | |
| 14.1 | | | | Cheniere | | 8-K | | 14.1 | | 11/19/2024 | |
| 19* | | | | | | | | | | | |
| 21.1* | | | | | | | | | | | |
| 23.1* | | | | | | | | | | | |
| 31.1* | | | | | | | | | | | |
| 31.2* | | | | | | | | | | | |
| 32.1** | | | | | | | | | | | |
| 32.2** | | | | | | | | | | | |
| 97 | | | | Cheniere | | 10-K | | 97 | | 2/22/2024 | |
| 101.INS* | | XBRL Instance Document | | | | | | | | | |
| 101.SCH* | | XBRL Taxonomy Extension Schema Document | | | | | | | | | |
| 101.CAL* | | XBRL Taxonomy Extension Calculation Linkbase Document | | | | | | | | | |
| 101.DEF* | | XBRL Taxonomy Extension Definition Linkbase Document | | | | | | | | | |
| 101.LAB* | | XBRL Taxonomy Extension Labels Linkbase Document | | | | | | | | | |
| 101.PRE* | | XBRL Taxonomy Extension Presentation Linkbase Document | | | | | | | | | |
| 104* | | Cover Page Interactive Data File (formatted as Inline XBRL and contained in Exhibit 101) | | | | | | | | | |
| | | | | |
| (1) | Exhibits are incorporated by reference to reports of Cheniere (SEC File No. 001-16383), CQP (SEC File No. 001-33366), Cheniere Energy Partners LP Holdings, LLC (“Cheniere Holdings”) (SEC File No. 001-36234), SPL (SEC File No. 333-192373), CCH (SEC File No. 333-215435) and SPLNG (SEC File No. 333-138916), as applicable, unless otherwise indicated. |
| * | Filed herewith. |
| ** | Furnished herewith. |
| † | Management contract or compensatory plan or arrangement. |
ITEM 16. FORM 10-K SUMMARY
None.
Pursuant to the requirements of Section 13 or 15(d) of the Securities Exchange Act of 1934, the registrant has duly caused this report to be signed on its behalf by the undersigned, thereunto duly authorized.
| | | | | | | | | | | |
| | CHENIERE ENERGY, INC. |
| | (Registrant) |
| | | |
| | By: | /s/ Jack A. Fusco |
| | | Jack A. Fusco |
| | | President and Chief Executive Officer
(Principal Executive Officer) |
| | Date: | February 19, 2025 |
| | | |
| | | |
| | | |
| | | |
| | | |
| | | |
| | | |
| | | |
| | | |
| | | |
Pursuant to the requirements of the Securities Exchange Act of 1934, this report has been signed below by the following persons on behalf of the registrant and in the capacities and on the dates indicated.
| | | | | | | | |
| Signature | Title | Date |
| | |
| | |
| /s/ Jack A. Fusco | President and Chief Executive Officer and Director (Principal Executive Officer) | February 19, 2025 |
| Jack A. Fusco | |
| | |
| /s/ Zach Davis | Executive Vice President and Chief Financial Officer (Principal Financial Officer) | February 19, 2025 |
| Zach Davis | |
| | |
| /s/ David Slack | Senior Vice President and Chief Accounting Officer
(Principal Accounting Officer) | February 19, 2025 |
| David Slack | |
| | |
| /s/ G. Andrea Botta | Chairman of the Board | February 19, 2025 |
| G. Andrea Botta | | |
| | |
| /s/ Patricia K. Collawn | Director | February 19, 2025 |
| Patricia K. Collawn | | |
| | |
| | |
| | |
| | |
| /s/ Brian E. Edwards | Director | February 19, 2025 |
| Brian E. Edwards | | |
| | |
| /s/ Denise Gray | Director | February 19, 2025 |
| Denise Gray | | |
| | |
| /s/ Lorraine Mitchelmore | Director | February 19, 2025 |
| Lorraine Mitchelmore | | |
| | |
| /s/ W. Benjamin Moreland | Director | February 19, 2025 |
| W. Benjamin Moreland | | |
| | |
| /s/ Scott Peak | Director | February 19, 2025 |
| Scott Peak | | |
| | |
| /s/ Donald F. Robillard, Jr. | Director | February 19, 2025 |
| Donald F. Robillard, Jr. | | |
| | |
| | |
| | |
| | |
| /s/ Neal A. Shear | Director | February 19, 2025 |
| Neal A. Shear | | |
| | |
| | |
| | |