0000003570false--12-312021FY11one yearP1YP2YP3YP4YP2YP3YP4YP3YP3YP3Y00000035702021-01-012021-12-3100000035702021-06-30iso4217:USD00000035702022-02-18xbrli:shares0000003570lng:SPACustomersMember2021-01-012021-12-310000003570lng:LiquefiedNaturalGasMember2021-01-012021-12-310000003570lng:LiquefiedNaturalGasMember2020-01-012020-12-310000003570lng:LiquefiedNaturalGasMember2019-01-012019-12-310000003570lng:RegasificationServiceMember2021-01-012021-12-310000003570lng:RegasificationServiceMember2020-01-012020-12-310000003570lng:RegasificationServiceMember2019-01-012019-12-310000003570us-gaap:ProductAndServiceOtherMember2021-01-012021-12-310000003570us-gaap:ProductAndServiceOtherMember2020-01-012020-12-310000003570us-gaap:ProductAndServiceOtherMember2019-01-012019-12-3100000035702020-01-012020-12-3100000035702019-01-012019-12-31iso4217:USDxbrli:shares00000035702021-12-3100000035702020-12-310000003570lng:CheniereEnergyPartnersLPMember2021-12-310000003570us-gaap:CommonStockMember2018-12-310000003570us-gaap:TreasuryStockMember2018-12-310000003570us-gaap:AdditionalPaidInCapitalMember2018-12-310000003570us-gaap:RetainedEarningsMember2018-12-310000003570us-gaap:NoncontrollingInterestMember2018-12-3100000035702018-12-310000003570us-gaap:CommonStockMember2019-01-012019-12-310000003570us-gaap:TreasuryStockMember2019-01-012019-12-310000003570us-gaap:AdditionalPaidInCapitalMember2019-01-012019-12-310000003570us-gaap:RetainedEarningsMember2019-01-012019-12-310000003570us-gaap:NoncontrollingInterestMember2019-01-012019-12-310000003570us-gaap:CommonStockMember2019-12-310000003570us-gaap:TreasuryStockMember2019-12-310000003570us-gaap:AdditionalPaidInCapitalMember2019-12-310000003570us-gaap:RetainedEarningsMember2019-12-310000003570us-gaap:NoncontrollingInterestMember2019-12-3100000035702019-12-310000003570us-gaap:CommonStockMember2020-01-012020-12-310000003570us-gaap:TreasuryStockMember2020-01-012020-12-310000003570us-gaap:AdditionalPaidInCapitalMember2020-01-012020-12-310000003570us-gaap:RetainedEarningsMember2020-01-012020-12-310000003570us-gaap:NoncontrollingInterestMember2020-01-012020-12-310000003570us-gaap:CommonStockMember2020-12-310000003570us-gaap:TreasuryStockMember2020-12-310000003570us-gaap:AdditionalPaidInCapitalMember2020-12-310000003570us-gaap:RetainedEarningsMember2020-12-310000003570us-gaap:NoncontrollingInterestMember2020-12-310000003570us-gaap:CommonStockMember2021-01-012021-12-310000003570us-gaap:TreasuryStockMember2021-01-012021-12-310000003570us-gaap:AdditionalPaidInCapitalMember2021-01-012021-12-310000003570us-gaap:RetainedEarningsMember2021-01-012021-12-310000003570us-gaap:NoncontrollingInterestMember2021-01-012021-12-310000003570us-gaap:CommonStockMember2021-12-310000003570us-gaap:TreasuryStockMember2021-12-310000003570us-gaap:AdditionalPaidInCapitalMember2021-12-310000003570us-gaap:RetainedEarningsMember2021-12-310000003570us-gaap:NoncontrollingInterestMember2021-12-31lng:unit0000003570lng:SabinePassLNGTerminalMember2021-01-012021-12-31lng:trainslng:milliontonnesutr:Ylng:item0000003570lng:CreoleTrailPipelineMember2021-01-012021-12-31utr:mi0000003570lng:CheniereEnergyPartnersLPMember2021-01-012021-12-31xbrli:pure0000003570lng:CorpusChristiLNGTerminalMember2021-01-012021-12-310000003570lng:CorpusChristiPipelineMember2021-01-012021-12-310000003570lng:CorpusChristiLNGTerminalExpansionMembersrt:MaximumMember2021-01-012021-12-310000003570lng:CorpusChristiLNGTerminalExpansionMember2021-01-012021-12-310000003570lng:SabinePassLNGLPMemberlng:TUACustomersMemberus-gaap:CustomerConcentrationRiskMember2021-01-012021-12-310000003570lng:SabinePassLNGTerminalMember2021-12-310000003570srt:MaximumMemberlng:SabinePassLNGTerminalMember2021-12-310000003570lng:CreoleTrailPipelineMember2021-12-310000003570lng:CorpusChristiPipelineMember2021-12-310000003570lng:A2045ConvertibleSeniorNotesMember2021-12-310000003570us-gaap:AccountingStandardsUpdate202006Memberlng:A2045ConvertibleSeniorNotesMember2021-12-310000003570lng:SPLProjectMember2021-12-310000003570lng:SPLProjectMember2020-12-310000003570lng:CCLProjectMember2021-12-310000003570lng:CCLProjectMember2020-12-310000003570lng:SubsidiaryCashMember2021-12-310000003570lng:SubsidiaryCashMember2020-12-310000003570lng:SabinePassLiquefactionAndCorpusChristiLiquefactionMember2021-12-310000003570lng:SabinePassLiquefactionAndCorpusChristiLiquefactionMember2020-12-310000003570lng:CheniereMarketingLLCMember2021-12-310000003570lng:CheniereMarketingLLCMember2020-12-310000003570lng:MaterialsInventoryMember2021-12-310000003570lng:MaterialsInventoryMember2020-12-310000003570lng:LiquefiedNaturalGasInTransitInventoryMember2021-12-310000003570lng:LiquefiedNaturalGasInTransitInventoryMember2020-12-310000003570lng:LiquefiedNaturalGasInventoryMember2021-12-310000003570lng:LiquefiedNaturalGasInventoryMember2020-12-310000003570lng:NaturalGasInventoryMember2021-12-310000003570lng:NaturalGasInventoryMember2020-12-310000003570lng:OtherInventoryMember2021-12-310000003570lng:OtherInventoryMember2020-12-310000003570lng:LngTerminalMember2021-12-310000003570lng:LngTerminalMember2020-12-310000003570lng:LngSiteAndRelatedCostsNetMember2021-12-310000003570lng:LngSiteAndRelatedCostsNetMember2020-12-310000003570us-gaap:ConstructionInProgressMember2021-12-310000003570us-gaap:ConstructionInProgressMember2020-12-310000003570lng:LngTerminalCostsMember2021-12-310000003570lng:LngTerminalCostsMember2020-12-310000003570us-gaap:OfficeEquipmentMember2021-12-310000003570us-gaap:OfficeEquipmentMember2020-12-310000003570us-gaap:FurnitureAndFixturesMember2021-12-310000003570us-gaap:FurnitureAndFixturesMember2020-12-310000003570us-gaap:SoftwareAndSoftwareDevelopmentCostsMember2021-12-310000003570us-gaap:SoftwareAndSoftwareDevelopmentCostsMember2020-12-310000003570us-gaap:LeaseholdImprovementsMember2021-12-310000003570us-gaap:LeaseholdImprovementsMember2020-12-310000003570us-gaap:LandMember2021-12-310000003570us-gaap:LandMember2020-12-310000003570us-gaap:OtherCapitalizedPropertyPlantAndEquipmentMember2021-12-310000003570us-gaap:OtherCapitalizedPropertyPlantAndEquipmentMember2020-12-310000003570lng:FixedAssetsMember2021-12-310000003570lng:FixedAssetsMember2020-12-310000003570us-gaap:AssetsHeldUnderCapitalLeasesMember2021-12-310000003570us-gaap:AssetsHeldUnderCapitalLeasesMember2020-12-310000003570srt:MinimumMember2021-01-012021-12-310000003570srt:MaximumMember2021-01-012021-12-310000003570lng:LNGStorageTanksMember2021-01-012021-12-310000003570us-gaap:PipelinesMember2021-01-012021-12-310000003570lng:MarineBerthElectricalFacilityAndRoadsMember2021-01-012021-12-310000003570lng:WaterPipelinesMember2021-01-012021-12-310000003570lng:RegasificationProcessingEquipmentRecondensersVaporizationAndVentsMember2021-01-012021-12-310000003570lng:SendoutPumpsMember2021-01-012021-12-310000003570srt:MinimumMemberlng:LiquefactionProcessingEquipmentMember2021-01-012021-12-310000003570lng:LiquefactionProcessingEquipmentMembersrt:MaximumMember2021-01-012021-12-310000003570us-gaap:OtherEnergyEquipmentMembersrt:MinimumMember2021-01-012021-12-310000003570us-gaap:OtherEnergyEquipmentMembersrt:MaximumMember2021-01-012021-12-310000003570us-gaap:FairValueInputsLevel1Memberlng:CCHInterestRateDerivativesMember2021-12-310000003570us-gaap:FairValueInputsLevel2Memberlng:CCHInterestRateDerivativesMember2021-12-310000003570us-gaap:FairValueInputsLevel3Memberlng:CCHInterestRateDerivativesMember2021-12-310000003570lng:CCHInterestRateDerivativesMember2021-12-310000003570us-gaap:FairValueInputsLevel1Memberlng:CCHInterestRateDerivativesMember2020-12-310000003570us-gaap:FairValueInputsLevel2Memberlng:CCHInterestRateDerivativesMember2020-12-310000003570us-gaap:FairValueInputsLevel3Memberlng:CCHInterestRateDerivativesMember2020-12-310000003570lng:CCHInterestRateDerivativesMember2020-12-310000003570us-gaap:FairValueInputsLevel1Memberus-gaap:PriceRiskDerivativeMember2021-12-310000003570us-gaap:PriceRiskDerivativeMemberus-gaap:FairValueInputsLevel2Member2021-12-310000003570us-gaap:PriceRiskDerivativeMemberus-gaap:FairValueInputsLevel3Member2021-12-310000003570us-gaap:PriceRiskDerivativeMember2021-12-310000003570us-gaap:FairValueInputsLevel1Memberus-gaap:PriceRiskDerivativeMember2020-12-310000003570us-gaap:PriceRiskDerivativeMemberus-gaap:FairValueInputsLevel2Member2020-12-310000003570us-gaap:PriceRiskDerivativeMemberus-gaap:FairValueInputsLevel3Member2020-12-310000003570us-gaap:PriceRiskDerivativeMember2020-12-310000003570us-gaap:FairValueInputsLevel1Memberlng:LNGTradingDerivativeMember2021-12-310000003570lng:LNGTradingDerivativeMemberus-gaap:FairValueInputsLevel2Member2021-12-310000003570lng:LNGTradingDerivativeMemberus-gaap:FairValueInputsLevel3Member2021-12-310000003570lng:LNGTradingDerivativeMember2021-12-310000003570us-gaap:FairValueInputsLevel1Memberlng:LNGTradingDerivativeMember2020-12-310000003570lng:LNGTradingDerivativeMemberus-gaap:FairValueInputsLevel2Member2020-12-310000003570lng:LNGTradingDerivativeMemberus-gaap:FairValueInputsLevel3Member2020-12-310000003570lng:LNGTradingDerivativeMember2020-12-310000003570us-gaap:FairValueInputsLevel1Memberus-gaap:ForeignExchangeContractMember2021-12-310000003570us-gaap:FairValueInputsLevel2Memberus-gaap:ForeignExchangeContractMember2021-12-310000003570us-gaap:FairValueInputsLevel3Memberus-gaap:ForeignExchangeContractMember2021-12-310000003570us-gaap:ForeignExchangeContractMember2021-12-310000003570us-gaap:FairValueInputsLevel1Memberus-gaap:ForeignExchangeContractMember2020-12-310000003570us-gaap:FairValueInputsLevel2Memberus-gaap:ForeignExchangeContractMember2020-12-310000003570us-gaap:FairValueInputsLevel3Memberus-gaap:ForeignExchangeContractMember2020-12-310000003570us-gaap:ForeignExchangeContractMember2020-12-310000003570us-gaap:FairValueInputsLevel3Memberlng:PhysicalLiquefactionSupplyDerivativesMember2021-12-310000003570us-gaap:MarketApproachValuationTechniqueMembersrt:MinimumMemberus-gaap:FairValueInputsLevel3Memberlng:PhysicalLiquefactionSupplyDerivativesMember2021-01-012021-12-310000003570us-gaap:MarketApproachValuationTechniqueMemberus-gaap:FairValueInputsLevel3Membersrt:MaximumMemberlng:PhysicalLiquefactionSupplyDerivativesMember2021-01-012021-12-310000003570us-gaap:MarketApproachValuationTechniqueMemberus-gaap:FairValueInputsLevel3Memberlng:PhysicalLiquefactionSupplyDerivativesMembersrt:WeightedAverageMember2021-01-012021-12-310000003570srt:MinimumMemberus-gaap:FairValueInputsLevel3Memberlng:PhysicalLiquefactionSupplyDerivativesMemberus-gaap:ValuationTechniqueOptionPricingModelMember2021-01-012021-12-310000003570us-gaap:FairValueInputsLevel3Membersrt:MaximumMemberlng:PhysicalLiquefactionSupplyDerivativesMemberus-gaap:ValuationTechniqueOptionPricingModelMember2021-01-012021-12-310000003570us-gaap:FairValueInputsLevel3Memberlng:PhysicalLiquefactionSupplyDerivativesMembersrt:WeightedAverageMemberus-gaap:ValuationTechniqueOptionPricingModelMember2021-01-012021-12-310000003570lng:PhysicalLiquefactionSupplyDerivativesAndPhysicalLNGTradingDerivativeMember2020-12-310000003570lng:PhysicalLiquefactionSupplyDerivativesAndPhysicalLNGTradingDerivativeMember2019-12-310000003570lng:PhysicalLiquefactionSupplyDerivativesAndPhysicalLNGTradingDerivativeMember2018-12-310000003570lng:PhysicalLiquefactionSupplyDerivativesAndPhysicalLNGTradingDerivativeMember2021-01-012021-12-310000003570lng:PhysicalLiquefactionSupplyDerivativesAndPhysicalLNGTradingDerivativeMember2020-01-012020-12-310000003570lng:PhysicalLiquefactionSupplyDerivativesAndPhysicalLNGTradingDerivativeMember2019-01-012019-12-310000003570lng:PhysicalLiquefactionSupplyDerivativesAndPhysicalLNGTradingDerivativeMember2021-12-310000003570us-gaap:InterestRateContractMember2021-01-012021-12-310000003570lng:CCHInterestRateDerivativesMember2021-01-012021-12-310000003570us-gaap:GainLossOnDerivativeInstrumentsMemberlng:CCHInterestRateDerivativesMember2021-01-012021-12-310000003570us-gaap:GainLossOnDerivativeInstrumentsMemberlng:CCHInterestRateDerivativesMember2020-01-012020-12-310000003570us-gaap:GainLossOnDerivativeInstrumentsMemberlng:CCHInterestRateDerivativesMember2019-01-012019-12-310000003570us-gaap:GainLossOnDerivativeInstrumentsMemberlng:CCHInterestRateForwardStartDerivativesMember2021-01-012021-12-310000003570us-gaap:GainLossOnDerivativeInstrumentsMemberlng:CCHInterestRateForwardStartDerivativesMember2020-01-012020-12-310000003570us-gaap:GainLossOnDerivativeInstrumentsMemberlng:CCHInterestRateForwardStartDerivativesMember2019-01-012019-12-310000003570srt:MaximumMemberlng:PhysicalLiquefactionSupplyDerivativesMember2021-01-012021-12-310000003570lng:FinancialLiquefactionSupplyDerivativesMembersrt:MaximumMember2021-01-012021-12-310000003570lng:LNGTradingDerivativeMembersrt:MaximumMember2021-01-012021-12-310000003570us-gaap:CommodityContractMember2021-01-012021-12-31lng:tbtu0000003570lng:LNGTradingDerivativeMemberus-gaap:SalesMember2021-01-012021-12-310000003570lng:LNGTradingDerivativeMemberus-gaap:SalesMember2020-01-012020-12-310000003570lng:LNGTradingDerivativeMemberus-gaap:SalesMember2019-01-012019-12-310000003570lng:LNGTradingDerivativeMemberus-gaap:CostOfSalesMember2021-01-012021-12-310000003570lng:LNGTradingDerivativeMemberus-gaap:CostOfSalesMember2020-01-012020-12-310000003570lng:LNGTradingDerivativeMemberus-gaap:CostOfSalesMember2019-01-012019-12-310000003570us-gaap:PriceRiskDerivativeMemberus-gaap:SalesMember2021-01-012021-12-310000003570us-gaap:PriceRiskDerivativeMemberus-gaap:SalesMember2020-01-012020-12-310000003570us-gaap:PriceRiskDerivativeMemberus-gaap:SalesMember2019-01-012019-12-310000003570us-gaap:PriceRiskDerivativeMemberus-gaap:CostOfSalesMember2021-01-012021-12-310000003570us-gaap:PriceRiskDerivativeMemberus-gaap:CostOfSalesMember2020-01-012020-12-310000003570us-gaap:PriceRiskDerivativeMemberus-gaap:CostOfSalesMember2019-01-012019-12-310000003570srt:MaximumMemberus-gaap:ForeignExchangeContractMember2021-01-012021-12-310000003570us-gaap:ForeignExchangeContractMember2021-01-012021-12-310000003570us-gaap:SalesMemberus-gaap:ForeignExchangeContractMember2021-01-012021-12-310000003570us-gaap:SalesMemberus-gaap:ForeignExchangeContractMember2020-01-012020-12-310000003570us-gaap:SalesMemberus-gaap:ForeignExchangeContractMember2019-01-012019-12-310000003570us-gaap:DerivativeFinancialInstrumentsAssetsMemberlng:CCHInterestRateDerivativesMember2021-12-310000003570us-gaap:DerivativeFinancialInstrumentsAssetsMemberus-gaap:PriceRiskDerivativeMember2021-12-310000003570us-gaap:DerivativeFinancialInstrumentsAssetsMemberlng:LNGTradingDerivativeMember2021-12-310000003570us-gaap:DerivativeFinancialInstrumentsAssetsMemberus-gaap:ForeignExchangeContractMember2021-12-310000003570us-gaap:DerivativeFinancialInstrumentsAssetsMember2021-12-310000003570lng:NoncurrentDerivativeAssetsMemberlng:CCHInterestRateDerivativesMember2021-12-310000003570us-gaap:PriceRiskDerivativeMemberlng:NoncurrentDerivativeAssetsMember2021-12-310000003570lng:LNGTradingDerivativeMemberlng:NoncurrentDerivativeAssetsMember2021-12-310000003570lng:NoncurrentDerivativeAssetsMemberus-gaap:ForeignExchangeContractMember2021-12-310000003570lng:NoncurrentDerivativeAssetsMember2021-12-310000003570us-gaap:DerivativeFinancialInstrumentsLiabilitiesMemberlng:CCHInterestRateDerivativesMember2021-12-310000003570us-gaap:PriceRiskDerivativeMemberus-gaap:DerivativeFinancialInstrumentsLiabilitiesMember2021-12-310000003570lng:LNGTradingDerivativeMemberus-gaap:DerivativeFinancialInstrumentsLiabilitiesMember2021-12-310000003570us-gaap:DerivativeFinancialInstrumentsLiabilitiesMemberus-gaap:ForeignExchangeContractMember2021-12-310000003570us-gaap:DerivativeFinancialInstrumentsLiabilitiesMember2021-12-310000003570lng:NoncurrentDerivativeLiabilitiesMemberlng:CCHInterestRateDerivativesMember2021-12-310000003570lng:NoncurrentDerivativeLiabilitiesMemberus-gaap:PriceRiskDerivativeMember2021-12-310000003570lng:NoncurrentDerivativeLiabilitiesMemberlng:LNGTradingDerivativeMember2021-12-310000003570lng:NoncurrentDerivativeLiabilitiesMemberus-gaap:ForeignExchangeContractMember2021-12-310000003570lng:NoncurrentDerivativeLiabilitiesMember2021-12-310000003570us-gaap:DerivativeFinancialInstrumentsAssetsMemberlng:CCHInterestRateDerivativesMember2020-12-310000003570us-gaap:DerivativeFinancialInstrumentsAssetsMemberus-gaap:PriceRiskDerivativeMember2020-12-310000003570us-gaap:DerivativeFinancialInstrumentsAssetsMemberlng:LNGTradingDerivativeMember2020-12-310000003570us-gaap:DerivativeFinancialInstrumentsAssetsMemberus-gaap:ForeignExchangeContractMember2020-12-310000003570us-gaap:DerivativeFinancialInstrumentsAssetsMember2020-12-310000003570lng:NoncurrentDerivativeAssetsMemberlng:CCHInterestRateDerivativesMember2020-12-310000003570us-gaap:PriceRiskDerivativeMemberlng:NoncurrentDerivativeAssetsMember2020-12-310000003570lng:LNGTradingDerivativeMemberlng:NoncurrentDerivativeAssetsMember2020-12-310000003570lng:NoncurrentDerivativeAssetsMemberus-gaap:ForeignExchangeContractMember2020-12-310000003570lng:NoncurrentDerivativeAssetsMember2020-12-310000003570us-gaap:DerivativeFinancialInstrumentsLiabilitiesMemberlng:CCHInterestRateDerivativesMember2020-12-310000003570us-gaap:PriceRiskDerivativeMemberus-gaap:DerivativeFinancialInstrumentsLiabilitiesMember2020-12-310000003570lng:LNGTradingDerivativeMemberus-gaap:DerivativeFinancialInstrumentsLiabilitiesMember2020-12-310000003570us-gaap:DerivativeFinancialInstrumentsLiabilitiesMemberus-gaap:ForeignExchangeContractMember2020-12-310000003570us-gaap:DerivativeFinancialInstrumentsLiabilitiesMember2020-12-310000003570lng:NoncurrentDerivativeLiabilitiesMemberlng:CCHInterestRateDerivativesMember2020-12-310000003570lng:NoncurrentDerivativeLiabilitiesMemberus-gaap:PriceRiskDerivativeMember2020-12-310000003570lng:NoncurrentDerivativeLiabilitiesMemberlng:LNGTradingDerivativeMember2020-12-310000003570lng:NoncurrentDerivativeLiabilitiesMemberus-gaap:ForeignExchangeContractMember2020-12-310000003570lng:NoncurrentDerivativeLiabilitiesMember2020-12-310000003570lng:CCHInterestRateDerivativeAssetMember2021-12-310000003570lng:PriceRiskDerivativeAssetMember2021-12-310000003570lng:LNGTradingDerivativeAssetMember2021-12-310000003570lng:ForeignExchangeContractAssetMember2021-12-310000003570lng:CCHInterestRateDerivativeLiabilityMember2021-12-310000003570lng:PriceRiskDerivativeLiabilityMember2021-12-310000003570lng:LNGTradingDerivativesLiabilityMember2021-12-310000003570lng:ForeignExchangeContractLiabilityMember2021-12-310000003570lng:CCHInterestRateDerivativeAssetMember2020-12-310000003570lng:PriceRiskDerivativeAssetMember2020-12-310000003570lng:LNGTradingDerivativeAssetMember2020-12-310000003570lng:ForeignExchangeContractAssetMember2020-12-310000003570lng:CCHInterestRateDerivativeLiabilityMember2020-12-310000003570lng:PriceRiskDerivativeLiabilityMember2020-12-310000003570lng:LNGTradingDerivativesLiabilityMember2020-12-310000003570lng:ForeignExchangeContractLiabilityMember2020-12-310000003570lng:MidshipHoldingsLLCMember2021-01-012021-12-310000003570lng:MidshipHoldingsLLCMember2020-01-012020-12-310000003570lng:MidshipHoldingsLLCMember2019-01-012019-12-310000003570lng:MidshipHoldingsLLCMember2021-12-310000003570lng:MidshipHoldingsLLCMember2020-12-310000003570lng:CheniereEnergyPartnersLPMemberlng:CommonUnitsMember2021-12-310000003570lng:ClassBUnitsMemberlng:CheniereEnergyPartnersLPMemberlng:BlackstoneCqpHoldcoLpMember2012-01-012012-12-310000003570lng:CheniereEnergyPartnersGPLLCMemberlng:BlackstoneCqpHoldcoLpMember2021-01-012021-12-310000003570lng:CheniereEnergyPartnersGPLLCMemberlng:CheniereEnergyIncMember2021-01-012021-12-310000003570lng:CheniereEnergyPartnersGPLLCMemberlng:BlackstoneCQPHoldcoLPAndCheniereEnergyIncMember2021-01-012021-12-310000003570lng:BlackstoneCqpHoldcoLpMember2021-01-012021-12-310000003570lng:CheniereEnergyPartnersLPMemberlng:BlackstoneCqpHoldcoLpMemberlng:DirectorAppointmentEntitlementMinimumMember2021-01-012021-12-310000003570lng:CheniereEnergyPartnersLPMember2021-01-012021-12-310000003570lng:CheniereEnergyPartnersLPMember2020-12-310000003570lng:A2022SabinePassLiquefactionSeniorNotesMember2021-12-310000003570lng:A2022SabinePassLiquefactionSeniorNotesMember2020-12-310000003570lng:A2023SabinePassLiquefactionSeniorNotesMember2021-12-310000003570lng:A2023SabinePassLiquefactionSeniorNotesMember2020-12-310000003570lng:A2024SabinePassLiquefactionSeniorNotesMember2021-12-310000003570lng:A2024SabinePassLiquefactionSeniorNotesMember2020-12-310000003570lng:A2025SabinePassLiquefactionSeniorNotesMember2021-12-310000003570lng:A2025SabinePassLiquefactionSeniorNotesMember2020-12-310000003570lng:A2026SabinePassLiquefactionSeniorNotesMember2021-12-310000003570lng:A2026SabinePassLiquefactionSeniorNotesMember2020-12-310000003570lng:A2027SabinePassLiquefactionSeniorNotesMember2021-12-310000003570lng:A2027SabinePassLiquefactionSeniorNotesMember2020-12-310000003570lng:A2028SabinePassLiquefactionSeniorNotesMember2021-12-310000003570lng:A2028SabinePassLiquefactionSeniorNotesMember2020-12-310000003570lng:A2030SabinePassLiquefactionSeniorNotesMember2021-12-310000003570lng:A2030SabinePassLiquefactionSeniorNotesMember2020-12-310000003570lng:A2037SabinePassLiquefactionNotesMembersrt:WeightedAverageMember2021-12-310000003570lng:A2037SabinePassLiquefactionNotesMember2021-12-310000003570lng:A2037SabinePassLiquefactionNotesMember2020-12-310000003570lng:SabinePassLiquefactionSeniorNotesMember2021-12-310000003570lng:SabinePassLiquefactionSeniorNotesMember2020-12-310000003570lng:A2020SPLWorkingCapitalFacilityMember2021-12-310000003570lng:A2020SPLWorkingCapitalFacilityMember2020-12-310000003570lng:SabinePassLiquefactionMember2021-12-310000003570lng:SabinePassLiquefactionMember2020-12-310000003570lng:A2025CheniereEnergyPartnersSeniorNotesMember2021-12-310000003570lng:A2025CheniereEnergyPartnersSeniorNotesMember2020-12-310000003570lng:A2026CheniereEnergyPartnersSeniorNotesMember2021-12-310000003570lng:A2026CheniereEnergyPartnersSeniorNotesMember2020-12-310000003570lng:A2029CheniereEnergyPartnersSeniorNotesMember2021-12-310000003570lng:A2029CheniereEnergyPartnersSeniorNotesMember2020-12-310000003570lng:A2031CheniereEnergyPartnersSeniorNotesMember2021-12-310000003570lng:A2031CheniereEnergyPartnersSeniorNotesMember2020-12-310000003570lng:A2032CheniereEnergyPartnersSeniorNotesMember2021-12-310000003570lng:A2032CheniereEnergyPartnersSeniorNotesMember2020-12-310000003570lng:CheniereEnergyPartnersSeniorNotesMember2021-12-310000003570lng:CheniereEnergyPartnersSeniorNotesMember2020-12-310000003570lng:A2019CQPCreditFacilitiesMember2021-12-310000003570lng:A2019CQPCreditFacilitiesMember2020-12-310000003570lng:A2024CorpusChristiHoldingsSeniorNotesMember2021-12-310000003570lng:A2024CorpusChristiHoldingsSeniorNotesMember2020-12-310000003570lng:A2025CorpusChristiHoldingsSeniorNotesMember2021-12-310000003570lng:A2025CorpusChristiHoldingsSeniorNotesMember2020-12-310000003570lng:A2027CorpusChristiHoldingsSeniorNotesMember2021-12-310000003570lng:A2027CorpusChristiHoldingsSeniorNotesMember2020-12-310000003570lng:A2029CorpusChristiHoldingsSeniorNotesMember2021-12-310000003570lng:A2029CorpusChristiHoldingsSeniorNotesMember2020-12-310000003570lng:A2039CorpusChristiHoldingsSeniorNotesMembersrt:WeightedAverageMember2021-12-310000003570lng:A2039CorpusChristiHoldingsSeniorNotesMember2021-12-310000003570lng:A2039CorpusChristiHoldingsSeniorNotesMember2020-12-310000003570lng:CorpusChristiHoldingsSeniorNotesMember2021-12-310000003570lng:CorpusChristiHoldingsSeniorNotesMember2020-12-310000003570lng:A2015CCHTermLoanFacilityMember2021-12-310000003570lng:A2015CCHTermLoanFacilityMember2020-12-310000003570lng:CorpusChristiHoldingsWorkingCapitalFacilityMember2021-12-310000003570lng:CorpusChristiHoldingsWorkingCapitalFacilityMember2020-12-310000003570lng:CheniereCorpusChristiHoldingsLLCMember2021-12-310000003570lng:CheniereCorpusChristiHoldingsLLCMember2020-12-310000003570lng:A2028CheniereSeniorSecuredNotesMember2021-12-310000003570lng:A2028CheniereSeniorSecuredNotesMember2020-12-310000003570lng:A2021ConvertibleUnsecuredNotesMember2021-12-310000003570lng:A2021ConvertibleUnsecuredNotesMember2020-12-310000003570lng:A2045ConvertibleSeniorNotesMember2020-12-310000003570lng:CheniereRevolvingCreditFacilityMember2021-12-310000003570lng:CheniereRevolvingCreditFacilityMember2020-12-310000003570lng:CheniereTermLoanFacilityMember2021-12-310000003570lng:CheniereTermLoanFacilityMember2020-12-310000003570srt:ParentCompanyMember2021-12-310000003570srt:ParentCompanyMember2020-12-310000003570lng:CheniereMarketingTradeFinanceFacilitiesMember2021-12-310000003570lng:CheniereMarketingTradeFinanceFacilitiesMember2020-12-310000003570lng:A2020SPLWorkingCapitalFacilityMemberus-gaap:LondonInterbankOfferedRateLIBORMembersrt:MinimumMember2021-01-012021-12-31utr:Rate0000003570lng:A2020SPLWorkingCapitalFacilityMemberus-gaap:LondonInterbankOfferedRateLIBORMembersrt:MaximumMember2021-01-012021-12-310000003570lng:A2020SPLWorkingCapitalFacilityMembersrt:MinimumMemberus-gaap:BaseRateMember2021-01-012021-12-310000003570lng:A2020SPLWorkingCapitalFacilityMemberus-gaap:BaseRateMembersrt:MaximumMember2021-01-012021-12-310000003570us-gaap:LondonInterbankOfferedRateLIBORMembersrt:MinimumMemberlng:A2019CQPCreditFacilitiesMember2021-01-012021-12-310000003570us-gaap:LondonInterbankOfferedRateLIBORMembersrt:MaximumMemberlng:A2019CQPCreditFacilitiesMember2021-01-012021-12-310000003570srt:MinimumMemberus-gaap:BaseRateMemberlng:A2019CQPCreditFacilitiesMember2021-01-012021-12-310000003570us-gaap:BaseRateMembersrt:MaximumMemberlng:A2019CQPCreditFacilitiesMember2021-01-012021-12-310000003570us-gaap:LondonInterbankOfferedRateLIBORMemberlng:A2015CCHTermLoanFacilityMember2021-01-012021-12-310000003570lng:A2015CCHTermLoanFacilityMemberus-gaap:BaseRateMember2021-01-012021-12-310000003570us-gaap:LondonInterbankOfferedRateLIBORMembersrt:MinimumMemberlng:CorpusChristiHoldingsWorkingCapitalFacilityMember2021-01-012021-12-310000003570us-gaap:LondonInterbankOfferedRateLIBORMembersrt:MaximumMemberlng:CorpusChristiHoldingsWorkingCapitalFacilityMember2021-01-012021-12-310000003570srt:MinimumMemberus-gaap:BaseRateMemberlng:CorpusChristiHoldingsWorkingCapitalFacilityMember2021-01-012021-12-310000003570us-gaap:BaseRateMembersrt:MaximumMemberlng:CorpusChristiHoldingsWorkingCapitalFacilityMember2021-01-012021-12-310000003570us-gaap:LondonInterbankOfferedRateLIBORMembersrt:MinimumMemberlng:CheniereRevolvingCreditFacilityMember2021-01-012021-12-310000003570us-gaap:LondonInterbankOfferedRateLIBORMembersrt:MaximumMemberlng:CheniereRevolvingCreditFacilityMember2021-01-012021-12-310000003570srt:MinimumMemberus-gaap:BaseRateMemberlng:CheniereRevolvingCreditFacilityMember2021-01-012021-12-310000003570us-gaap:BaseRateMembersrt:MaximumMemberlng:CheniereRevolvingCreditFacilityMember2021-01-012021-12-310000003570lng:A2020SPLWorkingCapitalFacilityMember2021-01-012021-12-310000003570lng:A2019CQPCreditFacilitiesMember2021-01-012021-12-310000003570lng:CorpusChristiHoldingsWorkingCapitalFacilityMember2021-01-012021-12-310000003570lng:CheniereRevolvingCreditFacilityMember2021-01-012021-12-310000003570lng:A2015CCHTermLoanFacilityMember2021-01-012021-12-310000003570lng:A2045ConvertibleSeniorNotesMember2021-01-012021-12-310000003570us-gaap:ConvertibleDebtMember2021-01-012021-12-310000003570us-gaap:ConvertibleDebtMember2020-01-012020-12-310000003570us-gaap:ConvertibleDebtMember2019-01-012019-12-310000003570lng:DebtExcludingCapitalLeaseAndConvertibleDebtMember2021-01-012021-12-310000003570lng:DebtExcludingCapitalLeaseAndConvertibleDebtMember2020-01-012020-12-310000003570lng:DebtExcludingCapitalLeaseAndConvertibleDebtMember2019-01-012019-12-310000003570us-gaap:SeniorNotesMemberus-gaap:FairValueInputsLevel2Memberus-gaap:CarryingReportedAmountFairValueDisclosureMember2021-12-310000003570us-gaap:SeniorNotesMemberus-gaap:FairValueInputsLevel2Memberus-gaap:EstimateOfFairValueFairValueDisclosureMember2021-12-310000003570us-gaap:SeniorNotesMemberus-gaap:FairValueInputsLevel2Memberus-gaap:CarryingReportedAmountFairValueDisclosureMember2020-12-310000003570us-gaap:SeniorNotesMemberus-gaap:FairValueInputsLevel2Memberus-gaap:EstimateOfFairValueFairValueDisclosureMember2020-12-310000003570us-gaap:SeniorNotesMemberus-gaap:FairValueInputsLevel3Memberus-gaap:CarryingReportedAmountFairValueDisclosureMember2021-12-310000003570us-gaap:SeniorNotesMemberus-gaap:FairValueInputsLevel3Memberus-gaap:EstimateOfFairValueFairValueDisclosureMember2021-12-310000003570us-gaap:SeniorNotesMemberus-gaap:FairValueInputsLevel3Memberus-gaap:CarryingReportedAmountFairValueDisclosureMember2020-12-310000003570us-gaap:SeniorNotesMemberus-gaap:FairValueInputsLevel3Memberus-gaap:EstimateOfFairValueFairValueDisclosureMember2020-12-310000003570us-gaap:FairValueInputsLevel3Memberus-gaap:LineOfCreditMemberus-gaap:CarryingReportedAmountFairValueDisclosureMember2021-12-310000003570us-gaap:FairValueInputsLevel3Memberus-gaap:LineOfCreditMemberus-gaap:EstimateOfFairValueFairValueDisclosureMember2021-12-310000003570us-gaap:FairValueInputsLevel3Memberus-gaap:LineOfCreditMemberus-gaap:CarryingReportedAmountFairValueDisclosureMember2020-12-310000003570us-gaap:FairValueInputsLevel3Memberus-gaap:LineOfCreditMemberus-gaap:EstimateOfFairValueFairValueDisclosureMember2020-12-310000003570us-gaap:FairValueInputsLevel3Memberlng:A2021ConvertibleUnsecuredNotesMemberus-gaap:CarryingReportedAmountFairValueDisclosureMember2021-12-310000003570us-gaap:FairValueInputsLevel3Memberlng:A2021ConvertibleUnsecuredNotesMemberus-gaap:EstimateOfFairValueFairValueDisclosureMember2021-12-310000003570us-gaap:FairValueInputsLevel3Memberlng:A2021ConvertibleUnsecuredNotesMemberus-gaap:CarryingReportedAmountFairValueDisclosureMember2020-12-310000003570us-gaap:FairValueInputsLevel3Memberlng:A2021ConvertibleUnsecuredNotesMemberus-gaap:EstimateOfFairValueFairValueDisclosureMember2020-12-310000003570us-gaap:FairValueInputsLevel1Memberlng:A2045ConvertibleSeniorNotesMemberus-gaap:CarryingReportedAmountFairValueDisclosureMember2021-12-310000003570us-gaap:FairValueInputsLevel1Memberlng:A2045ConvertibleSeniorNotesMemberus-gaap:EstimateOfFairValueFairValueDisclosureMember2021-12-310000003570us-gaap:FairValueInputsLevel1Memberlng:A2045ConvertibleSeniorNotesMemberus-gaap:CarryingReportedAmountFairValueDisclosureMember2020-12-310000003570us-gaap:FairValueInputsLevel1Memberlng:A2045ConvertibleSeniorNotesMemberus-gaap:EstimateOfFairValueFairValueDisclosureMember2020-12-310000003570lng:OperatingLeaseAssetsMember2021-12-310000003570lng:OperatingLeaseAssetsMember2020-12-310000003570us-gaap:PropertyPlantAndEquipmentMember2021-12-310000003570us-gaap:PropertyPlantAndEquipmentMember2020-12-310000003570lng:CurrentOperatingLeaseLiabilitiesMember2021-12-310000003570lng:CurrentOperatingLeaseLiabilitiesMember2020-12-310000003570us-gaap:OtherCurrentLiabilitiesMember2021-12-310000003570us-gaap:OtherCurrentLiabilitiesMember2020-12-310000003570lng:NonCurrentOperatingLeaseLiabilitiesMember2021-12-310000003570lng:NonCurrentOperatingLeaseLiabilitiesMember2020-12-310000003570us-gaap:OtherNoncurrentLiabilitiesMember2021-12-310000003570us-gaap:OtherNoncurrentLiabilitiesMember2020-12-310000003570us-gaap:OperatingExpenseMember2021-01-012021-12-310000003570us-gaap:OperatingExpenseMember2020-01-012020-12-310000003570us-gaap:OperatingExpenseMember2019-01-012019-12-310000003570lng:DepreciationandAmortizationExpenseMember2021-01-012021-12-310000003570lng:DepreciationandAmortizationExpenseMember2020-01-012020-12-310000003570lng:DepreciationandAmortizationExpenseMember2019-01-012019-12-310000003570us-gaap:InterestExpenseMember2021-01-012021-12-310000003570us-gaap:InterestExpenseMember2020-01-012020-12-310000003570us-gaap:InterestExpenseMember2019-01-012019-12-310000003570srt:MaximumMember2021-12-310000003570lng:SuspensionFeesandLNGCoverDamagesRevenueMember2020-01-012020-12-310000003570lng:SuspensionFeesandLNGCoverDamagesRevenueMemberlng:SubsequentPeriodMember2020-01-012020-12-310000003570lng:SuspensionFeesandLNGCoverDamagesRevenueMember2019-01-012019-12-310000003570lng:SuspensionFeesandLNGCoverDamagesRevenueMember2021-01-012021-12-310000003570lng:LiquefiedNaturalGasProcuredFromThirdPartiesMember2021-01-012021-12-310000003570lng:LiquefiedNaturalGasProcuredFromThirdPartiesMember2020-01-012020-12-310000003570lng:LiquefiedNaturalGasProcuredFromThirdPartiesMember2019-01-012019-12-310000003570lng:TUACustomersMember2021-01-012021-12-310000003570lng:EachTUACustomerMember2021-01-012021-12-310000003570lng:TerminalUseAgreementRegasificationCapacityPartialMember2021-01-012021-12-310000003570lng:TerminalUseAgreementRegasificationCapacityPartialMember2020-01-012020-12-310000003570lng:TerminalUseAgreementRegasificationCapacityPartialMember2019-01-012019-12-3100000035702022-01-01lng:LiquefiedNaturalGasMember2021-12-310000003570lng:LiquefiedNaturalGasMember2021-01-012020-12-3100000035702022-01-01lng:RegasificationServiceMember2021-12-310000003570lng:RegasificationServiceMember2021-01-012020-12-3100000035702022-01-012021-12-3100000035702021-01-012020-12-310000003570lng:NaturalGasSupplyAgreementMember2021-01-012021-12-310000003570lng:CorpusChristiLiquefactionMemberus-gaap:PriceRiskDerivativeMemberlng:NaturalGasSupplyAgreementMember2021-12-310000003570lng:CorpusChristiLiquefactionMemberus-gaap:PriceRiskDerivativeMemberlng:NaturalGasSupplyAgreementMember2020-12-310000003570lng:CorpusChristiLiquefactionMemberlng:NaturalGasSupplyAgreementMember2021-01-012021-12-310000003570lng:CorpusChristiLiquefactionMemberlng:NaturalGasSupplyAgreementMember2020-01-012020-12-310000003570lng:CorpusChristiLiquefactionMemberlng:NaturalGasSupplyAgreementMember2019-01-012019-12-310000003570lng:CorpusChristiLiquefactionMemberus-gaap:PriceRiskDerivativeMemberlng:NaturalGasSupplyAgreementMember2021-01-012021-12-310000003570lng:CorpusChristiLiquefactionMemberus-gaap:PriceRiskDerivativeMemberlng:NaturalGasSupplyAgreementMember2020-01-012020-12-310000003570lng:CorpusChristiLiquefactionMemberus-gaap:PriceRiskDerivativeMemberlng:NaturalGasSupplyAgreementMember2019-01-012019-12-310000003570lng:NaturalGasTransportationAndStorageAgreementsMembersrt:MaximumMemberlng:SabinePassLiquefactionLLCAndCheniereCreoleTrailPipelineLPMember2021-01-012021-12-310000003570lng:NaturalGasTransportationAndStorageAgreementsMemberlng:SabinePassLiquefactionLLCAndCheniereCreoleTrailPipelineLPMember2021-01-012021-12-310000003570lng:NaturalGasTransportationAndStorageAgreementsMemberlng:SabinePassLiquefactionLLCAndCheniereCreoleTrailPipelineLPMember2020-01-012020-12-310000003570lng:NaturalGasTransportationAndStorageAgreementsMemberlng:SabinePassLiquefactionLLCAndCheniereCreoleTrailPipelineLPMember2021-12-310000003570lng:NaturalGasTransportationAndStorageAgreementsMemberlng:SabinePassLiquefactionLLCAndCheniereCreoleTrailPipelineLPMember2020-12-310000003570lng:NaturalGasTransportationAndStorageAgreementsMemberlng:CorpusChristiLiquefactionMember2021-01-012021-12-310000003570lng:NaturalGasTransportationAndStorageAgreementsMemberlng:CorpusChristiLiquefactionMember2020-01-012020-12-310000003570lng:NaturalGasTransportationAndStorageAgreementsMemberlng:CorpusChristiLiquefactionMember2021-12-310000003570lng:NaturalGasTransportationAndStorageAgreementsMemberlng:CorpusChristiLiquefactionMember2020-12-310000003570lng:OperationAndMaintenanceAgreementMemberus-gaap:ProductAndServiceOtherMemberlng:CheniereLNGOMServicesLLCMember2021-01-012021-12-310000003570lng:OperationAndMaintenanceAgreementMemberus-gaap:ProductAndServiceOtherMemberlng:CheniereLNGOMServicesLLCMember2020-01-012020-12-310000003570lng:OperationAndMaintenanceAgreementMemberus-gaap:ProductAndServiceOtherMemberlng:CheniereLNGOMServicesLLCMember2019-01-012019-12-310000003570lng:OperationAndMaintenanceAgreementMemberlng:CheniereLNGOMServicesLLCMember2020-12-310000003570lng:OperationAndMaintenanceAgreementMemberlng:CheniereLNGOMServicesLLCMember2021-12-310000003570us-gaap:DomesticCountryMember2021-12-310000003570us-gaap:StateAndLocalJurisdictionMember2021-12-310000003570us-gaap:ForeignCountryMember2021-12-310000003570us-gaap:DomesticCountryMemberus-gaap:InvestmentCreditMember2021-12-310000003570lng:A2011IncentivePlanMemberus-gaap:CommonStockMember2021-12-310000003570lng:A2020IncentivePlanMemberus-gaap:CommonStockMember2021-12-310000003570lng:EquityAwardsMember2021-01-012021-12-310000003570lng:EquityAwardsMember2020-01-012020-12-310000003570lng:EquityAwardsMember2019-01-012019-12-310000003570lng:LiabilityAwardsMember2021-01-012021-12-310000003570lng:LiabilityAwardsMember2020-01-012020-12-310000003570lng:LiabilityAwardsMember2019-01-012019-12-310000003570us-gaap:PerformanceSharesMember2021-01-012021-12-310000003570us-gaap:RestrictedStockMember2021-12-310000003570us-gaap:RestrictedStockMember2021-01-012021-12-310000003570lng:RestrictedShareUnitAndPerformanceStockUnitAwardsMember2021-12-310000003570lng:RestrictedShareUnitAndPerformanceStockUnitAwardsMember2021-01-012021-12-310000003570us-gaap:RestrictedStockMember2020-12-310000003570us-gaap:RestrictedStockMember2020-01-012020-12-310000003570us-gaap:RestrictedStockMember2019-01-012019-12-310000003570us-gaap:RestrictedStockUnitsRSUMember2021-01-012021-12-310000003570us-gaap:PerformanceSharesMembersrt:MinimumMember2021-01-012021-12-310000003570us-gaap:PerformanceSharesMembersrt:MaximumMember2021-01-012021-12-310000003570lng:RestrictedShareUnitAndPerformanceStockUnitAwardsMember2020-12-310000003570us-gaap:CommonStockMember2021-01-012021-12-310000003570lng:RestrictedShareUnitAndPerformanceStockUnitAwardsMember2020-01-012020-12-310000003570lng:RestrictedShareUnitAndPerformanceStockUnitAwardsMember2019-01-012019-12-310000003570us-gaap:PhantomShareUnitsPSUsMember2021-01-012021-12-310000003570us-gaap:PhantomShareUnitsPSUsMember2020-01-012020-12-310000003570us-gaap:PhantomShareUnitsPSUsMember2019-01-012019-12-310000003570lng:UnvestedStockMember2021-01-012021-12-310000003570lng:UnvestedStockMember2020-01-012020-12-310000003570lng:UnvestedStockMember2019-01-012019-12-310000003570lng:A2021CheniereConvertibleUnsecuredNotesMember2021-01-012021-12-310000003570lng:A2021CheniereConvertibleUnsecuredNotesMember2020-01-012020-12-310000003570lng:A2021CheniereConvertibleUnsecuredNotesMember2019-01-012019-12-310000003570lng:A2025CCHHoldCoIIConvertibleNotesMember2021-01-012021-12-310000003570lng:A2025CCHHoldCoIIConvertibleNotesMember2020-01-012020-12-310000003570lng:A2025CCHHoldCoIIConvertibleNotesMember2019-01-012019-12-310000003570lng:A2045ConvertibleSeniorNotesMember2021-01-012021-12-310000003570lng:A2045ConvertibleSeniorNotesMember2020-01-012020-12-310000003570lng:A2045ConvertibleSeniorNotesMember2019-01-012019-12-310000003570lng:InitialBoardApprovalMember2021-01-012021-12-310000003570lng:InitialBoardApprovalMember2021-12-310000003570lng:SubsequentBoardApprovedIncreaseMember2021-12-310000003570lng:SubsequentBoardApprovedIncreaseMember2021-01-012021-12-310000003570srt:ParentCompanyMember2021-01-012021-12-310000003570srt:ParentCompanyMember2020-01-012020-12-310000003570srt:ParentCompanyMember2019-01-012019-12-310000003570srt:ParentCompanyMemberus-gaap:SubsequentEventMember2022-01-252022-01-250000003570lng:BechtelEPCContractTrainSixMemberlng:SabinePassLiquefactionMember2021-01-012021-12-310000003570lng:BechtelEPCContractTrainSixMemberlng:SabinePassLiquefactionMember2021-12-310000003570srt:MaximumMemberlng:SabinePassLiquefactionCorpusChristiLiquefactionandCheniereCorpusChristiLiquefactionStageIIIMemberus-gaap:InventoriesMember2021-01-012021-12-310000003570lng:SabinePassLiquefactionAndCorpusChristiLiquefactionMembersrt:MaximumMemberus-gaap:NaturalGasGatheringTransportationMarketingAndProcessingMember2021-01-012021-12-310000003570lng:SabinePassLiquefactionMembersrt:MaximumMemberus-gaap:NaturalGasStorageMember2021-01-012021-12-310000003570lng:CorpusChristiLiquefactionMembersrt:MaximumMemberus-gaap:NaturalGasStorageMember2021-01-012021-12-310000003570lng:SabinePassLiquefactionCorpusChristiLiquefactionandCheniereCorpusChristiLiquefactionStageIIIMemberlng:NaturalGasSupplyTransportationAndStorageServiceAgreementsMember2021-01-012021-12-310000003570lng:SabinePassLiquefactionCorpusChristiLiquefactionandCheniereCorpusChristiLiquefactionStageIIIMemberlng:NaturalGasSupplyTransportationAndStorageServiceAgreementsMember2021-12-310000003570lng:A2022EOGIPMAgreementMemberlng:EOGResourcesIncMember2021-01-012021-12-310000003570lng:A2022EOGGasSupplyAgreementMemberlng:EOGResourcesIncMember2021-01-012021-12-310000003570us-gaap:SalesRevenueNetMemberlng:CustomerAMemberus-gaap:CustomerConcentrationRiskMember2021-01-012021-12-310000003570us-gaap:SalesRevenueNetMemberlng:CustomerAMemberus-gaap:CustomerConcentrationRiskMember2020-01-012020-12-310000003570us-gaap:SalesRevenueNetMemberlng:CustomerAMemberus-gaap:CustomerConcentrationRiskMember2019-01-012019-12-310000003570lng:AccountsReceivableAndContractAssetsMemberlng:CustomerAMemberus-gaap:CustomerConcentrationRiskMember2021-01-012021-12-310000003570lng:AccountsReceivableAndContractAssetsMemberlng:CustomerAMemberus-gaap:CustomerConcentrationRiskMember2020-01-012020-12-310000003570lng:CustomerBMemberus-gaap:SalesRevenueNetMemberus-gaap:CustomerConcentrationRiskMember2021-01-012021-12-310000003570lng:CustomerBMemberus-gaap:SalesRevenueNetMemberus-gaap:CustomerConcentrationRiskMember2020-01-012020-12-310000003570lng:CustomerBMemberus-gaap:SalesRevenueNetMemberus-gaap:CustomerConcentrationRiskMember2019-01-012019-12-310000003570lng:CustomerBMemberlng:AccountsReceivableAndContractAssetsMemberus-gaap:CustomerConcentrationRiskMember2020-01-012020-12-310000003570lng:CustomerCMemberus-gaap:SalesRevenueNetMemberus-gaap:CustomerConcentrationRiskMember2021-01-012021-12-310000003570lng:CustomerCMemberus-gaap:SalesRevenueNetMemberus-gaap:CustomerConcentrationRiskMember2020-01-012020-12-310000003570lng:CustomerCMemberus-gaap:SalesRevenueNetMemberus-gaap:CustomerConcentrationRiskMember2019-01-012019-12-310000003570us-gaap:SalesRevenueNetMemberlng:CustomerDMemberus-gaap:CustomerConcentrationRiskMember2020-01-012020-12-310000003570us-gaap:SalesRevenueNetMemberlng:CustomerDMemberus-gaap:CustomerConcentrationRiskMember2019-01-012019-12-310000003570country:IEus-gaap:GeographicConcentrationRiskMember2021-01-012021-12-310000003570country:IEus-gaap:GeographicConcentrationRiskMember2020-01-012020-12-310000003570country:IEus-gaap:GeographicConcentrationRiskMember2019-01-012019-12-310000003570country:SGus-gaap:GeographicConcentrationRiskMember2021-01-012021-12-310000003570country:SGus-gaap:GeographicConcentrationRiskMember2020-01-012020-12-310000003570country:SGus-gaap:GeographicConcentrationRiskMember2019-01-012019-12-310000003570country:KRus-gaap:GeographicConcentrationRiskMember2021-01-012021-12-310000003570country:KRus-gaap:GeographicConcentrationRiskMember2020-01-012020-12-310000003570country:KRus-gaap:GeographicConcentrationRiskMember2019-01-012019-12-310000003570country:ESus-gaap:GeographicConcentrationRiskMember2021-01-012021-12-310000003570country:ESus-gaap:GeographicConcentrationRiskMember2020-01-012020-12-310000003570country:ESus-gaap:GeographicConcentrationRiskMember2019-01-012019-12-310000003570country:INus-gaap:GeographicConcentrationRiskMember2021-01-012021-12-310000003570country:INus-gaap:GeographicConcentrationRiskMember2020-01-012020-12-310000003570country:INus-gaap:GeographicConcentrationRiskMember2019-01-012019-12-310000003570country:USus-gaap:GeographicConcentrationRiskMember2021-01-012021-12-310000003570country:USus-gaap:GeographicConcentrationRiskMember2020-01-012020-12-310000003570country:USus-gaap:GeographicConcentrationRiskMember2019-01-012019-12-310000003570country:GBus-gaap:GeographicConcentrationRiskMember2021-01-012021-12-310000003570country:GBus-gaap:GeographicConcentrationRiskMember2020-01-012020-12-310000003570country:GBus-gaap:GeographicConcentrationRiskMember2019-01-012019-12-310000003570lng:OtherCountriesMemberus-gaap:GeographicConcentrationRiskMember2021-01-012021-12-310000003570lng:OtherCountriesMemberus-gaap:GeographicConcentrationRiskMember2020-01-012020-12-310000003570lng:OtherCountriesMemberus-gaap:GeographicConcentrationRiskMember2019-01-012019-12-310000003570srt:ParentCompanyMember2019-12-310000003570srt:ParentCompanyMember2018-12-310000003570srt:ParentCompanyMemberlng:OperatingLeaseAssetsMember2021-12-310000003570srt:ParentCompanyMemberlng:OperatingLeaseAssetsMember2020-12-310000003570srt:ParentCompanyMemberlng:CurrentOperatingLeaseLiabilitiesMember2021-12-310000003570srt:ParentCompanyMemberlng:CurrentOperatingLeaseLiabilitiesMember2020-12-310000003570lng:NonCurrentOperatingLeaseLiabilitiesMembersrt:ParentCompanyMember2021-12-310000003570lng:NonCurrentOperatingLeaseLiabilitiesMembersrt:ParentCompanyMember2020-12-310000003570srt:ParentCompanyMemberus-gaap:GeneralAndAdministrativeExpenseMember2021-01-012021-12-310000003570srt:ParentCompanyMemberus-gaap:GeneralAndAdministrativeExpenseMember2020-01-012020-12-310000003570srt:ParentCompanyMemberlng:InitialBoardApprovalMember2019-06-032019-06-030000003570srt:ParentCompanyMemberlng:InitialBoardApprovalMember2019-06-030000003570srt:ParentCompanyMemberlng:SubsequentBoardApprovedIncreaseMember2021-09-070000003570srt:ParentCompanyMemberlng:SubsequentBoardApprovedIncreaseMember2021-01-012021-12-310000003570us-gaap:AllowanceForCreditLossMember2020-12-310000003570us-gaap:AllowanceForCreditLossMember2021-01-012021-12-310000003570us-gaap:AllowanceForCreditLossMember2021-12-310000003570us-gaap:ValuationAllowanceOfDeferredTaxAssetsMember2020-12-310000003570us-gaap:ValuationAllowanceOfDeferredTaxAssetsMember2021-01-012021-12-310000003570us-gaap:ValuationAllowanceOfDeferredTaxAssetsMember2021-12-310000003570us-gaap:AllowanceForCreditLossMember2019-12-310000003570us-gaap:AllowanceForCreditLossMember2020-01-012020-12-310000003570us-gaap:ValuationAllowanceOfDeferredTaxAssetsMember2019-12-310000003570us-gaap:ValuationAllowanceOfDeferredTaxAssetsMember2020-01-012020-12-310000003570us-gaap:AllowanceForCreditLossMember2018-12-310000003570us-gaap:AllowanceForCreditLossMember2019-01-012019-12-310000003570us-gaap:ValuationAllowanceOfDeferredTaxAssetsMember2018-12-310000003570us-gaap:ValuationAllowanceOfDeferredTaxAssetsMember2019-01-012019-12-31
UNITED STATES
SECURITIES AND EXCHANGE COMMISSION
Washington, D.C. 20549
FORM 10-K
☒ ANNUAL REPORT PURSUANT TO SECTION 13 OR 15(d) OF THE SECURITIES EXCHANGE ACT OF 1934
For the fiscal year ended December 31, 2021
or
☐ TRANSITION REPORT PURSUANT TO SECTION 13 OR 15(d) OF THE SECURITIES EXCHANGE ACT OF 1934
For the transition period from to
Commission file number 001-16383
CHENIERE ENERGY, INC.
(Exact name of registrant as specified in its charter)
| | | | | |
| Delaware | 95-4352386 |
| (State or other jurisdiction of incorporation or organization) | (I.R.S. Employer Identification No.) |
700 Milam Street, Suite 1900
Houston, Texas 77002
(Address of principal executive offices) (Zip Code)
(713) 375-5000
(Registrant’s telephone number, including area code)
Securities registered pursuant to Section 12(b) of the Act:
| | | | | | | | |
| Title of each class | Trading Symbol | Name of each exchange on which registered |
| Common Stock, $ 0.003 par value | LNG | NYSE American |
Securities registered pursuant to Section 12(g) of the Act: None
Indicate by check mark if the registrant is a well-known seasoned issuer, as defined in Rule 405 of the Securities Act. Yes ☒ No ☐
Indicate by check mark if the registrant is not required to file reports pursuant to Section 13 or Section 15(d) of the Act. Yes ☐ No ☒
Indicate by check mark whether the registrant (1) has filed all reports required to be filed by Section 13 or 15(d) of the Securities Exchange Act of 1934 during the preceding 12 months (or for such shorter period that the registrant was required to file such reports), and (2) has been subject to such filing requirements for the past 90 days. Yes ☒ No ☐
Indicate by check mark whether the registrant has submitted electronically every Interactive Data File required to be submitted pursuant to Rule 405 of Regulation S-T (§232.405 of this chapter) during the preceding 12 months (or for such shorter period that the registrant was required to submit such files). Yes ☒ No ☐
Indicate by check mark whether the registrant is a large accelerated filer, an accelerated filer, a non-accelerated filer, a smaller reporting company, or an emerging growth company. See the definitions of “large accelerated filer,” “accelerated filer,” “smaller reporting company” and “emerging growth company” in Rule 12b-2 of the Exchange Act.
| | | | | | | | | | | | | | | | | |
| Large accelerated filer | ☒ | | Accelerated filer | ☐ |
| Non-accelerated filer | ☐ | | Smaller reporting company | ☐ |
| | | | Emerging growth company | ☐ |
If an emerging growth company, indicate by check mark if the registrant has elected not to use the extended transition period for complying with any new or revised financial accounting standards provided pursuant to Section 13(a) of the Exchange Act. ☐
Indicate by check mark whether the registrant has filed a report on and attestation to its management’s assessment of the effectiveness of its internal control over financial reporting under Section 404(b) of the Sarbanes-Oxley Act (15 U.S.C. 7262(b)) by the registered public accounting firm that prepared or issued its audit report. ☒
Indicate by check mark whether the registrant is a shell company (as defined in Rule 12b-2 of the Exchange Act). Yes ☐ No ☒
The aggregate market value of the registrant’s Common Stock held by non-affiliates of the registrant was approximately $21.8 billion as of June 30, 2021.
As of February 18, 2022, the issuer had 254,397,855 shares of Common Stock outstanding.
Documents incorporated by reference: The definitive proxy statement for the registrant’s Annual Meeting of Stockholders (to be filed within 120 days of the close of the registrant’s fiscal year) is incorporated by reference into Part III.
CHENIERE ENERGY, INC.
TABLE OF CONTENTS
DEFINITIONS
As used in this annual report, the terms listed below have the following meanings:
Common Industry and Other Terms
| | | | | | | | |
| Bcf | | billion cubic feet |
| Bcf/d | | billion cubic feet per day |
| Bcf/yr | | billion cubic feet per year |
| Bcfe | | billion cubic feet equivalent |
| DOE | | U.S. Department of Energy |
| EPC | | engineering, procurement and construction |
| FERC | | Federal Energy Regulatory Commission |
| FTA countries | | countries with which the United States has a free trade agreement providing for national treatment for trade in natural gas |
| GAAP | | generally accepted accounting principles in the United States |
| Henry Hub | | the final settlement price (in USD per MMBtu) for the New York Mercantile Exchange’s Henry Hub natural gas futures contract for the month in which a relevant cargo’s delivery window is scheduled to begin |
| IPM agreements | | integrated production marketing agreements in which the gas producer sells to us gas on a global LNG index price, less a fixed liquefaction fee, shipping and other costs |
| LIBOR | | London Interbank Offered Rate |
| LNG | | liquefied natural gas, a product of natural gas that, through a refrigeration process, has been cooled to a liquid state, which occupies a volume that is approximately 1/600th of its gaseous state |
| MMBtu | | million British thermal units; one British thermal unit measures the amount of energy required to raise the temperature of one pound of water by one degree Fahrenheit |
| mtpa | | million tonnes per annum |
| | |
| non-FTA countries | | countries with which the United States does not have a free trade agreement providing for national treatment for trade in natural gas and with which trade is permitted |
| SEC | | U.S. Securities and Exchange Commission |
| SOFR | | Secured Overnight Financing Rate |
| SPA | | LNG sale and purchase agreement |
| TBtu | | trillion British thermal units; one British thermal unit measures the amount of energy required to raise the temperature of one pound of water by one degree Fahrenheit |
| Train | | an industrial facility comprised of a series of refrigerant compressor loops used to cool natural gas into LNG |
| TUA | | terminal use agreement |
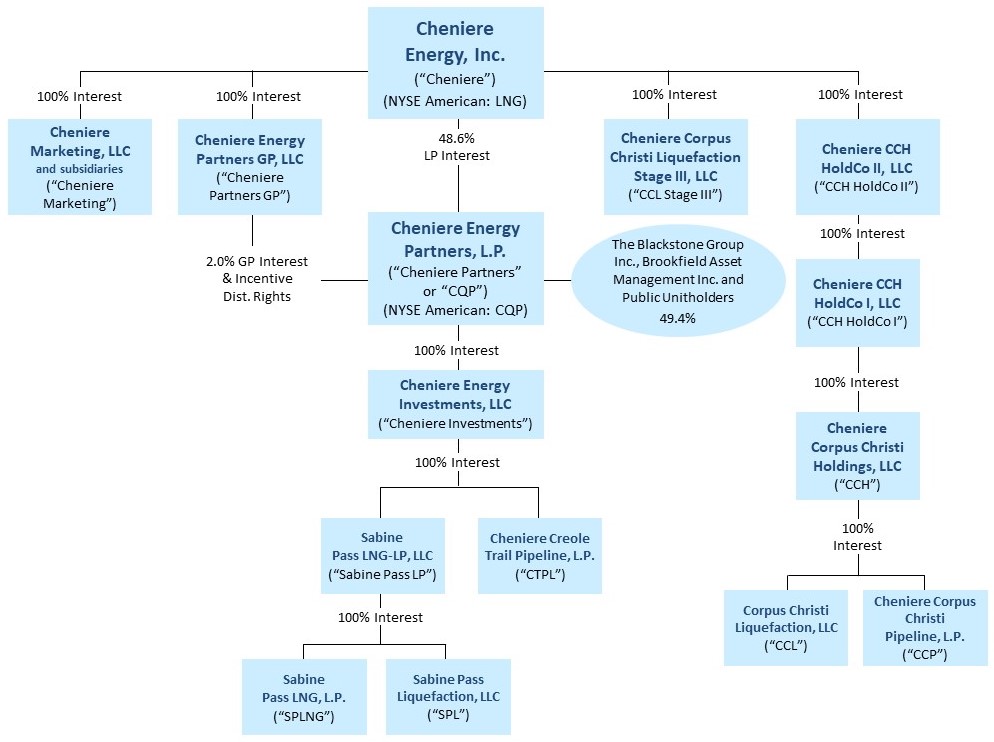
Abbreviated Legal Entity Structure
The following diagram depicts our abbreviated legal entity structure as of December 31, 2021, including our ownership of certain subsidiaries, and the references to these entities used in this annual report:
Unless the context requires otherwise, references to “Cheniere,” the “Company,” “we,” “us” and “our” refer to Cheniere Energy, Inc. and its consolidated subsidiaries, including our publicly traded subsidiary, CQP.
Unless the context requires otherwise, references to the “CCH Group” refer to CCH, CCL and CCP, collectively.
CAUTIONARY STATEMENT
REGARDING FORWARD-LOOKING STATEMENTS
This annual report contains certain statements that are, or may be deemed to be, “forward-looking statements” within the meaning of Section 27A of the Securities Act of 1933, as amended (the “Securities Act”), and Section 21E of the Securities Exchange Act of 1934, as amended (the “Exchange Act”). All statements, other than statements of historical or present facts or conditions, included herein or incorporated herein by reference are “forward-looking statements.” Included among “forward-looking statements” are, among other things:
•statements that we expect to commence or complete construction of our proposed LNG terminals, liquefaction facilities, pipeline facilities or other projects, or any expansions or portions thereof, by certain dates, or at all;
•statements regarding future levels of domestic and international natural gas production, supply or consumption or future levels of LNG imports into or exports from North America and other countries worldwide or purchases of natural gas, regardless of the source of such information, or the transportation or other infrastructure or demand for and prices related to natural gas, LNG or other hydrocarbon products;
•statements regarding any financing transactions or arrangements, or our ability to enter into such transactions;
•statements relating to Cheniere’s capital deployment, including intent, ability, extent, and timing of capital expenditures, debt repayment, dividends, and share repurchases;
•statements regarding our future sources of liquidity and cash requirements;
•statements relating to the construction of our Trains and pipelines, including statements concerning the engagement of any EPC contractor or other contractor and the anticipated terms and provisions of any agreement with any EPC or other contractor, and anticipated costs related thereto;
•statements regarding any SPA or other agreement to be entered into or performed substantially in the future, including any revenues anticipated to be received and the anticipated timing thereof, and statements regarding the amounts of total LNG regasification, natural gas liquefaction or storage capacities that are, or may become, subject to contracts;
•statements regarding counterparties to our commercial contracts, construction contracts and other contracts;
•statements regarding our planned development and construction of additional Trains or pipelines, including the financing of such Trains or pipelines;
•statements that our Trains, when completed, will have certain characteristics, including amounts of liquefaction capacities;
•statements regarding our business strategy, our strengths, our business and operation plans or any other plans, forecasts, projections, or objectives, including anticipated revenues, capital expenditures, maintenance and operating costs and cash flows, any or all of which are subject to change;
•statements regarding legislative, governmental, regulatory, administrative or other public body actions, approvals, requirements, permits, applications, filings, investigations, proceedings or decisions;
•statements regarding our anticipated LNG and natural gas marketing activities;
•statements regarding the COVID-19 pandemic and its impact on our business and operating results, including any customers not taking delivery of LNG cargoes, the ongoing creditworthiness of our contractual counterparties, any disruptions in our operations or construction of our Trains and the health and safety of our employees, and on our customers, the global economy and the demand for LNG;
•any other statements that relate to non-historical or future information; and
All of these types of statements, other than statements of historical or present facts or conditions, are forward-looking statements. In some cases, forward-looking statements can be identified by terminology such as “may,” “will,” “could,” “should,” “achieve,” “anticipate,” “believe,” “contemplate,” “continue,” “estimate,” “expect,” “intend,” “plan,” “potential,” “predict,” “project,” “pursue,” “target,” the negative of such terms or other comparable terminology. The forward-looking statements contained in this annual report are largely based on our expectations, which reflect estimates and assumptions made by our management. These estimates and assumptions reflect our best judgment based on currently known market conditions and other factors. Although we believe that such estimates are reasonable, they are inherently uncertain and involve a number of risks and uncertainties beyond our control. In addition, assumptions may prove to be inaccurate. We caution that the
CAUTIONARY STATEMENT
REGARDING FORWARD-LOOKING STATEMENTS
forward-looking statements contained in this annual report are not guarantees of future performance and that such statements may not be realized or the forward-looking statements or events may not occur. Actual results may differ materially from those anticipated or implied in forward-looking statements as a result of a variety of factors described in this annual report and in the other reports and other information that we file with the SEC. All forward-looking statements attributable to us or persons acting on our behalf are expressly qualified in their entirety by these risk factors. These forward-looking statements speak only as of the date made, and other than as required by law, we undertake no obligation to update or revise any forward-looking statement or provide reasons why actual results may differ, whether as a result of new information, future events or otherwise.
PART I
ITEMS 1. AND 2. BUSINESS AND PROPERTIES
General
Cheniere Energy, Inc. (“Cheniere”), a Delaware corporation, is a Houston-based energy infrastructure company primarily engaged in LNG-related businesses. We provide clean, secure and affordable LNG to integrated energy companies, utilities and energy trading companies around the world. We aspire to conduct our business in a safe and responsible manner, delivering a reliable, competitive and integrated source of LNG to our customers.
LNG is natural gas (methane) in liquid form. The LNG we produce is shipped all over the world, turned back into natural gas (called “regasification”) and then transported via pipeline to homes and businesses and used as an energy source that is essential for heating, cooking and other industrial uses. Natural gas is a cleaner-burning, abundant and affordable source of energy. When LNG is converted back to natural gas, it can be used instead of coal, which reduces the amount of pollution traditionally produced from burning fossil fuels, like sulfur dioxide and particulate matter that enters the air we breathe. Additionally, compared to coal, it produces significantly fewer carbon emissions. By liquefying natural gas, we are able to reduce its volume by 600 times so that we can load it onto special LNG carriers designed to keep the LNG cold and in liquid form for efficient transport overseas.
We own and operate the Sabine Pass LNG terminal in Louisiana, one of the largest LNG production facilities in the world, through our ownership interest in and management agreements with Cheniere Energy Partners, L.P. (“CQP”), which is a publicly traded limited partnership that we created in 2007. As of December 31, 2021, we owned 100% of the general partner interest and 48.6% of the limited partner interest in CQP.
CQP owns the Sabine Pass LNG terminal located in Cameron Parish, Louisiana, which has natural gas liquefaction facilities consisting of six operational Trains, with Train 6 which achieved substantial completion on February 4, 2022, for a total production capacity of approximately 30 mtpa of LNG (the “SPL Project”). The Sabine Pass LNG terminal also has operational regasification facilities that include five LNG storage tanks with aggregate capacity of approximately 17 Bcfe, two existing marine berths and one under construction that can each accommodate vessels with nominal capacity of up to 266,000 cubic meters and vaporizers with regasification capacity of approximately 4 Bcf/d. CQP also owns a 94-mile pipeline through its subsidiary, Cheniere Creole Trail Pipeline, L.P. (“CTPL”), that interconnects the Sabine Pass LNG terminal with a number of large interstate pipelines (the “Creole Trail Pipeline”).
We also own the Corpus Christi LNG terminal near Corpus Christi, Texas, which has natural gas liquefaction facilities consisting of three operational Trains for a total production capacity of approximately 15 mtpa of LNG. Additionally, we operate a 21.5-mile natural gas supply pipeline that interconnects the Corpus Christi LNG terminal with several interstate and intrastate natural gas pipelines (the “Corpus Christi Pipeline” and together with the Trains, the “CCL Project”) through our subsidiaries Corpus Christi Liquefaction, LLC (“CCL”) and Cheniere Corpus Christi Pipeline, L.P. (“CCP”), respectively, as part of the CCH Group. The CCL Project also includes three LNG storage tanks with aggregate capacity of approximately 10 Bcfe and two marine berths that can each accommodate vessels with nominal capacity of up to 266,000 cubic meters.
We are the largest producer of LNG in the United States and the second largest LNG producer globally, based on the total production capacity of our asset platforms of approximately 40 mtpa as of December 31, 2021, which increased to approximately 45 mtpa upon our ninth Train which achieved substantial completion on February 4, 2022. We are also the largest consumer of natural gas in the United States on a daily basis, at full utilization of the Trains in operation.
Additionally, separate from the CCH Group, we are developing an expansion of the Corpus Christi LNG terminal adjacent to the CCL Project (“Corpus Christi Stage 3”) through our subsidiary Cheniere Corpus Christi Liquefaction Stage III, LLC (“CCL Stage III”) for up to seven midscale Trains with an expected total production capacity of over 10 mtpa of LNG. We received approval from FERC in November 2019 to site, construct and operate the expansion project.
Our customer arrangements provide us with significant, stable and long-term cash flows. As further discussed below, we contract our anticipated production capacity under SPAs, in which our customers are generally required to pay a fixed fee with respect to the contracted volumes irrespective of their election to cancel or suspend deliveries of LNG cargoes, and under IPM agreements, in which the gas producer sells to us gas on a global LNG index price, less a fixed liquefaction fee, shipping and
other costs. We have contracted approximately 95% of the total production capacity from the SPL Project and the CCL Project (collectively, the “Liquefaction Projects”), including those contracts executed to support Corpus Christi Stage 3. Substantially all of our contracted capacity is from contracts with terms exceeding 10 years. Excluding contracts with terms less than 10 years, our SPAs and IPM agreements had approximately 17 years of weighted average remaining life as of December 31, 2021. We also market and sell LNG produced by the Liquefaction Projects that is not required for other customers through our integrated marketing function. For further discussion of the contracted future cash flows under our revenue arrangements, see Item 7. Management's Discussion and Analysis of Financial Condition and Results of Operations—Liquidity and Capital Resources.
We remain focused on operational excellence and customer satisfaction. Increasing demand for LNG has allowed us to expand our liquefaction infrastructure in a financially disciplined manner. We have increased available liquefaction capacity at our Liquefaction Projects as a result of debottlenecking and other optimization projects. We hold significant land positions at both the Sabine Pass LNG terminal and the Corpus Christi LNG terminal, which provide opportunity for further liquefaction capacity expansion. The development of these sites or other projects, including infrastructure projects in support of natural gas supply and LNG demand, will require, among other things, acceptable commercial and financing arrangements before we can make a final investment decision (“FID”).
Additionally, we are committed to the responsible and proactive management of our most important environmental, social and governance (“ESG”) impacts, risks and opportunities. We published our 2020 Corporate Responsibility (“CR”) report, which details our strategy and progress on ESG issues, as well as our efforts on integrating climate considerations into our business strategy and taking a leadership position on increased environmental transparency, including conducting a climate scenario analysis and our plan to provide LNG customers with Cargo Emission Tags. In August 2021, we also announced a peer-reviewed LNG life cycle assessment study which allows for improved greenhouse gas emissions assessment, which was published in the American Chemical Society Sustainable Chemistry & Engineering Journal. Our CR report is available at cheniere.com/IMPACT. Information on our website, including the CR report, is not incorporated by reference into this Annual Report on Form 10-K. For further discussion on social and governance matters, see Human Capital Resources.
Our Business Strategy
Our primary business strategy is to be a full service LNG provider to worldwide end-use customers. We accomplish this objective by owning, constructing and operating LNG and natural gas infrastructure facilities to meet our long-term customers’ energy demands and:
•safely, efficiently and reliably operating and maintaining our assets;
•procuring natural gas and pipeline transport capacity to our facilities;
•providing value to our customers through destination flexibility, options not to lift cargoes and diversity of price and geography;
•continuing to secure long-term customer contracts to support our planned expansion, including the FID of Corpus Christi Stage 3;
•completing our expansion construction projects safely, on-time and on-budget;
•maximizing the production of LNG to serve our customers and generating steady and stable revenues and operating cash flows;
•maintaining a flexible capital structure to finance the acquisition, development, construction and operation of the energy assets needed to supply our customers;
•executing our “all of the above” capital allocation strategy, focused on strengthening our balance sheet, funding financially disciplined growth and returning capital to our shareholders; and
•strategically identifying actionable environmental solutions.
Our Business
We shipped our first LNG cargo in February 2016 and as of February 18, 2022, over 2,000 cumulative LNG cargoes totaling approximately 140 million tonnes of LNG have been produced, loaded and exported from the Liquefaction Projects. Cheniere’s LNG has been shipped to 37 countries and regions around the world.
Sabine Pass LNG Terminal
Liquefaction Facilities
The SPL Project is one of the largest LNG production facilities in the world. Through CQP we operate six Trains, including Train 6 which achieved substantial completion on February 4, 2022, and two marine berths at the SPL Project, and are constructing a third marine berth. The SPL Project has a lump sum turnkey contract with Bechtel Oil, Gas and Chemicals, Inc. (“Bechtel”) for the EPC of Train 6 of the SPL Project. The following table summarizes the project completion and construction status of Train 6 as of December 31, 2021:
| | | | | | | | | | | |
| | SPL Train 6 |
| Overall project completion percentage | | 99.5% |
| Completion percentage of: | | |
| Engineering | | 100.0% |
| Procurement | | 100.0% |
| Subcontract work | | 99.6% |
| Construction | | 98.8% |
| Date of substantial completion | | February 4, 2022 |
The following summarizes the volumes of natural gas for which we have received approvals from FERC to site, construct and operate the SPL Project and the orders we have received from the DOE authorizing the export of domestically produced LNG by vessel from the Sabine Pass LNG terminal through December 31, 2050:
| | | | | | | | | | | | | | | | | | | | | | | |
| FERC Approved Volume | | DOE Approved Volume |
| (in Bcf/yr) | | (in mtpa) | | (in Bcf/yr) | | (in mtpa) |
| FTA countries | 1,661.94 | | 33 | | 1,661.94 | | 33 |
| Non-FTA countries | 1,661.94 | | 33 | | 1,509.3 (1) | | 30 |
(1)The authorization for an additional 152.64 Bcf/yr (approximately 3 mtpa) of natural gas is currently pending.
Natural Gas Supply, Transportation and Storage
SPL has secured natural gas feedstock for the Sabine Pass LNG terminal through long-term natural gas supply agreements. Additionally, to ensure that SPL is able to transport natural gas feedstock to the Sabine Pass LNG terminal and manage inventory levels, it has entered into transportation precedent and other agreements to secure firm pipeline transportation and storage capacity from third parties.
Regasification Facilities
The Sabine Pass LNG terminal has operational regasification capacity of approximately 4 Bcf/d and aggregate LNG storage capacity of approximately 17 Bcfe. SPLNG has entered into two long-term, third party TUAs for an aggregate of 2 Bcf/d, under which SPLNG’s customers are required to pay fixed monthly fees, whether or not they use the regasification capacity they have reserved at the Sabine Pass LNG terminal. The remaining approximately 2 Bcf/d of capacity has been reserved under a TUA by SPL.
Corpus Christi LNG Terminal
Liquefaction Facilities
We operate three Trains and two marine berths at the CCL Project. We commenced commercial operating activities of Trains 1, 2 and 3 of the CCL Project in February 2019, August 2019 and March 2021, respectively. Separate from the CCH Group, we are also developing Corpus Christi Stage 3 with up to seven midscale Trains through our subsidiary CCL Stage III, adjacent to the CCL Project.
The following summarizes the volumes of natural gas for which we have received approvals from FERC to site, construct and operate the CCL Project and Corpus Christi Stage 3 and the orders we have received from the DOE authorizing the export of domestically produced LNG by vessel from the Corpus Christi LNG terminal through December 31, 2050:
| | | | | | | | | | | | | | | | | | | | | | | |
| FERC Approved Volume | | DOE Approved Volume |
| (in Bcf/yr) | | (in mtpa) | | (in Bcf/yr) | | (in mtpa) |
| CCL Project: | | | | | | | |
| FTA countries | 875.16 | | 17 | | 875.16 | | 17 |
| Non-FTA countries | 875.16 | | 17 | | 767 (1) | | 15 |
| Corpus Christi Stage 3: | | | | | | | |
| FTA countries | 582.14 | | 11.45 | | 582.14 | | 11.45 |
| Non-FTA countries | 582.14 | | 11.45 | | 582.14 | | 11.45 |
(1)The authorization for an additional 108.16 Bcf/yr (approximately 2 mtpa) of natural gas is currently pending.
Pipeline Facilities
In November 2019, the FERC authorized CCP to construct and operate the pipeline for Corpus Christi Stage 3. The pipeline will be designed to transport 1.5 Bcf/d of natural gas feedstock required by Corpus Christi Stage 3 from the existing regional natural gas pipeline grid.
Natural Gas Supply, Transportation and Storage
CCL has secured natural gas feedstock for the Corpus Christi LNG terminal through traditional long-term natural gas supply and IPM agreements. CCL Stage III has also entered into long-term natural gas supply contracts with third parties, including IPM agreements, and anticipates continuing to enter into such agreements, in order to secure natural gas feedstock for Corpus Christi Stage 3. Additionally, to ensure that CCL is able to transport and manage the natural gas feedstock to the Corpus Christi LNG terminal, it has entered into transportation precedent and other agreements to secure firm pipeline transportation and storage capacity from third parties.
Final Investment Decision for Corpus Christi Stage 3
FID for Corpus Christi Stage 3 will be subject to, among other things, entering into an EPC contract for the project and securing the necessary financing arrangements.
Marketing
We market and sell LNG produced by the Liquefaction Projects that is not required for other customers through Cheniere Marketing, our integrated marketing function. We have, and continue to develop, a portfolio of long-, medium- and short-term SPAs to transport and unload commercial LNG cargoes to locations worldwide.
Customers
The following table shows customers with revenues of 10% or greater of total revenues from external customers:
| | | | | | | | | | | | | | | | | | | | | | |
| | | | | | Percentage of Total Revenues from External Customers |
| | | | Year Ended December 31, |
| | | | | | 2021 | | 2020 | | 2019 |
BG Gulf Coast LNG, LLC and affiliates | | | | | | 12% | | 14% | | 16% |
Naturgy LNG GOM, Limited | | | | | | 12% | | 12% | | 10% |
Korea Gas Corporation | | | | | | 10% | | 10% | | 11% |
GAIL (India) Limited | | | | | | * | | 10% | | 11% |
| | | | | | | | | | |
* Less than 10%
All of the above customers contribute to our LNG revenues through SPA contracts.
Governmental Regulation
Our LNG terminals and pipelines are subject to extensive regulation under federal, state and local statutes, rules, regulations and laws. These laws require that we engage in consultations with appropriate federal and state agencies and that we obtain and maintain applicable permits and other authorizations. These rigorous regulatory requirements increase the cost of construction and operation, and failure to comply with such laws could result in substantial penalties and/or loss of necessary authorizations.
Federal Energy Regulatory Commission
The design, construction, operation, maintenance and expansion of our liquefaction facilities, the import or export of LNG and the purchase and transportation of natural gas in interstate commerce through our pipelines (including our Creole Trail Pipeline and Corpus Christi Pipeline) are highly regulated activities subject to the jurisdiction of the FERC pursuant to the Natural Gas Act of 1938, as amended (the “NGA”). Under the NGA, the FERC’s jurisdiction generally extends to the transportation of natural gas in interstate commerce, to the sale for resale of natural gas in interstate commerce, to natural gas companies engaged in such transportation or sale and to the construction, operation, maintenance and expansion of LNG terminals and interstate natural gas pipelines.
The FERC’s authority to regulate interstate natural gas pipelines and the services that they provide generally includes regulation of:
•rates and charges, and terms and conditions for natural gas transportation, storage and related services;
•the certification and construction of new facilities and modification of existing facilities;
•the extension and abandonment of services and facilities;
•the administration of accounting and financial reporting regulations, including the maintenance of accounts and records;
•the acquisition and disposition of facilities;
•the initiation and discontinuation of services; and
•various other matters.
Under the NGA, our pipelines are not permitted to unduly discriminate or grant undue preference as to rates or the terms and conditions of service to any shipper, including its own marketing affiliate. Those rates, terms and conditions must be public, and on file with the FERC. In contrast to pipeline regulation, the FERC does not require LNG terminal owners to provide open-access services at cost-based or regulated rates. Although the provisions that codified FERC’s policy in this area expired on January 1, 2015, we see no indication that the FERC intends to change its policy in this area. On February 18, 2022,
FERC updated its 1999 Policy Statement on certification of new interstate natural gas facilities and the framework for FERC’s decision-making process, which would now include, among other things, reasonably foreseeable greenhouse gas emissions that may be attributable to the project and the project’s impact on environmental justice communities. These FERC changes are the first revision in more than 20 years to FERC’s policy for the certification of new interstate natural gas pipeline projects under Section 7 of the NGA. The updated Policy Statement has more limited applicability to LNG projects regulated under Section 3 of the Natural Gas Act. While the impact on our future projects and expansions is not known at this time, we do not expect it to have a material adverse effect on our operations.
We are permitted to make sales of natural gas for resale in interstate commerce pursuant to a blanket marketing certificate granted by the FERC with the issuance of our Certificate of Public Convenience and Necessity to our marketing affiliates. Our sales of natural gas will be affected by the availability, terms and cost of pipeline transportation. As noted above, the price and terms of access to pipeline transportation are subject to extensive federal and state regulation.
In order to site, construct and operate our LNG terminals, we received and are required to maintain authorizations from the FERC under Section 3 of the NGA as well as other material governmental and regulatory approvals and permits. The Energy Policy Act of 2005 (the “EPAct”) amended Section 3 of the NGA to establish or clarify the FERC’s exclusive authority to approve or deny an application for the siting, construction, expansion or operation of LNG terminals, unless specifically provided otherwise in the EPAct, amendments to the NGA. For example, nothing in the EPAct amendments to the NGA were intended to affect otherwise applicable law related to any other federal agency’s authorities or responsibilities related to LNG terminals or those of a state acting under federal law.
The FERC issued its final Order Granting Section 3 Authority (“Order”) in April 2012 approving our application for an order under Section 3 of the NGA authorizing the siting, construction and operation of Trains 1 through 4 of the SPL Project (and related facilities). Subsequently, in May 2012, the FERC issued written approval to commence site preparation work for Trains 1 through 4. In October 2012, we applied to amend the FERC approval to reflect certain modifications to the SPL Project, and in August 2013, the FERC issued an Order approving the modifications. In October 2013, we applied to further amend the FERC approval, requesting authorization to increase the total permitted LNG production capacity of Trains 1 through 4 from the then authorized 803 Bcf/yr to 1,006 Bcf/yr so as to more accurately reflect the estimated maximum LNG production capacity of Trains 1 through 4. In February 2014, the FERC issued an order approving the October 2013 application (the “February 2014 Order”). A party to the proceeding requested a rehearing of the February 2014 Order, and in September 2014, the FERC issued an order denying the rehearing request (the “FERC Order Denying Rehearing”). The party petitioned the U.S. Court of Appeals for the District of Columbia Circuit (the “Court of Appeals”) to review the February 2014 Order and the FERC Order Denying Rehearing. The court denied the petition in June 2016. In September 2013, we filed an application with the FERC for authorization to add Trains 5 and 6 to the SPL Project, which was granted by the FERC in an Order issued in April 2015 and an Order denying rehearing issued in June 2015. These Orders are not subject to appellate court review. In October of 2018, SPL applied to the FERC for authorization to add a third marine berth to the Sabine Pass LNG terminal facilities, which FERC approved in February of 2020. FERC issued written approval to commence site preparation work for the third berth in June 2020.
The Creole Trail Pipeline, which interconnects with the Sabine Pass LNG terminal, holds a certificate of public convenience and necessity from the FERC under Section 7 of the NGA. The FERC’s approval under Section 7 of the NGA, as well as several other material governmental and regulatory approvals and permits, is required prior to making any modifications to the Creole Trail Pipeline as it is a regulated, interstate natural gas pipeline. In February 2013, the FERC approved CTPL’s application for authorization to construct, own, operate and maintain certain new facilities in order to enable bi-directional natural gas flow on the Creole Trail Pipeline system to allow for the delivery of up to 1,530,000 Dekatherms per day of feed gas to the Sabine Pass LNG terminal. In November 2013, CTPL received approval from the Louisiana Department of Environmental Quality (“LDEQ”) for the proposed modifications and construction was completed in 2015. In September 2013, as part of the Application for Trains 5 and 6, we filed an application with the FERC for authorization to construct and operate an extension and expansion of Creole Trail Pipeline and related facilities in order to deliver additional domestic natural gas supplies to the Sabine Pass LNG terminal, which was granted by the FERC in an order issued in April 2015 and an order denying rehearing issued in June 2015. These orders are not subject to appellate court review.
In December 2014, the FERC issued an order granting CCL authorization under Section 3 of the NGA to site, construct and operate Trains 1 through 3 of the CCL Project and issued a certificate of public convenience and necessity under Section 7(c) of the NGA authorizing construction and operation of the Corpus Christi Pipeline (the “December 2014 Order”). A party to the proceeding requested a rehearing of the December 2014 Order, and in May 2015, the FERC denied rehearing (the “Order
Denying Rehearing”). The party petitioned the relevant Court of Appeals to review the December 2014 Order and the Order Denying Rehearing; that petition was denied on November 4, 2016. In June of 2018, CCL Stage III, CCL and Corpus Christi Pipeline filed an application with the FERC for authorization under Section 3 of the NGA to site, construct and operate Corpus Christi Stage 3 at the existing CCL Project and pipeline locations. In November 2019, the FERC authorized Corpus Christi Stage 3. Corpus Christi Stage 3 consists of the addition of seven midscale Trains and related facilities. The order is not subject to appellate court review. In 2020, FERC authorized Corpus Christi Pipeline to construct and operate a portion of Corpus Christi Stage 3 (Sinton Compressor Station Unit No. 1) on an interim basis independently from the remaining Corpus Christi Stage 3 facilities, which received FERC approval for in-service in December 2020.
On September 27, 2019, CCL and SPL filed a request with the FERC pursuant to Section 3 of the NGA, requesting authorization to increase the total LNG production capacity of each terminal from currently authorized levels to an amount which reflects more accurately the capacity of each facility based on enhancements during the engineering, design and construction process, as well as operational experience to date. The requested authorizations do not involve construction of new facilities. Corresponding applications for authorization to export the incremental volumes were also submitted to the DOE. The DOE issued Orders granting authorization to export LNG to FTA countries in April 2020. The DOE authorization for export to non-FTA countries is still pending. In October 2021, the FERC issued its Orders Amending Authorization under Section 3 of the NGA.
The FERC’s Standards of Conduct apply to interstate pipelines that conduct transmission transactions with an affiliate that engages in natural gas marketing functions. The general principles of the FERC Standards of Conduct are: (1) independent functioning, which requires transmission function employees to function independently of marketing function employees; (2) no-conduit rule, which prohibits passing transmission function information to marketing function employees; and (3) transparency, which imposes posting requirements to detect undue preference due to the improper disclosure of non-public transmission function information. We have established the required policies, procedures and training to comply with the FERC’s Standards of Conduct.
All of our FERC construction, operation, reporting, accounting and other regulated activities are subject to audit by the FERC, which may conduct routine or special inspections and issue data requests designed to ensure compliance with FERC rules, regulations, policies and procedures. The FERC’s jurisdiction under the NGA allows it to impose civil and criminal penalties for any violations of the NGA and any rules, regulations or orders of the FERC up to approximately $1.3 million per day per violation, including any conduct that violates the NGA’s prohibition against market manipulation.
Several other material governmental and regulatory approvals and permits will be required throughout the life of our LNG terminals and our pipelines. In addition, our FERC orders require us to comply with certain ongoing conditions, reporting obligations and maintain other regulatory agency approvals throughout the life of our facilities. For example, throughout the life of our LNG terminals and our pipelines, we are subject to regular reporting requirements to the FERC, the Department of Transportation’s (“DOT”) Pipeline and Hazardous Materials Safety Administration (“PHMSA”) and applicable federal and state regulatory agencies regarding the operation and maintenance of our facilities. To date, we have been able to obtain and maintain required approvals as needed, and the need for these approvals and reporting obligations have not materially affected our construction or operations.
DOE Export Licenses
The DOE has authorized the export of domestically produced LNG by vessel from the Sabine Pass LNG terminal as discussed in Sabine Pass LNG Terminal—Liquefaction Facilities and the Corpus Christi LNG terminal as discussed in Corpus Christi LNG Terminal—Liquefaction Facilities. Although it is not expected to occur, the loss of an export authorization could be a force majeure event under our SPAs.
Under Section 3 of the NGA applications for exports of natural gas to FTA countries, which allow for national treatment for trade in natural gas, are “deemed to be consistent with the public interest” and shall be granted by the DOE without “modification or delay.” FTA countries currently recognized by the DOE for exports of LNG include Australia, Bahrain, Canada, Chile, Colombia, Dominican Republic, El Salvador, Guatemala, Honduras, Jordan, Mexico, Morocco, Nicaragua, Oman, Panama, Peru, Republic of Korea and Singapore. FTAs with Israel and Costa Rica do not require national treatment for trade in natural gas. Applications for export of LNG to non-FTA countries are considered by the DOE in a notice and comment proceeding whereby the public and other interveners are provided the opportunity to comment and may assert that such authorization would not be consistent with the public interest.
Pipeline and Hazardous Materials Safety Administration
Our LNG terminals as well as the Creole Trail Pipeline and the Corpus Christi Pipeline are subject to regulation by PHMSA. PHMSA is authorized by the applicable pipeline safety laws to establish minimum safety standards for certain pipelines and LNG facilities. The regulatory standards PHMSA has established are applicable to the design, installation, testing, construction, operation, maintenance and management of natural gas and hazardous liquid pipeline facilities and LNG facilities that affect interstate or foreign commerce. PHMSA has also established training, worker qualification and reporting requirements.
PHMSA performs inspections of pipeline and LNG facilities and has authority to undertake enforcement actions, including issuance of civil penalties up to approximately $225,000 per day per violation, with a maximum administrative civil penalty of approximately $2.25 million for any related series of violations.
Other Governmental Permits, Approvals and Authorizations
Construction and operation of the Sabine Pass LNG terminal and the CCL Project require additional permits, orders, approvals and consultations to be issued by various federal and state agencies, including the DOT, U.S. Army Corps of Engineers (“USACE”), U.S. Department of Commerce, National Marine Fisheries Service, U.S. Department of the Interior, U.S. Fish and Wildlife Service, the U.S. Environmental Protection Agency (the “EPA”), U.S. Department of Homeland Security, the LDEQ, the Texas Commission on Environmental Quality (“TCEQ”) and the Railroad Commission of Texas (“RRC”).
The USACE issues its permits under the authority of the Clean Water Act (“CWA”) (Section 404) and the Rivers and Harbors Act (Section 10). The EPA administers the Clean Air Act (“CAA”), and has delegated authority to the TCEQ and LDEQ to issue the Title V Operating Permit (the “Title V Permit”) and the Prevention of Significant Deterioration Permit (the “PSD Permit”). These two permits are issued by the LDEQ for the Sabine Pass LNG terminal and CTPL and by the TCEQ for the CCL Project.
Commodity Futures Trading Commission (“CFTC”)
The Dodd-Frank Wall Street Reform and Consumer Protection Act (the “Dodd-Frank Act”) amended the Commodity Exchange Act to provide for federal regulation of the over-the-counter derivatives market and entities, such as us, that participate in those markets. The CFTC has enacted a number of regulations pursuant to the Dodd-Frank Act, including the speculative position limit rules which became effective on March 15, 2021 and have a phased-in compliance date that began on January 1, 2022. Given the recent enactment of the speculative position limit rules, as well as the impact of other rules and regulations under the Dodd-Frank Act, the impact of such rules and regulations on our business continues to be uncertain.
As required by the Dodd-Frank Act, the CFTC and federal banking regulators also adopted rules requiring Swap Dealers (as defined in the Dodd-Frank Act), including those that are regulated financial institutions, to collect initial and/or variation margin with respect to uncleared swaps from their counterparties that are financial end users, registered swap dealers or major swap participants. These rules do not require collection of margin from non-financial-entity end users who qualify for the end user exception from the mandatory clearing requirement or from non-financial end users or certain other counterparties in certain instances. We qualify as a non-financial-entity end user with respect to the swaps that we enter into to hedge our commercial risks.
Pursuant to the Dodd-Frank Act, the CFTC adopted additional anti-manipulation and anti-disruptive trading practices regulations that prohibit, among other things, manipulative, deceptive or fraudulent schemes or material misrepresentation in the futures, options, swaps and cash markets. In addition, separate from the Dodd-Frank Act, our use of futures and options on commodities is subject to the Commodity Exchange Act and CFTC regulations, as well as the rules of futures exchanges on which any of these instruments are executed. Should we violate any of these laws and regulations, we could be subject to a CFTC or an exchange enforcement action and material penalties, possibly resulting in changes in the rates we can charge.
United Kingdom /European Regulations
Our European trading activities, which are primarily established in and operated out of the United Kingdom (“UK”), are subject to a number of European Union (“EU”) and UK laws and regulations, including but not limited to:
•the European Market Infrastructure Regulation (“EMIR”), which was designed to increase the transparency and stability of the European Economic Area (“EEA”) derivatives markets;
•the Regulation on Wholesale Energy Market Integrity and Transparency (“REMIT”), which prohibits market manipulation and insider trading in EEA wholesale energy markets and imposes various transparency and other obligations on participants active in these markets;
•the Markets in Financial Instruments Directive and Regulation (“MiFID II”), which sets forth a financial services framework across the EEA, including rules for firms engaging in investment services and activities in connection with certain financial instruments, including a range of commodity derivatives; and
•the Market Abuse Regulation (“MAR”), which was implemented to create an enhanced market abuse framework, and which applies to all financial instruments listed or traded on EEA trading venues as well as other over-the-counter (“OTC”) financial instruments priced on, or impacting, the trading venue contract.
Following the UK's departure from the EU (“Brexit”), the EU-wide rules that applied to the UK while it was a member of the EU (and during the transition period) have been replicated, subject to certain amendments, to create a parallel set of rules applicable only in the UK. As a result, we are subject to two sets of substantively similar rules based on the same underlying legislation: (i) one set of rules that apply in the EEA (i.e. not including the UK) (the “EEA Rules”); and (ii) one set of rules that apply only in the UK (the “UK Onshored Rules”).
To the extent our trading activities have a nexus with the EEA, we comply with the EEA Rules. However, as our trading activities are primarily operated out of the UK, the main rules that impact and apply to us on a day-to-day basis are the UK Onshored Rules.
In particular, under the UK Onshored Rules, firms engaging in investment services and activities under UK MiFID II must be authorized unless an exemption applies, and we qualify for an exemption and therefore do not need to be authorized under UK MiFID II.
In addition to the UK Onshored Rules, we are also subject to a separate, UK-specific regime that is not based on prior EU/EEA legislation. This is primarily set out in the UK’s Financial Services and Markets Act 2000 (“FSMA”) and Financial Services and Markets Act 2000 (Regulated Activities) Order 2001 (“RAO”), which, among other things, governs the regulation of financial services and markets in the UK, and contains a definitive list of the specified kinds of activities and products that are regulated. Under these UK-specific rules, a firm engaging in regulated activities must be authorized unless an exclusion applies. We qualify under applicable exclusions and therefore are not required to be authorized under the UK FSMA/RAO regime.
Any violation of the foregoing laws and regulations could result in investigations, possible fines and penalties, and in some scenarios, criminal offenses, as well as reputational damage.
Brexit and Equivalence
The UK withdrew from the EU on January 31, 2020, with the transition period ending as of January 1, 2021. A trade deal (the “Deal”) was agreed and ratified by both the UK and the EU, avoiding a “no deal” Brexit.
One area notably absent from the Deal was financial services. The UK and EU are working towards formally agreeing a memorandum of understanding (the “MoU”) on access to financial services, the text of which was agreed in principle in March 2021. This was expected to be formally ratified and published in 2021, but so far this has not occurred. In any event, an MoU would be less far-reaching than a legal text such as an international treaty.
The issue of whether the UK's financial system will be granted “equivalence” by the EU (the scenario that would result in the least disruption and would treat compliance with UK rules as being equivalent to compliance with the corresponding EU rules) has not been resolved, and at present seems unlikely to be agreed. The UK also has the right to declare whether EU
financial services rules are “equivalent” to its own rules. Each side's equivalence decision will be made unilaterally, and could be withdrawn unilaterally as well.
Additionally, there is no guarantee that any equivalence decision, if granted, will be comprehensive across all financial services. In the meantime, UK firms must comply with the UK Onshored Rules.
Environmental Regulation
Our LNG terminals are subject to various federal, state and local laws and regulations relating to the protection of the environment and natural resources. These environmental laws and regulations require significant expenditures for compliance, can affect the cost and output of operations and may impose substantial penalties for non-compliance and substantial liabilities for pollution. Many of these laws and regulations, such as those noted below, restrict or prohibit impacts to the environment or the types, quantities and concentration of substances that can be released into the environment and can lead to substantial administrative, civil and criminal fines and penalties for non-compliance.
Clean Air Act
Our LNG terminals are subject to the federal CAA and comparable state and local laws. We may be required to incur certain capital expenditures over the next several years for air pollution control equipment in connection with maintaining or obtaining permits and approvals addressing air emission-related issues. We do not believe, however, that our operations, or the construction and operations of our liquefaction facilities, will be materially and adversely affected by any such requirements.
In 2009, the EPA promulgated and finalized the Mandatory Greenhouse Gas Reporting Rule requiring annual reporting of greenhouse gas (“GHG”) emissions from stationary sources in a variety of industries. In 2010, the EPA expanded the rule to include reporting obligations for LNG terminals. In addition, the EPA has defined GHG emissions thresholds that would subject GHG emissions from new and modified industrial sources to regulation if the source is subject to PSD Permit requirements due to its emissions of non-GHG criteria pollutants. While the EPA subsequently took a number of additional actions primarily relating to GHG emissions from the electric power generation and the oil and gas exploration and production industries, those rules were largely stayed or repealed during the Trump Administration including by amendments adopted by the EPA on February 23, 2018 and additional amendments to new source performance standards for the oil and gas industry on September 14 and 15, 2020. On November 15, 2021, the EPA proposed new regulations to reduce methane emissions from both new and existing sources within the Crude Oil and Natural Gas source category. The proposed regulations if finalized, would result in more stringent requirements for new sources, expand the types of new sources covered, and for the first time, establish emissions guidelines for existing sources in the Crude Oil and Natural Gas source category. We are supportive of regulations reducing GHG emissions over time.
From time to time, Congress has considered proposed legislation directed at reducing GHG emissions. In addition, many states have already taken regulatory action to monitor and/or reduce emissions of GHGs, primarily through the development of GHG emission inventories or regional GHG cap and trade programs. It is not possible at this time to predict how future regulations or legislation may address GHG emissions and impact our business. However, future regulations and laws could result in increased compliance costs, the imposition of taxes or fees related to GHG emissions or additional operating restrictions and could have a material adverse effect on our business, contracts, financial condition, operating results, cash flow, liquidity and prospects.
Coastal Zone Management Act (“CZMA”)
The siting and construction of our LNG terminals within the coastal zone is subject to the requirements of the CZMA. The CZMA is administered by the states (in Louisiana, by the Department of Natural Resources, and in Texas, by the General Land Office). This program is implemented to ensure that impacts to coastal areas are consistent with the intent of the CZMA to manage the coastal areas.
Clean Water Act
Our LNG terminals are subject to the federal CWA and analogous state and local laws. The CWA imposes strict controls on the discharge of pollutants into the navigable waters of the United States, including discharges of wastewater and storm water runoff and fill/discharges into waters of the United States. Permits must be obtained prior to discharging pollutants
into state and federal waters. The CWA is administered by the EPA, the USACE and by the states (in Louisiana, by the LDEQ, and in Texas, by the TCEQ). The CWA regulatory programs, including the Section 404 dredge and fill permitting program and Section 401 water quality certification program carried out by the states, are frequently the subject of shifting agency interpretations and legal challenges, which at times can result in permitting delays.
Resource Conservation and Recovery Act (“RCRA”)
The federal RCRA and comparable state statutes govern the generation, handling and disposal of solid and hazardous wastes and require corrective action for releases into the environment. When such wastes are generated in connection with the operations of our facilities, we are subject to regulatory requirements affecting the handling, transportation, treatment, storage and disposal of such wastes.
Protection of Species, Habitats and Wetlands
Various federal and state statutes, such as the Endangered Species Act, the Migratory Bird Treaty Act, the CWA and the Oil Pollution Act, prohibit certain activities that may adversely affect endangered or threatened animal, fish and plant species and/or their designated habitats, wetlands, or other natural resources. If one of our LNG terminals or pipelines adversely affects a protected species or its habitat, we may be required to develop and follow a plan to avoid those impacts. In that case, siting, construction or operation may be delayed or restricted and cause us to incur increased costs.
It is not possible at this time to predict how future regulations or legislation may address protection of species, habitats and wetlands and impact our business. However, we do not believe that our operations, or the construction and operations of our liquefaction facilities, will be materially and adversely affected by such regulatory actions.
Market Factors and Competition
Market Factors
Our ability to enter into additional long-term SPAs to underpin the development of additional Trains, sale of LNG by Cheniere Marketing, or development of new projects is subject to market factors. These factors include changes in worldwide supply and demand for natural gas, LNG and substitute products, the relative prices for natural gas, crude oil and substitute products in North America and international markets, the rate of fuel switching for power generation from coal, nuclear or oil to natural gas, economic growth in developing countries and other related factors such as the effects of the COVID-19 pandemic. In addition, our ability to obtain additional funding to execute our business strategy is subject to the investment community’s appetite for investment in LNG and natural gas infrastructure and our ability to access capital markets.
We expect that global demand for natural gas and LNG will continue to increase as nations seek more abundant, reliable and environmentally cleaner fuel alternatives to oil and coal. Players around the globe have shown commitments to environmental goals consistent with many policy initiatives that we believe are constructive for LNG demand and infrastructure growth. Currently, significant amounts of money are being invested across Europe and Asia in natural gas projects under construction, and more continues to be earmarked to planned projects globally. Some examples include India’s commitment to invest over $60 billion to usher a gas-based economy, around $100 billion earmarked for Europe’s gas infrastructure buildout, and China’s hundreds of billions all along the natural gas value chain. We highlight regasification capacity, which will not only expand existing import capacities in rapidly growing markets like China and India, but also add new import markets all over the globe, raising the total number of import markets to approximately 60 by 2030 from 43 in 2020 and just 15 markets as recently as 2005.
As a result of these dynamics, global demand for natural gas is projected by the International Energy Agency to grow by approximately 20 trillion cubic feet (“Tcf”) between 2020 and 2030 and 33 Tcf between 2020 and 2040. LNG’s share is seen growing from about 11% in 2020 to about 12% of the global gas market in 2030 and 14% in 2040. Wood Mackenzie Limited (“WoodMac”) forecasts that global demand for LNG will increase by approximately 57%, from 366.6 mtpa, or 17.6 Tcf, in 2020, to 576.5 mtpa, or 27.7 Tcf, in 2030 and to 734.5 mtpa or 35.3 Tcf in 2040. WoodMac also forecasts LNG production from existing operational facilities and new facilities already under construction will be able to supply the market with approximately 517 mtpa in 2030, declining to 456 mtpa in 2040. This could result in a market need for construction of an additional approximately 60 mtpa of LNG production by 2030 and about 279 mtpa by 2040. As a cleaner burning fuel with far lower emissions than coal or liquid fuels in power generation, we expect gas and LNG to play a central role in balancing grids
and contributing to a low carbon energy system globally. We believe the capital and operating costs of the uncommitted capacity of our Liquefaction Projects and Corpus Christi Stage 3 are competitive with new proposed projects globally and we are well-positioned to capture a portion of this incremental market need.
We have limited exposure to oil price movements as we have contracted a significant portion of our LNG production capacity under long-term sale and purchase agreements. These agreements contain fixed fees that are required to be paid even if the customers elect to cancel or suspend delivery of LNG cargoes. We have contracted approximately 95% of the total production capacity from the Liquefaction Projects, including those contracts executed to support Corpus Christi Stage 3. Substantially all of our contracted capacity is from contracts with terms exceeding 10 years. Excluding contracts with terms less than 10 years, our SPAs and IPM agreements had approximately 17 years of weighted average remaining life as of December 31, 2021.
Competition
Despite the long term nature of our SPAs, when SPL, CCL or our integrated marketing function need to replace or amend any existing SPA or enter into new SPAs, they will compete with each other and other natural gas liquefaction projects throughout the world on the basis of price per contracted volume of LNG at that time. Revenues associated with any incremental volumes, including those sold by our integrated marketing function, will also be subject to market-based price competition. Many of the companies with which we compete are major energy corporations with longer operating histories, more development experience, greater name recognition, greater financial, technical and marketing resources and greater access to LNG markets than us.
SPLNG currently does not experience competition for its terminal capacity because the entire approximately 4 Bcf/d of regasification capacity that is available at the Sabine Pass LNG terminal has been fully contracted. If and when SPLNG has to replace any TUAs, it will compete with other then-existing LNG terminals for customers.
Subsidiaries
Our assets are generally held by our subsidiaries. We conduct most of our business through these subsidiaries, including the development, construction and operation of our LNG terminal business and the development and operation of our LNG and natural gas marketing business.
Human Capital Resources
We are in a unique position as the first U.S. LNG company in the lower 48. As the first mover, ensuring that we attract, retain and develop skilled employees has been a crucial part of our ability to grow and succeed.
As of January 31, 2022, we had 1,550 full-time employees with 1,456 located in the U.S. and 94 located outside of the U.S. (primarily in the UK).
Our strength comes from the collective expertise of our diverse workforce and through our core values of teamwork, respect, accountability, integrity, nimble and safety (“TRAINS”). Our employees help drive our success, build our reputation, establish our legacy and deliver on our commitments to our customers. Through fulfilling career opportunities, training, development and a competitive compensation program, we aim to keep our employees engaged. Our voluntary turnover was 5.4% for 2021.
Our Chief Human Resources Officer, along with senior leadership, are tasked with managing employment-related matters and initiatives including talent attraction and retention, rewards and remuneration, employee relations, employee engagement, diversity and inclusion, and training and development. We communicate progress on our human capital programs to our board of directors (our “Board”) quarterly.
Talent Attraction, Engagement and Retention
Through our recruitment efforts, we seek diverse talent to drive our corporate strategies and goals. We actively recruit at colleges and conduct information sessions at select universities, including Historically Black Colleges and Universities (“HBCUs”) and Hispanic-Serving Institutions. Internally and externally, we post openings to attract individuals with a range of backgrounds, skills and experience, offering employee bonuses for referring highly qualified candidates.
We manage and measure organizational health with a view to gaining insight into employees’ experiences, levels of workplace satisfaction and feelings of engagement and inclusion with the company through biennial engagement surveys. Insights from the biennial survey are used to develop both company-wide and business unit level organizational and talent development plans and training programs.
Compensation and Benefits
We provide robust compensation and benefits programs to our employees. In addition to salaries, all employees are eligible for annual bonuses and stock awards. Benefit plans, which vary by country, include a 401(k) Plan, healthcare and insurance benefits, health savings and flexible spending accounts, paid time off, family leave, family care resources, employee assistance programs and tuition assistance. This year we have enhanced ESG-related performance criteria linked to annual incentive compensation, adding targets for actions on diversity, equity and inclusion (“DEI”) and climate change to our Health & Safety performance goals.
Diversity, Equity and Inclusion
We are committed to providing a diverse culture where all employees can thrive and feel welcomed and valued. To create this environment, we are committed to equal employment opportunity and to compliance with all federal, state and local laws that prohibit workplace discrimination, harassment and unlawful retaliation. Our Code of Business Conduct and Ethics, Cheniere’s TRAINS values and both our discrimination and harassment and equal employment opportunity policies demonstrate our commitment to building an inclusive workplace, regardless of race, beliefs, nationality, gender and sexual orientation or any other status protected by our policy. We have provided executives and senior management with DEI training and have begun providing Unconscious Bias training to all employees.
Through our targeted recruitment efforts, we attract a variety of candidates with a diversity of backgrounds, skills, experience and expertise. Since 2016, we have had a 20% increase in racially or ethnically diverse employees and a 24% increase in racially or ethnically diverse management. In the past five years, the percentage of female employees has remained generally consistent at approximately 27% and we have had a 22% increase in women in management positions. In 2021, we announced our multiyear commitment to the Thurgood Marshall College Fund of $500,000 in scholarships to students attending selected HBCUs. We also committed to other scholarships and community efforts throughout 2021 furthering our commitment to DEI.
We encourage our employees to leverage their unique backgrounds through involvement in various employee resource groups and employee networks. Groups such as WILS (Women Inspiring Leadership Success), EPN (Emerging Professional Network) and Cultural Champions Teams help build a culture of inclusion.
Development and Training
As the first exporter of LNG in the lower 48 of the US, we faced the unique challenge of developing our own LNG talent. Our apprenticeship program prepares local students for careers in LNG. This program combines classroom education with training and on-site learning experiences at our facilities.
We strive to provide our people with all of the tools and support necessary for them to succeed. We actively encourage our employees to take ownership of their careers and offer a number of resources to do so. Employees undergo annual performance reviews to encourage the ongoing development of their skills and expertise. To ensure safe, reliable and efficient operations in a highly regulated environment, we offer online and site-specific learning opportunities. We also provide employees, leaders and executives with targeted development programming to solidify internal talent pipelines and succession plans.
Employee Safety, Health and Wellness
The safety of our employees, contractors and communities is one of our core values. Our Cheniere Integrated Management System defines our required safety programs and details safety and health related procedures. Safety efforts are led by our Executive Safety Committee, which includes the Chief Executive Officer, senior leaders from across the company, and representatives from each of our operating assets. We focus our efforts on continuously improving our performance. For the year ended December 31, 2021, we had one employee recordable injury and seven contractor recordable injuries. Our total recordable incident rate (employees and contractors combined) was 0.10, placing us in the top quartile of industry benchmarks based on Bureau of Labor safety statistics.
To support the well-being of our employees, we provide a wellness program that offers employees incentives to maintain an active lifestyle and set personal wellness goals. Incentives include online education related to health, nutrition, emotional health and COVID-19 vaccinations, as well as subsidies for fitness devices and gym memberships. We also offer mammography screenings, rooms for nursing mothers and biometric screenings on site.
In our continuing response to the COVID-19 pandemic, we have implemented workplace controls and risk reduction measures that have enabled us to work through several periods of elevated regional impacts from COVID-19, including the Delta and Omicron variants. We took certain measures that allow the company to maintain our operations, keep our employees safe and react quickly to any new COVID-19 risks. We also provided the same level of resources, aid and support for weather-related disasters.
Available Information
Our common stock has been publicly traded since March 24, 2003 and is traded on the NYSE American under the symbol “LNG.” Our principal executive offices are located at 700 Milam Street, Suite 1900, Houston, Texas 77002, and our telephone number is (713) 375-5000. Our internet address is www.cheniere.com. We provide public access to our annual reports on Form 10-K, quarterly reports on Form 10-Q, current reports on Form 8-K and amendments to these reports as soon as reasonably practicable after we electronically file those materials with, or furnish those materials to, the SEC under the Exchange Act. These reports may be accessed free of charge through our internet website. We make our website content available for informational purposes only. The website should not be relied upon for investment purposes and is not incorporated by reference into this Form 10-K.
We will also make available to any stockholder, without charge, copies of our annual report on Form 10-K as filed with the SEC. For copies of this, or any other filing, please contact: Cheniere Energy, Inc., Investor Relations Department, 700 Milam Street Suite 1900, Houston, Texas 77002 or call (713) 375-5000. The SEC maintains an internet site (www.sec.gov) that contains reports, proxy and information statements and other information regarding issuers.
Additionally, we encourage you to review our Corporate Responsibility Report (located on our internet site at www.cheniere.com), for more detailed information regarding our Human Capital programs and initiatives, as well as our response to ESG issues. Nothing on our website, including our Corporate Responsibility Report or sections thereof, shall be deemed incorporated by reference into this Annual Report.
ITEM 1A. RISK FACTORS
The following are some of the important factors that could affect our financial performance or could cause actual results to differ materially from estimates or expectations contained in our forward-looking statements. We may encounter risks in addition to those described below. Additional risks and uncertainties not currently known to us, or that we currently deem to be immaterial, may also impair or adversely affect our business, contracts, financial condition, operating results, cash flows, liquidity and prospects.
The risk factors in this report are grouped into the following categories:
Risks Relating to Our Financial Matters
Our existing level of cash resources and significant debt could cause us to have inadequate liquidity and could materially and adversely affect our business, contracts, financial condition, operating results, cash flow, liquidity and prospects.
As of December 31, 2021, we had $1.4 billion of cash and cash equivalents, $413 million of restricted cash and cash equivalents, a total of $3.4 billion of available commitments under our credit facilities and $30.4 billion of total debt outstanding on a consolidated basis (before unamortized premium, discount and debt issuance costs). SPL, CQP, CCH and Cheniere operate with independent capital structures as further detailed in Note 11—Debt of our Notes to Consolidated Financial Statements. We incur, and will incur, significant interest expense relating to the assets at the Sabine Pass and Corpus Christi LNG terminals, and we anticipate incurring additional debt to finance the construction of Corpus Christi Stage 3. Our ability to fund our capital expenditures and refinance our indebtedness will depend on our ability to access additional project financing as well as the debt and equity capital markets. A variety of factors beyond our control could impact the availability or cost of capital, including domestic or international economic conditions, increases in key benchmark interest rates and/or credit spreads, the adoption of new or amended banking or capital market laws or regulations and the repricing of market risks and volatility in capital and financial markets. Our financing costs could increase or future borrowings or equity offerings may be unavailable to us or unsuccessful, which could cause us to be unable to pay or refinance our indebtedness or to fund our other liquidity needs. We also rely on borrowings under our credit facilities to fund our capital expenditures. If any of the lenders in the syndicates backing these facilities was unable to perform on its commitments, we may need to seek replacement financing, which may not be available as needed, or may be available in more limited amounts or on more expensive or otherwise unfavorable terms.
Our ability to generate cash is substantially dependent upon the performance by customers under long-term contracts that we have entered into, and we could be materially and adversely affected if any significant customer fails to perform its contractual obligations for any reason.
Our future results and liquidity are substantially dependent upon performance by our customers to make payments under long-term contracts. As of December 31, 2021, we had SPAs with terms of 10 or more years with a total of 24 different third party customers. In addition, SPLNG had TUAs with two third party customers.
While substantially all of our long-term third party customer arrangements are executed with a creditworthy parent company or secured by a parent company guarantee or other form of collateral, we are nonetheless exposed to credit risk in the event of a customer default that requires us to seek recourse.
Additionally, our long-term SPAs entitle the customer to terminate their contractual obligations upon the occurrence of certain events, which include, but are not limited to: (1) if we fail to make available specified scheduled cargo quantities; (2) delays in the commencement of commercial operations; and (3) under the majority of our SPAs, upon the occurrence of certain events of force majeure. Under each of SPLNG’s long-term TUAs, such termination events include, but are not limited to: if the Sabine Pass LNG terminal (1) experiences a force majeure delay for longer than 18 months; (2) fails to redeliver a specified amount of natural gas in accordance with the customer’s redelivery nominations; or (3) fails to accept and unload a specified number of the customer’s proposed LNG cargoes.
Although we have not had a history of material customer default or termination events, the occurrence of such events are largely outside of our control and may expose us to unrecoverable losses. We may not be able to replace these customer arrangements on desirable terms, or at all, if they are terminated. As a result, our business, contracts, financial condition, operating results, cash flow, liquidity and prospects could be materially and adversely affected.
Our subsidiaries may be restricted under the terms of their indebtedness from making distributions under certain circumstances, which may limit CQP’s ability to pay or increase distributions to us or inhibit our access to cash flows from the CCL Project and could materially and adversely affect us.
The agreements governing our subsidiaries’ indebtedness restrict payments that our subsidiaries can make to CQP or us in certain events and limit the indebtedness that our subsidiaries can incur. For example, SPL is restricted from making distributions under agreements governing its indebtedness generally until, among other requirements, deposits are made into debt service reserve accounts and a debt service coverage ratio of 1.25:1.00 is satisfied.
CCH is generally restricted from making distributions under agreements governing its indebtedness until, among other requirements, the completion of the construction of Trains 1 through 3 of the CCL Project, funding of a debt service reserve account equal to six months of debt service and achieving a historical debt service coverage ratio and fixed projected debt service coverage ratio of at least 1.25:1.00.
Our subsidiaries’ inability to pay distributions to CQP or us or to incur additional indebtedness as a result of the foregoing restrictions in the agreements governing their indebtedness may inhibit CQP’s ability to pay or increase distributions to us and its other unitholders or inhibit our access to cash flows from the CCL Project, which could have a material adverse effect on our business, contracts, financial condition, operating results, cash flow, liquidity and prospects.
Our efforts to manage commodity and financial risks through derivative instruments, including our IPM agreements, could adversely affect our results of operations and financial condition.
We use derivative instruments to manage commodity, currency and financial market risks. The extent of our derivative position at any given time depends on our assessments of the markets for these commodities and related exposures. We currently account for all derivatives at fair value, with immediate recognition of changes in the fair value in earnings. As described in Item 7. Management’s Discussion and Analysis of Financial Condition and Results of Operations—Results of Operations, our net loss attributable to common stockholders of $2.3 billion and $85 million for the years ended December 31, 2021 and 2020, respectively, was primarily due to derivative losses, with substantially all of such losses relating to commodity derivative instruments indexed to international LNG prices, mainly our IPM agreements. These transactions and other derivative transactions have and may continue to result in substantial volatility in reported results of operations, particularly in periods of significant commodity, currency or financial market variability, or as a result of ineffectiveness of these contracts. For certain of these instruments, in the absence of actively quoted market prices and pricing information from external sources, the value of these financial instruments involves management’s judgment or use of estimates. Changes in the underlying assumptions or use of alternative valuation methods could affect the reported fair value of these contracts.
In addition, our liquidity may be adversely impacted by the cash margin requirements of the commodities exchanges or the failure of a counterparty to perform in accordance with a contract.
Restrictions in agreements governing us and our subsidiaries’ indebtedness may prevent us and our subsidiaries from engaging in certain beneficial transactions, which could materially and adversely affect us.
In addition to restrictions on the ability of us, CQP, SPL and CCH to make distributions or incur additional indebtedness, the agreements governing our indebtedness also contain various other covenants that may prevent us from engaging in beneficial transactions, including limitations on our ability to:
•make certain investments;
•purchase, redeem or retire equity interests;
•issue preferred stock;
•sell or transfer assets;
•incur liens;
•enter into transactions with affiliates;
•consolidate, merge, sell or lease all or substantially all of our assets; and
•enter into sale and leaseback transactions.
Any restrictions on the ability to engage in beneficial transactions could materially and adversely affect us.
The market price of our common stock has fluctuated significantly in the past and is susceptible to fluctuations in the future due to market volatility and other factors. Our stockholders could lose all or part of their investment.
The market price of our common stock has historically experienced and may continue to experience volatility. For example, during the three-year period ended December 31, 2021, the market price of our common stock ranged between $27.06 and $113.40. Such fluctuations may continue as a result of a variety of factors, some of which are beyond our control, including:
•domestic and worldwide supply of and demand for natural gas and corresponding fluctuations in the price of natural gas;
•sales of a high volume of shares of our common stock by our stockholders;
•operating and stock price performance of companies that investors deem comparable to us;
•events affecting other companies that the market deems comparable to us;
•changes in government regulation or proposals applicable to us;
•actual or potential non-performance by any customer or a counterparty under any agreement;
•announcements made by us or our competitors of significant contracts;
•changes in accounting standards, policies, guidance, interpretations or principles;
•general conditions in the industries in which we operate;
•general economic conditions;
•the failure of securities analysts to cover our common stock or changes in financial or other estimates by analysts;
•changes in investor sentiment regarding the energy industry and fossil fuels;
•other factors described in these “Risk Factors.”
In addition, the United States securities markets have experienced significant price and volume fluctuations. These fluctuations have often been unrelated to the operating performance of companies in these markets. Market fluctuations and broad market, economic and industry factors may negatively affect the price of our common stock, regardless of our operating performance. If we were to be the object of securities class litigation as a result of volatility in our common stock price or for other reasons, it could result in substantial diversion of our management’s attention and resources, which could negatively affect our financial results.
Our ability to declare and pay dividends and repurchase shares is subject to certain considerations.
Dividends are authorized and determined by our Board in its sole discretion and depend upon a number of factors, including:
•Cash available for distribution;
•Our results of operations and anticipated future results of operations;
•Our financial condition, especially in relation to the anticipated future capital needs of any expansion of our Liquefaction Facilities;
•The level of distributions paid by comparable companies;
•Our operating expenses; and
•Other factors our Board deems relevant.
We expect to continue to pay quarterly dividends to our stockholders; however, our Board may reduce our dividend or cease declaring dividends at any time, including if it determines that our net cash provided by operating activities, after deducting capital expenditures and investments, are not sufficient to pay our desired levels of dividends to our stockholders or to pay dividends to our stockholders at all.
Additionally as of December 31, 2021, $998 million of repurchase authority remained of the $1 billion share repurchase program our Board had authorized. Our share repurchase program does not obligate us to acquire a specific number of shares during any period, and our decision to commence, discontinue or resume repurchases in any period will depend on the same factors that our Board may consider when declaring dividends, among others.
Any downward revision in the amount of dividends we pay to stockholders or the number of shares we purchase under our share repurchase program could have an adverse effect on the market price of our common stock.
We may sell equity or equity-related securities or assets, including equity interests in CQP. Such sales could dilute our proportionate interests in our assets, business operations and proposed projects of CQP or other subsidiaries, and could adversely affect the market price of our common stock.
We have historically pursued a number of alternatives in order to finance the construction of our Trains, including potential issuances and sales of additional equity or equity-related securities by our subsidiaries. Such sales, in one or more transactions, could dilute our proportionate indirect interests in our assets, business operations and proposed projects of CQP, including the SPL Project, or in other subsidiaries or projects, including the CCL Project. In addition, such sales, or the anticipation of such sales, could adversely affect the market price of our common stock.
Risks Relating to Our Operations and Industry
Catastrophic weather events or other disasters could result in an interruption of our operations, a delay in the completion of our Liquefaction Projects, damage to our Liquefaction Projects and increased insurance costs, all of which could adversely affect us.
Hurricanes Katrina and Rita in 2005, Hurricane Ike in 2008, Hurricane Harvey in 2017, Hurricanes Laura and Delta in 2020 and Winter Storm Uri in 2021 caused interruptions or temporary suspension in construction or operations at our facilities or caused minor damage to our facilities. Future storms and related storm activity and collateral effects, or other disasters such as explosions, fires, floods or accidents, could result in damage to, or interruption of operations at, the Sabine Pass LNG terminal, the Corpus Christi LNG terminal or related infrastructure, as well as delays or cost increases in the construction and the development of the Liquefaction Projects, Corpus Christi Stage 3 or our other facilities and increase our insurance premiums. The U.S. Global Change Research Program has reported that the U.S.’s energy and transportation systems are expected to be increasingly disrupted by climate change and extreme weather events. An increase in frequency and severity of extreme weather events such as storms, floods, fires and rising sea levels could have an adverse effect on our operations.
Our ability to complete development of additional Trains, including Corpus Christi Stage 3, will be contingent on our ability to obtain additional funding. If we are unable to obtain sufficient funding, we may be unable to fully execute our business strategy.
We continuously pursue liquefaction expansion opportunities and other projects along the LNG value chain. As described further in Items 1. and 2. Business and Properties, we are currently developing the Corpus Christi Stage 3 project, which includes an expansion adjacent to the CCL Project for up to seven midscale Trains with an expected total production capacity of over 10 mtpa of LNG. The commercial development of an LNG facility takes a number of years and requires a substantial capital investment that is dependent on sufficient funding and commercial interest, among other factors.
We will require significant additional funding to be able to commence construction of Corpus Christi Stage 3, and any additional expansion projects, which we may not be able to obtain at a cost that results in positive economics, or at all. The inability to achieve acceptable funding may cause a delay in the development of Corpus Christi Stage 3, or any additional expansion projects, and we may not be able to complete our business plan, which could have a material adverse effect on our business, contracts, financial condition, operating results, cash flow, liquidity and prospects.
Cost overruns and delays in the completion of our expansion projects, including Corpus Christi Stage 3, as well as difficulties in obtaining sufficient financing to pay for such costs and delays, could have a material adverse effect on our business, contracts, financial condition, operating results, cash flow, liquidity and prospects.
While we expect to reach FID on Corpus Christi Stage 3, our investment decision on the project and any potential future LNG facilities relies on cost estimates developed initially through front end engineering and design studies. However, due to the size and duration of construction of an LNG facility, the actual construction costs may be significantly higher than our current estimates as a result of many factors, including but not limited to changes in scope, the ability of Bechtel and our other contractors to execute successfully under their agreements, changes in commodity prices (particularly nickel and steel), escalating labor costs and the potential need for additional funds to be expended to maintain construction schedules or comply with existing or future environmental or other regulations. As construction progresses, we may decide or be forced to submit change orders to our contractor that could result in longer construction periods, higher construction costs or both, including change orders to comply with existing or future environmental or other regulations. Additionally, our SPAs generally provide that the customer may terminate that SPA if the relevant Train does not timely commence commercial operations. As a result, any significant construction delay, whatever the cause, could have a material adverse impact on our business, contracts, financial condition, operating results, cash flow, liquidity and prospects.
Significant increases in the cost of a liquefaction project beyond the amounts that we estimate could impact the commercial viability of the project as well as require us to obtain additional sources of financing to fund our operations until the applicable liquefaction project is fully constructed (which could cause further delays), thereby negatively impacting our business and limiting our growth prospects. While historically we have not experienced cost overruns or construction delays that have had a significant adverse impact on our operations, factors giving rise to such events in the future may be outside of our control and could have a material adverse effect on our current or future business, contracts, financial condition, operating results, cash flow, liquidity and prospects.
Disruptions to the third party supply of natural gas to our pipelines and facilities could have a material adverse effect on our business, contracts, financial condition, operating results, cash flow, liquidity and prospects.
We depend upon third party pipelines and other facilities that provide gas delivery options to our liquefaction facilities and pipelines. If the construction of new or modified pipeline connections is not completed on schedule or any pipeline connection were to become unavailable for current or future volumes of natural gas due to repairs, damage to the facility, lack of capacity, failure to replace contracted firm pipeline transportation capacity on economic terms, or any other reason, our ability to receive natural gas volumes to produce LNG or to continue shipping natural gas from producing regions or to end markets could be adversely impacted. Any significant disruption to our natural gas supply could result in a substantial reduction in our revenues under our long-term SPAs or other customer arrangements, which could have a material adverse effect on our business, contracts, financial condition, operating results, cash flow, liquidity and prospects.
We may not be able to purchase or receive physical delivery of sufficient natural gas to satisfy our delivery obligations under the SPAs, which could have a material adverse effect on us.
Under the SPAs with our customers, we are required to make available to them a specified amount of LNG at specified times. However, we may not be able to purchase or receive physical delivery of sufficient quantities of natural gas to satisfy those obligations, which may provide affected SPA customers with the right to terminate their SPAs. Our failure to purchase or receive physical delivery of sufficient quantities of natural gas could have a material adverse effect on our business, contracts, financial condition, operating results, cash flow, liquidity and prospects.
We are subject to significant construction and operating hazards and uninsured risks, one or more of which may create significant liabilities and losses for us.
The construction and operation of our LNG terminals and our pipelines are, and will be, subject to the inherent risks associated with these types of operations, including explosions, breakdowns or failures of equipment, operational errors by vessel or tug operators, pollution, release of toxic substances, fires, hurricanes and adverse weather conditions and other hazards, each of which could result in significant delays in commencement or interruptions of operations and/or in damage to or destruction of our facilities or damage to persons and property. In addition, our operations and the facilities and vessels of third parties on which our operations are dependent face possible risks associated with acts of aggression or terrorism.
We do not, nor do we intend to, maintain insurance against all of these risks and losses. We may not be able to maintain desired or required insurance in the future at rates that we consider reasonable. The occurrence of a significant event not fully insured or indemnified against could have a material adverse effect on our business, contracts, financial condition, operating results, cash flow, liquidity and prospects.
We are dependent on our EPC partners and other contractors for the successful completion of the Liquefaction Projects and any potential expansion projects, including Corpus Christi Stage 3.
Timely and cost-effective completion of the Liquefaction Projects and any potential expansion projects in compliance with agreed specifications is central to our business strategy and is highly dependent on the performance of our EPC partners, including Bechtel, and our other contractors under their agreements. The ability of our EPC partners and our other contractors to perform successfully under their agreements is dependent on a number of factors, including their ability to:
•design and engineer each Train to operate in accordance with specifications;
•engage and retain third party subcontractors and procure equipment and supplies;
•respond to difficulties such as equipment failure, delivery delays, schedule changes and failure to perform by subcontractors, some of which are beyond their control;
•attract, develop and retain skilled personnel, including engineers;
•post required construction bonds and comply with the terms thereof;
•manage the construction process generally, including coordinating with other contractors and regulatory agencies; and
•maintain their own financial condition, including adequate working capital.
Although some agreements may provide for liquidated damages if the contractor fails to perform in the manner required with respect to certain of its obligations, the events that trigger a requirement to pay liquidated damages may delay or impair the operation of the Liquefaction Projects or any expansion projects, and any liquidated damages that we receive may not be sufficient to cover the damages that we suffer as a result of any such delay or impairment. The obligations of EPC partners and our other contractors to pay liquidated damages under their agreements are subject to caps on liability, as set forth therein.
Furthermore, we may have disagreements with our contractors about different elements of the construction process, which could lead to the assertion of rights and remedies under their contracts and increase the cost of the Liquefaction Projects and any potential expansion project or result in a contractor’s unwillingness to perform further work. If any contractor is unable or unwilling to perform according to the negotiated terms and timetable of its respective agreement for any reason or terminates its agreement, we would be required to engage a substitute contractor. This would likely result in significant project delays and increased costs, which could have a material adverse effect on our business, contracts, financial condition, operating results, cash flow, liquidity and prospects.
There may be impediments to the transport of LNG, such as shortages of LNG vessels worldwide or operational impacts on LNG shipping, including maritime transportation routes, which could have a material adverse effect on our business, contracts, financial condition, operating results, cash flow, liquidity and prospects.
The construction and delivery of LNG vessels require significant capital and long construction lead times. Additionally, the availability of LNG vessels and transportation costs could be impacted to the detriment of our business and our customers because of:
•an inadequate number of shipyards constructing LNG vessels and a backlog of orders at these shipyards;
•shortages of or delays in the receipt of necessary construction materials;
•political or economic disturbances;
•acts of war or piracy;
•changes in governmental regulations or maritime self-regulatory organizations;
•work stoppages or other labor disturbances;
•bankruptcy or other financial crisis of shipbuilders or shipowners;
•quality or engineering problems;
•disruptions to maritime transportation routes; and
•weather interference or a catastrophic event, such as a major earthquake, tsunami or fire.
Cyclical or other changes in the demand for and price of LNG and natural gas may adversely affect our LNG business and the performance of our customers and could have a material adverse effect on our business, contracts, financial condition, operating results, cash flow, liquidity and prospects.
Our LNG business and the development of domestic LNG facilities and projects generally is based on assumptions about the future availability and price of natural gas and LNG, and the prospects for international natural gas and LNG markets. Natural gas and LNG prices have been, and are likely to continue to be, volatile and subject to wide fluctuations in response to one or more of the following factors:
•competitive liquefaction capacity in North America;
•insufficient or oversupply of natural gas liquefaction or receiving capacity worldwide;
•insufficient LNG tanker capacity;
•weather conditions, including temperature volatility resulting from climate change, and extreme weather events may lead to unexpected distortion in the balance of international LNG supply and demand. For example, LNG procurement in Japan rose dramatically in 2011 and several years thereafter following a tsunami that caused extensive destruction to its nuclear power infrastructure;
•reduced demand and lower prices for natural gas;
•increased natural gas production deliverable by pipelines, which could suppress demand for LNG;
•decreased oil and natural gas exploration activities which may decrease the production of natural gas, including as a result of any potential ban on production of natural gas through hydraulic fracturing;
•cost improvements that allow competitors to provide natural gas liquefaction capabilities at reduced prices;
•changes in supplies of, and prices for, alternative energy sources such as coal, oil, nuclear, hydroelectric, wind and solar energy, which may reduce the demand for natural gas;
•changes in regulatory, tax or other governmental policies regarding imported or exported LNG, natural gas or alternative energy sources, which may reduce the demand for imported or exported LNG and/or natural gas;
•political conditions in natural gas producing regions;
•sudden decreases in demand for LNG as a result of natural disasters or public health crises, including the occurrence of a pandemic, and other catastrophic events;
•adverse relative demand for LNG compared to other markets, which may decrease LNG imports into or exports from North America; and
•cyclical trends in general business and economic conditions that cause changes in the demand for natural gas.
Adverse trends or developments affecting any of these factors could result in decreases in the price of LNG and/or natural gas, which could materially and adversely affect the performance of our customers, and could have a material adverse effect on our business, contracts, financial condition, operating results, cash flow, liquidity and prospects.
Failure of imported or exported LNG to be a competitive source of energy for the United States or international markets could adversely affect our customers and could materially and adversely affect our business, contracts, financial condition, operating results, cash flow, liquidity and prospects.
Operations of the Liquefaction Projects are dependent upon the ability of our SPA customers to deliver LNG supplies from the United States, which is primarily dependent upon LNG being a competitive source of energy internationally. The success of our business plan is dependent, in part, on the extent to which LNG can, for significant periods and in significant volumes, be supplied from North America and delivered to international markets at a lower cost than the cost of alternative energy sources. Through the use of improved exploration technologies, additional sources of natural gas may be discovered
outside the United States, which could increase the available supply of natural gas outside the United States and could result in natural gas in those markets being available at a lower cost than LNG exported to those markets.
Although SPL has entered into arrangements to utilize up to approximately three-quarters of the regasification capacity at the Sabine Pass LNG terminal in connection with operations of the SPL Project, operations at the Sabine Pass LNG terminal are dependent, in part, upon the ability of our TUA customers to import LNG supplies into the United States, which is primarily dependent upon LNG being a competitive source of energy in North America. In North America, due mainly to a historically abundant supply of natural gas and discoveries of substantial quantities of unconventional, or shale, natural gas, imported LNG has not developed into a significant energy source. The success of the regasification services component of our business plan is dependent, in part, on the extent to which LNG can, for significant periods and in significant volumes, be produced internationally and delivered to North America at a lower cost than the cost to produce some domestic supplies of natural gas, or other alternative energy sources. Through the use of improved exploration technologies, additional sources of natural gas have recently been and may continue to be discovered in North America, which could further increase the available supply of natural gas and could result in natural gas being available at a lower cost than imported LNG.
Political instability in foreign countries that import or export natural gas, or strained relations between such countries and the United States, may also impede the willingness or ability of LNG purchasers or suppliers and merchants in such countries to import or export LNG from or to the United States. Furthermore, some foreign purchasers or suppliers of LNG may have economic or other reasons to obtain their LNG from, or direct their LNG to, non-U.S. markets or from or to our competitors’ liquefaction or regasification facilities in the United States.
In addition to natural gas, LNG also competes with other sources of energy, including coal, oil, nuclear, hydroelectric, wind and solar energy. LNG from the Liquefaction Projects also competes with other sources of LNG, including LNG that is priced to indices other than Henry Hub. Some of these sources of energy may be available at a lower cost than LNG from the Liquefaction Projects in certain markets. The cost of LNG supplies from the United States, including the Liquefaction Projects, may also be impacted by an increase in natural gas prices in the United States.
As a result of these and other factors, LNG may not be a competitive source of energy in the United States or internationally. The failure of LNG to be a competitive supply alternative to local natural gas, oil and other alternative energy sources in markets accessible to our customers could adversely affect the ability of our customers to deliver LNG from the United States or to the United States on a commercial basis. Any significant impediment to the ability to deliver LNG to or from the United States generally, or to the Sabine Pass LNG terminal or the Corpus Christi LNG terminal or from the Liquefaction Projects specifically, could have a material adverse effect on our customers and on our business, contracts, financial condition, operating results, cash flow, liquidity and prospects.
We face competition based upon the international market price for LNG.
Our Liquefaction Projects are subject to the risk of LNG price competition at times when we need to replace any existing SPA, whether due to natural expiration, default or otherwise, or enter into new SPAs. Factors relating to competition may prevent us from entering into a new or replacement SPA on economically comparable terms as existing SPAs, or at all. Such an event could have a material adverse effect on our business, contracts, financial condition, operating results, cash flow, liquidity and prospects. Factors which may negatively affect potential demand for LNG from our Liquefaction Projects are diverse and include, among others:
•increases in worldwide LNG production capacity and availability of LNG for market supply;
•increases in demand for LNG but at levels below those required to maintain current price equilibrium with respect to supply;
•increases in the cost to supply natural gas feedstock to our Liquefaction Projects;
•decreases in the cost of competing sources of natural gas or alternate fuels such as coal, heavy fuel oil and diesel;
•decreases in the price of non-U.S. LNG, including decreases in price as a result of contracts indexed to lower oil prices;
•increases in capacity and utilization of nuclear power and related facilities; and
•displacement of LNG by pipeline natural gas or alternate fuels in locations where access to these energy sources is not currently available.
A cyber attack involving our business, operational control systems or related infrastructure, or that of third party pipelines which supply the Liquefaction Facilities, could negatively impact our operations, result in data security breaches, impede the processing of transactions or delay financial or compliance reporting. These impacts could materially and adversely affect our business, contracts, financial condition, operating results, cash flow and liquidity.
The pipeline and LNG industries are increasingly dependent on business and operational control technologies to conduct daily operations. We rely on control systems, technologies and networks to run our business and to control and manage our trading, marketing, pipeline, liquefaction and shipping operations. Cyber attacks on businesses have escalated in recent years, including as a result of geopolitical tensions, and use of the internet, cloud services, mobile communication systems and other public networks exposes our business and that of other third parties with whom we do business to potential cyber attacks, including third party pipelines which supply natural gas to our Liquefaction Facilities. For example, in 2021 Colonial Pipeline suffered a ransomware attack that led to the complete shutdown of its pipeline system for six days. Should a multiple of the third party pipelines which supply our Liquefaction Facilities suffer similar concurrent attacks, the Liquefaction Facilities may not be able to obtain sufficient natural gas to operate at full capacity, or at all. A cyber attack involving our business or operational control systems or related infrastructure, or that of third party pipelines with which we do business, could negatively impact our operations, result in data security breaches, impede the processing of transactions, or delay financial or compliance reporting. These impacts could materially and adversely affect our business, contracts, financial condition, operating results, cash flow and liquidity.
We may experience increased labor costs, and the unavailability of skilled workers or our failure to attract and retain qualified personnel could adversely affect us. In addition, changes in our senior management or other key personnel could affect our business results.
We are dependent upon the available labor pool of skilled employees. We compete with other energy companies and other employers to attract and retain qualified personnel with the technical skills and experience required to construct and operate our facilities and pipelines and to provide our customers with the highest quality service. We are also subject to the Fair Labor Standards Act, which governs such matters as minimum wage, overtime and other working conditions. A shortage in the labor pool of skilled workers, remoteness of our site locations or other general inflationary pressures, changes in applicable laws and regulations or labor disputes could make it more difficult for us to attract and retain qualified personnel and could require an increase in the wage and benefits packages that we offer, thereby increasing our operating costs. Any increase in our operating costs could materially and adversely affect our business, contracts, financial condition, operating results, cash flow, liquidity and prospects.
We depend on our executive officers for various activities. We do not maintain key person life insurance policies on any of our personnel. Although we have arrangements relating to compensation and benefits with certain of our executive officers, we do not have any employment contracts or other agreements with key personnel other than our employment agreement with our President and Chief Executive Officer binding them to provide services for any particular term. The loss of the services of any of these individuals could have a material adverse effect on our business.
Outbreaks of infectious diseases, such as the outbreak of COVID-19, at one or more of our facilities could adversely affect our operations.
Our facilities at the Sabine Pass LNG terminal and Corpus Christi LNG terminal are critical infrastructure and have continued to operate during the COVID-19 pandemic through our implementation of workplace controls and pandemic risk reduction measures. While the COVID-19 pandemic, including the Delta and Omicron variants, has had no adverse impact on our on-going operations during this time, the risk of future variants is unknown. While we believe we can continue to mitigate any significant adverse impact to our employees and operations at our critical facilities related to the virus in its current form, the outbreak of a more potent variant in the future at one or more of our facilities could adversely affect our operations.
Risks Relating to Regulations
Failure to obtain and maintain approvals and permits from governmental and regulatory agencies with respect to the design, construction and operation of our facilities, the development and operation of our pipelines and the export of LNG could impede operations and construction and could have a material adverse effect on us.
The design, construction and operation of interstate natural gas pipelines, LNG terminals, including the Liquefaction Projects, Corpus Christi Stage 3 and other facilities, as well as the import and export of LNG and the purchase and transportation of natural gas, are highly regulated activities. Approvals of the FERC and DOE under Section 3 and Section 7 of the NGA, as well as several other material governmental and regulatory approvals and permits, including several under the CAA and the CWA, are required in order to construct and operate an LNG facility and an interstate natural gas pipeline and export LNG.
To date, the FERC has issued orders under Section 3 of the NGA authorizing the siting, construction and operation of the six Trains and related facilities of the SPL Project, the three Trains and related facilities of the CCL Project and the seven midscale Trains and related facilities for Corpus Christi Stage 3, as well as orders under Section 7 of the NGA authorizing the construction and operation of the Creole Trail Pipeline, the Corpus Christi Pipeline and the pipeline for Corpus Christi Stage 3. To date, the DOE has also issued orders under Section 4 of the NGA authorizing SPL, CCL and Corpus Christi Stage 3 to export domestically produced LNG. Additionally, we hold certificates under Section 7(c) of the NGA that grant us land use rights relating to the situation of our pipelines on land owned by third parties. If we were to lose these rights or be required to relocate our pipelines, our business could be materially and adversely affected.
Authorizations obtained from the FERC, DOE and other federal and state regulatory agencies contain ongoing conditions that we must comply with. Failure to comply with such conditions, or our inability to obtain and maintain existing or newly imposed approvals and permits, filings, which may arise due to factors outside of our control such as a U.S. government disruption or shutdown, political opposition or local community resistance to the siting of LNG facilities due to safety, environmental or security concerns, could impede the operation and construction of our infrastructure. There is no assurance that we will obtain and maintain these governmental permits, approvals and authorizations, or that we will be able to obtain them on a timely basis. Any impediment could have a material adverse effect on our business, contracts, financial condition, operating results, cash flow, liquidity and prospects.
Our interstate natural gas pipelines and their FERC gas tariffs are subject to FERC regulation. If we fail to comply with such regulations, we could be subject to substantial penalties and fines.
Our interstate natural gas pipelines are subject to regulation by the FERC under the NGA and the Natural Gas Policy Act of 1978 (the “NGPA”). The FERC regulates the purchase and transportation of natural gas in interstate commerce, including the construction and operation of pipelines, the rates, terms and conditions of service and abandonment of facilities. Under the NGA, the rates charged by our interstate natural gas pipelines must be just and reasonable, and we are prohibited from unduly preferring or unreasonably discriminating against any person with respect to pipeline rates or terms and conditions of service. If we fail to comply with all applicable statutes, rules, regulations and orders, our interstate pipelines could be subject to substantial penalties and fines.
In addition, as a natural gas market participant, should we fail to comply with all applicable FERC-administered statutes, rules, regulations and orders, we could be subject to substantial penalties and fines. Under the EPAct, the FERC has civil penalty authority under the NGA and the NGPA to impose penalties for current violations of up to $1.3 million per day for each violation.
Existing and future environmental and similar laws and governmental regulations could result in increased compliance costs or additional operating costs or construction costs and restrictions.
Our business is and will be subject to extensive federal, state and local laws, rules and regulations applicable to our construction and operation activities relating to, among other things, air quality, water quality, waste management, natural resources and health and safety. Many of these laws and regulations, such as the CAA, the Oil Pollution Act, the CWA and the RCRA, and analogous state laws and regulations, restrict or prohibit the types, quantities and concentration of substances that can be released into the environment in connection with the construction and operation of our facilities, and require us to maintain permits and provide governmental authorities with access to our facilities for inspection and reports related to our
compliance. In addition, certain laws and regulations authorize regulators having jurisdiction over the construction and operation of our LNG terminals and pipelines, including FERC and PHMSA, to issue compliance orders, which may restrict or limit operations or increase compliance or operating costs. Violation of these laws and regulations could lead to substantial liabilities, compliance orders, fines and penalties or to capital expenditures that could have a material adverse effect on our business, contracts, financial condition, operating results, cash flow, liquidity and prospects. Federal and state laws impose liability, without regard to fault or the lawfulness of the original conduct, for the release of certain types or quantities of hazardous substances into the environment. As the owner and operator of our facilities, we could be liable for the costs of cleaning up hazardous substances released into the environment at or from our facilities and for resulting damage to natural resources.
In 2009, the EPA promulgated and finalized the Mandatory Greenhouse Gas Reporting Rule requiring annual reporting of GHG emissions from stationary sources in a variety of industries. In 2010, the EPA expanded the rule to include reporting obligations for LNG terminals. In addition, the EPA has defined GHG emissions thresholds that would subject GHG emissions from new and modified industrial sources to regulation if the source is subject to PSD Permit requirements due to its emissions of non-GHG criteria pollutants. While the EPA subsequently took a number of additional actions primarily relating to GHG emissions from the electric power generation and the oil and gas exploration and production industries, those rules were largely stayed or repealed during the Trump Administration including by amendments adopted by the EPA on February 23, 2018 and additional amendments to new source performance standards for the oil and gas industry on September 14 and 15, 2020. On November 15, 2021, the EPA proposed new regulations to reduce methane emissions from both new and existing sources within the Crude Oil and Natural Gas source category. The proposed regulations, if finalized, would result in more stringent requirements for new sources, expand the types of new sources covered, and for the first time, establish emissions guidelines for existing sources in the Crude Oil and Natural Gas source category. In addition, other federal and state initiatives may be considered in the future to address GHG emissions through, for example, United States treaty commitments, direct regulation, market-based regulations such as a carbon emissions tax or cap-and-trade programs or clean energy standards. Such initiatives could affect the demand for or cost of natural gas, which we consume at our terminals, or could increase compliance costs for our operations. We are supportive of regulations reducing GHG emissions over time.
Other future legislation and regulations, such as those relating to the transportation and security of LNG imported to or exported from our terminals or climate policies of destination countries in relation to their obligations under the Paris Agreement or other national climate change-related policies, could cause additional expenditures, restrictions and delays in our business and to our proposed construction activities, the extent of which cannot be predicted and which may require us to limit substantially, delay or cease operations in some circumstances. Revised, reinterpreted or additional laws and regulations that result in increased compliance costs or additional operating or construction costs and restrictions could have a material adverse effect on our business, contracts, financial condition, operating results, cash flow, liquidity and prospects.
Pipeline safety and compliance programs and repairs may impose significant costs and liabilities on us.
The PHMSA requires pipeline operators to develop management programs to safely operate and maintain their pipelines and to comprehensively evaluate certain areas along their pipelines and take additional measures where necessary to protect pipeline segments located in “high or moderate consequence areas” where a leak or rupture could potentially do the most harm. As an operator, we are required to:
•perform ongoing assessments of pipeline safety and compliance;
•identify and characterize applicable threats to pipeline segments that could impact a “high consequence area”;
•improve data collection, integration and analysis;
•repair and remediate the pipeline as necessary; and
•implement preventative and mitigating actions.
We are required to maintain pipeline integrity testing programs that are intended to assess pipeline integrity. Any repair, remediation, preventative or mitigating actions may require significant capital and operating expenditures. Should we fail to comply with applicable statutes and the Office of Pipeline Safety’s rules and related regulations and orders, we could be subject to significant penalties and fines, which for certain violations can aggregate up to as high as $2.3 million.
Additions or changes in tax laws and regulations could potentially affect our financial results.
We are subject to various types of tax arising from normal business operations in the jurisdictions in which we operate and transact. Any changes to local, domestic or international tax laws and regulations, or their interpretation and application, including those with retroactive effect, could affect our tax obligations, profitability and cash flows in the future.
Additionally, there have been a number of tax reform proposals introduced in Congress recently that have proposed applying a corporate level tax to oil and gas master limited partnerships, such as CQP. If such a proposal were to be enacted, it would represent a substantial departure from current tax law, subjecting CQP to an entity level corporate tax, which could adversely impact the cash distributions that we receive from CQP. In addition, tax rates in the various jurisdictions in which we operate may change significantly due to political or economic factors beyond our control. We continuously monitor and assess proposed tax legislation that could negatively impact our business.
ITEM 1B. UNRESOLVED STAFF COMMENTS
None.
ITEM 3. LEGAL PROCEEDINGS
We may in the future be involved as a party to various legal proceedings, which are incidental to the ordinary course of business. We regularly analyze current information and, as necessary, provide accruals for probable liabilities on the eventual disposition of these matters.
LDEQ Matter
Certain of our subsidiaries are in discussions with the LDEQ to resolve self-reported deviations arising from operation of the Sabine Pass LNG terminal and the commissioning of the SPL Project, and relating to certain requirements under its Title V Permit. The matter involves deviations self-reported to LDEQ pursuant to the Title V Permit and covering the time period from January 1, 2012 through March 25, 2016. On April 11, 2016, certain of our subsidiaries received a Consolidated Compliance Order and Notice of Potential Penalty (the “Compliance Order”) from LDEQ covering deviations self-reported during that time period. Certain of our subsidiaries continue to work with LDEQ to resolve the matters identified in the Compliance Order. We do not expect that any ultimate sanction will have a material adverse impact on our financial results.
PHMSA Matter
In February 2018, the PHMSA issued a Corrective Action Order (the “CAO”) to SPL in connection with a minor LNG leak from one tank and minor vapor release from a second tank at the Sabine Pass LNG terminal (the “2018 SPL tank incident”). These two tanks have been taken out of operational service while we conduct analysis, repair and remediation. On April 20, 2018, SPL and PHMSA executed a Consent Agreement and Order (the “Consent Order”) that replaces and supersedes the CAO. On July 9, 2019, PHMSA and FERC issued a joint letter setting out operating conditions required to be met prior to SPL returning the tanks to service. In July 2021, PHMSA issued a Notice of Probable Violation (“NOPV”) and Proposed Civil Penalty to SPL alleging violations of federal pipeline safety regulations relating to the 2018 SPL tank incident and proposing civil penalties totaling $2,214,900. On September 16, 2021, PHMSA issued an Amended NOPV that reduced the proposed penalty to $1,458,200. On October 12, 2021, SPL responded to the Amended NOPV, electing not to contest the alleged violations in the Amended NOPV and electing to pay the proposed reduced penalty. PHMSA notified SPL in a letter dated November 9, 2021 that the case was considered “closed.” SPL continues to coordinate with PHMSA and FERC to address the matters relating to the 2018 SPL tank incident, including repair approach and related analysis. We do not expect that the Consent Order and related analysis, repair and remediation or resolution of the NOPV will have a material adverse impact on our financial results or operations.
ITEM 4. MINE SAFETY DISCLOSURE
Not applicable.
PART II
ITEM 5. MARKET FOR REGISTRANT’S COMMON EQUITY, RELATED STOCKHOLDER MATTERS AND ISSUER PURCHASES OF EQUITY SECURITIES
Market Information, Holders and Dividend Policy
Our common stock has traded on the NYSE American under the symbol “LNG” since March 24, 2003. As of February 18, 2022, we had 254 million shares of common stock outstanding held by 92 record owners.
In September 2021, Cheniere declared an inaugural quarterly dividend of $0.33 per common share. On January 25, 2022, we declared a quarterly dividend of $0.33 per common share that is payable on February 28, 2022 to shareholders of record as of February 7, 2022. The declaration of dividends is subject to the discretion of our Board, and will depend on Cheniere’s financial condition and other factors deemed relevant by the Board.
Purchase of Equity Securities by the Issuer and Affiliated Purchasers
The following table summarizes stock repurchases for the three months ended December 31, 2021:
| | | | | | | | | | | | | | | | | | | | | | | | | | |
| Period | | Total Number of Shares Purchased (1) | | Average Price Paid Per Share (2) | | Total Number of Shares Purchased as a Part of Publicly Announced Plans | | Approximate Dollar Value of Shares That May Yet Be Purchased Under the Plans (3) |
| October 1 - 31, 2021 | | 22,220 | | $98.23 | | 17,949 | | $998,251,447 |
| November 1 - 30, 2021 | | 603 | | $105.34 | | — | | $998,251,447 |
| December 1 - 31, 2021 | | 11,046 | | $99.94 | | 6,895 | | $997,572,653 |
| Total | | 33,869 | | $98.92 | | 24,844 | | |
(1)Includes issued shares surrendered to us by participants in our share-based compensation plans for payment of applicable tax withholdings on the vesting of share-based compensation awards. Associated shares surrendered by participants are repurchased pursuant to terms of the plan and award agreements and not as part of the publicly announced share repurchase plan.
(2)The price paid per share was based on the average trading price of our common stock on the dates on which we repurchased the shares.
(3)On June 3, 2019, we announced that our Board authorized a 3-year, $1 billion share repurchase program. On September 7, 2021, the Board authorized a reset of the share repurchase program to $1.0 billion, inclusive of any amounts remaining under the previous authorization as of September 30, 2021, for an additional three years beginning on October 1, 2021. For additional information, see Note 19—Stockholder’s Equity of our Notes to Consolidated Financial Statements.
Total Stockholder Return
The following is a customized peer group consisting of 17 companies (the “Peer Group”) that were selected because they are publicly traded companies that have: (1) comparable Global Industries Classification Standards, (2) similar market capitalization, (3) similar enterprise values and (4) similar operating characteristics and capital intensity.
| | | | | | | | |
| Peer Group |
Air Products and Chemicals, Inc. (APD) | | Marathon Petroleum Corporation (MPC) |
| Baker Hughes Company (BKR) | | Occidental Petroleum Corporation (OXY) |
| ConocoPhillips (COP) | | ONEOK, Inc. (OKE) |
Enterprise Products Partners L.P. (EPD) | | Phillips 66 (PSX) |
| EOG Resources, Inc. (EOG) | | Suncor Energy Inc. (SU) |
| Halliburton Company (HAL) | | Targa Resources Corp. (TRGP) |
| Hess Corporation (HES) | | Valero Energy Corporation (VLO) |
Kinder Morgan, Inc. (KMI) | | The Williams Companies, Inc. (WMB) |
| LyondellBasell Industries N.V. (LYB) | | |
The following graph compares the five-year total return on our common stock, the S&P 500 Index and our Peer Group. The graph was constructed on the assumption that $100 was invested in our common stock, the S&P 500 Index and our Peer Group on December 31, 2016 and that any dividends were fully reinvested.
| | | | | | | | | | | | | | | | | | | | | | | | | | | | | | | | | | | | | | |
| Company / Index | | 2016 | | 2017 | | 2018 | | 2019 | | 2020 | | 2021 |
| Cheniere Energy, Inc. | | $ | 100.00 | | | $ | 129.95 | | | $ | 142.87 | | | $ | 147.41 | | | $ | 144.90 | | | $ | 245.56 | |
| S&P 500 Index | | 100.00 | | | 121.82 | | | 116.47 | | | 153.13 | | | 181.29 | | | 233.28 | |
| Peer Group | | 100.00 | | | 107.02 | | | 92.33 | | | 112.72 | | | 83.18 | | | 120.28 | |
| | | | | | | | | | | | |
ITEM 6. [Reserved]
ITEM 7. MANAGEMENT’S DISCUSSION AND ANALYSIS OF FINANCIAL CONDITION AND RESULTS OF OPERATIONS
Introduction
The following discussion and analysis presents management’s view of our business, financial condition and overall performance and should be read in conjunction with our Consolidated Financial Statements and the accompanying notes. This information is intended to provide investors with an understanding of our past performance, current financial condition and outlook for the future. Discussion of 2019 items and variance drivers between the year ended December 31, 2020 as compared to December 31, 2019 are not included herein, and can be found in “Management's Discussion and Analysis of Financial Condition and Results of Operations” in our annual report on Form 10-K for the fiscal year ended December 31, 2020.
Our discussion and analysis includes the following subjects:
Overview
We are an energy infrastructure company primarily engaged in LNG-related businesses. We provide clean, secure and affordable LNG to integrated energy companies, utilities and energy trading companies around the world. We operate two natural gas liquefaction and export facilities at Sabine Pass, Louisiana and near Corpus Christi, Texas (respectively, the “Sabine Pass LNG Terminal” and “Corpus Christi LNG Terminal”) with a total of nine operational natural gas liquefaction Trains, regasification facilities at the Sabine Pass LNG Terminal and pipelines that interconnect our facilities to several interstate and intrastate natural gas pipelines (the SPL Project and CCL Project, respectively, and collectively, the “Liquefaction Projects”). We are also developing an expansion of the Corpus Christi LNG Terminal. For further discussion of our business, see Items 1. and 2. Business and Properties.
Our long-term customer arrangements form the foundation of our business and provide us with significant, stable, long-term cash flows. We have contracted approximately 95% of the total production capacity from the Liquefaction Projects, including those contracts executed to support the expansion of the Corpus Christi LNG terminal adjacent to the CCL Project (“Corpus Christi Stage 3”). Excluding contracts with terms less than 10 years, our SPAs and IPM agreements had approximately 17 years of weighted average remaining life. The majority of our contracts are fixed-priced, long-term SPAs consisting of a fixed fee per MMBtu of LNG plus a variable fee per MMBtu of LNG, with the variable fees generally structured to cover the cost of natural gas purchases and transportation and liquefaction fuel to produce LNG, thus limiting our exposure to fluctuations in U.S. natural gas prices. During 2021, we continued to grow our SPA portfolio, and we believe that continued global demand for natural gas and LNG, as further described in Items 1. and 2. Business and Properties—Market Factors and Competition, will provide a foundation for additional growth in our portfolio of customer contracts in the future. The continued strength and stability of our long-term cash flows served as the foundation of our long-term capital allocation plan announced in 2021, which includes strengthening of balance sheet, capital return and accretive growth priorities.
Overview of Significant Events
Our significant events since January 1, 2021 and through the filing date of this Form 10-K include the following:
Strategic
•In February 2022, CCL Stage III amended the IPM agreement previously entered into with EOG Resources, Inc. (“EOG”), increasing the volume and term of natural gas supply from 140,000 MMBtu per day for 10 years, to 420,000
MMBtu per day for 15 years, with pricing continuing to be based on the Platts Japan Korea Marker (“JKM”). Under the amended IPM agreement, supply is targeted to commence upon completion of Trains 1, 4 and 5 of Corpus Christi Stage 3. In addition, the previously executed gas supply agreement (“GSA”), under which EOG sells 300,000 MMBtu per day to CCL Stage III at a price indexed to Henry Hub, has been extended by 5 years, resulting in a 15 year term that is expected to commence upon start-up of the amended IPM agreement.
•In September 2021, our board of directors (our “Board”) approved a long-term capital allocation plan which includes (1) the repurchase, repayment or retirement of approximately $1.0 billion of existing indebtedness of the Company each year through 2024 with the intent of achieving consolidated investment grade credit metrics, (2) initiation of a quarterly dividend for third quarter 2021 at $0.33 per share and (3) the authorization of a reset in the share repurchase program to $1.0 billion, inclusive of any amounts remaining under the previous authorization as of September 30, 2021, for a three-year term effective October 1, 2021.
•In July 2021, CCL Stage III entered into an IPM agreement with Tourmaline Oil Marketing Corp., a subsidiary of Tourmaline Oil Corp., to purchase 140,000 MMBtu per day of natural gas at a price based on JKM, for a term of approximately 15 years beginning in early 2023.
•In July 2021, the Board appointed Mses. Patricia K. Collawn and Lorraine Mitchelmore to serve as members of the Board. Ms. Collawn was appointed to the Audit Committee and the Compensation Committee of the Board, and Ms. Mitchelmore was appointed to the Audit Committee and the Governance and Nominating Committee of the Board.
•Our subsidiaries entered into SPAs with multiple counterparties for portfolio volumes aggregating approximately 67 million tonnes of LNG to be delivered between 2021 and 2042, inclusive of long-term SPAs entered into with ENN LNG (Singapore) Pte Ltd., a subsidiary of Glencore plc and Sinochem Group Co., Ltd.
Operational
•As of February 18, 2022, over 2,000 cumulative LNG cargoes totaling approximately 140 million tonnes of LNG have been produced, loaded and exported from the Liquefaction Projects.
•On February 4, 2022, substantial completion of Train 6 of the SPL Project was achieved.
•On March 26, 2021, substantial completion of Train 3 of the CCL Project was achieved.
Financial
•We completed the following debt transactions:
◦In December 2021, we issued a notice of redemption for all $625 million aggregate principal amount outstanding of our 4.25% Convertible Senior Notes due 2045 (the “2045 Cheniere Convertible Senior Notes”), which were redeemed on January 5, 2022.
◦In December 2021, SPL issued Senior Secured Notes due 2037 on a private placement basis for an aggregate principal amount of approximately $482 million (the “2037 SPL Private Placement Senior Secured Notes”). The 2037 SPL Private Placement Senior Secured Notes are fully amortizing, with a weighted average life of over 10 years and a weighted average interest rate of 3.07%.
◦In September 2021, CQP issued an aggregate principal amount of $1.2 billion of 3.25% Senior Notes due 2032 (the “2032 CQP Senior Notes”).
◦The proceeds, net of related fees, costs and expenses (“net proceeds”) of the 2032 CQP Senior Notes were used to redeem a portion of the outstanding $1.1 billion aggregate principal amount of the 5.625% Senior Notes due 2026 (the “2026 CQP Senior Notes”). The remaining net proceeds of the 2032 CQP Senior Notes, along with the net proceeds of the 2037 SPL Private Placement Senior Secured Notes and cash on hand, were used to redeem the outstanding $1.0 billion aggregate principal amount of the 6.25% Senior Secured Notes due 2022 (the “2022 SPL Senior Notes”).
◦In October 2021, we amended and restated our $1.25 billion Cheniere Revolving Credit Facility (“Cheniere Revolving Credit Facility”) to, among other things, (1) extend the maturity through October 2026, (2) reduce the interest rate and commitment fees, which can be further reduced based on our credit ratings and may be positively or negatively adjusted up to five basis points on the interest rate and up to one basis point on the
commitment fees based on the achievement of defined ESG milestones and (3) make certain other changes to the terms and conditions of the existing revolving credit facility.
◦In August 2021, CCH issued an aggregate principal amount of $750 million of fully amortizing 2.742% Senior Secured Notes due 2039 (the “2.742% CCH Senior Secured Notes”). The net proceeds of the 2.742% CCH Senior Secured Notes were used to prepay a portion of the principal amount outstanding under CCH’s amended and restated term loan credit facility (the “CCH Credit Facility”).
◦In March 2021, CQP issued an aggregate principal amount of approximately $1.5 billion of 4.000% Senior Notes due 2031 (the “2031 CQP Senior Notes”). The net proceeds of the 2031 CQP Senior Notes, along with cash on hand, were used to redeem the 5.250% Senior Notes due 2025.
•In line with our capital allocation plan, during the year ended December 31, 2021, on a consolidated basis, we reduced our long-term indebtedness by $1.2 billion, extended the weighted-average maturity of our outstanding debt by over one year and lowered our weighted average borrowing rate.
•In April 2021, S&P Global Ratings (“S&P”) changed the outlook of Cheniere and CQP’s ratings to positive from negative, and in February 2022, upgraded its issuer credit ratings of Cheniere and CQP from BB to BB+.
•In February 2021, Fitch Ratings (“Fitch”) changed the outlook of SPL’s senior secured notes rating to positive from stable and the outlook of CQP’s long-term issuer default rating and senior unsecured notes rating to positive from stable.
•In July 2021, we recommenced share repurchase activities, with 101,944 shares repurchased during the year ended December 31, 2021 for $9 million.
•In January 2021, the term commenced on Cheniere Marketing International LLP’s 25 year SPA with CPC Corporation, Taiwan.
Market Environment
The LNG market in 2021 saw unprecedented price increases across all natural gas and LNG benchmarks. Colder than normal temperatures early in the year, concerns over low natural gas and LNG inventories, low additional LNG supply availability and forecasts of a cold 2021/2022 winter in Europe and Asia increased price volatility and supported a run-up in natural gas and LNG prices. These conditions were exacerbated by rising coal and carbon prices in Europe, persistent under-performance from some non-US LNG supply projects and reduced Russian pipe exports to Europe, precipitating the early stages of a price-based energy crisis in Europe.
High demand for LNG during the recovery from the initial stages of the COVID-19 pandemic resulted in intense competition for supplies between the Atlantic and Pacific basins. Global LNG demand grew by about approximately 5% from the comparable 2020 period, adding an additional 18 mtpa to the overall market. A robust economic recovery in China powered an 8% increase in Asia’s LNG demand of approximately 19.5 million tonnes from the comparable 2020 period. This led to competition for supplies between Asia, Europe and Latin America, exposing the supply constraints that the industry has had while emerging from the pandemic. In turn, this drove international natural gas and LNG prices higher and widened the price spreads between the U.S. and other parts of the world. As an example, the Dutch Title Transfer Facility (“TTF”) monthly settlement prices averaged $14.4/MMBtu in 2021, approximately 375% higher than the $3.0/MMBtu average in 2020, and the TTF monthly settlement prices averaged $28.9/MMBtu in the fourth quarter of 2021, approximately 512% higher than the $4.72/MMBtu average in the fourth quarter of 2020. Similarly, the 2021 average settlement price for the JKM increased 292% year-over-year to an average of $15.0/MMBtu in 2021, and the fourth quarter of 2021 average settlement price for the JKM increased over 412% year-over-year to an average of $27.9/MMBtu. This extreme price increase triggered a strong supply response from the U.S., which played a significant role in balancing the global LNG market. The U.S. exported 70 million tonnes of LNG in 2021, a gain of approximately 49% from the comparable 2020 period, as the market continued to pull on supplies from our facilities and those of our competitors. Exports from our Liquefaction Projects reached 39 million tonnes in aggregate, representing over 55% of the gain in the U.S. total over the same period.
Results of Operations
The following charts summarize the total revenues and total LNG volumes loaded from our Liquefaction Projects (including both operational and commissioning volumes) during the years ended December 31, 2021 and 2020:
The following table summarizes the volumes of operational and commissioning LNG cargoes that were loaded from the Liquefaction Projects, which were recognized on our Consolidated Financial Statements during the year ended December 31, 2021:
| | | | | | | | | | | | | | | |
| | | Year Ended December 31, 2021 |
| (in TBtu) | | | | | Operational | | Commissioning |
| Volumes loaded during the current period | | | | | 1,975 | | | 40 | |
| Volumes loaded during the prior period but recognized during the current period | | | | | 26 | | | 3 | |
| Less: volumes loaded during the current period and in transit at the end of the period | | | | | (49) | | | (1) | |
| Total volumes recognized in the current period | | | | | 1,952 | | | 42 | |
Net loss attributable to common stockholders
| | | | | | | | | | | | | | | | | | | | | | | | | | | | | | |
| | | Year Ended December 31, | | | | | |
| (in millions, except per share data) | | | | | | | 2021 | | 2020 | | | | Variance ($) | | | |
| Net loss attributable to common stockholders | | | | | | | $ | (2,343) | | | $ | (85) | | | | | $ | (2,258) | | | | | | |
| Net loss per share attributable to common stockholders—basic and diluted | | | | | | | (9.25) | | | (0.34) | | | | | (8.91) | | | | | | |
| | | | | | | | | | | | | | | | | | |
Net loss attributable to common stockholders increased by $2.3 billion during the year ended December 31, 2021 from the comparable period in 2020, primarily due to the increase in derivative losses from changes in fair value and settlements of $5.8 billion (pre-tax and excluding the impact of non-controlling interest) between the periods as further described below and non-recurrence of $969 million in revenues recognized on LNG cargoes for which customers notified us that they would not take delivery. This impact was partially offset by increased margin on LNG delivered as a result of increases in both volume delivered and gross margin on LNG delivered per MMBtu during the year ended December 31, 2021 from the comparable period in 2020, as well as a tax benefit recorded during the year ended December 31, 2021.
Substantially all derivative losses relate to the use of commodity derivative instruments indexed to international LNG prices, primarily related to our IPM agreements. While operationally we utilize commodity derivatives to mitigate price volatility for commodities procured or sold over a period of time, as a result of significant appreciation in forward international LNG commodity curves during the year ended December 31, 2021, we recognized $4.5 billion of non-cash unfavorable changes in fair value attributed to positions indexed to such prices (pre-tax and excluding the impact of non-controlling interest).
Derivative instruments, which in addition to managing exposure to commodity-related marketing and price risks are utilized to manage exposure to changing interest rates and foreign exchange volatility, are reported at fair value on our Consolidated Financial Statements. For commodity derivative instruments related to our IPM agreements, the underlying transactions being economically hedged are accounted for under the accrual method of accounting, whereby revenues and expenses are recognized only upon delivery, receipt or realization of the underlying transaction. Because the recognition of derivative instruments at fair value has the effect of recognizing gains or losses relating to future period exposure, and given the significant volumes, long-term duration and volatility in price basis for certain of our derivative contracts, use of derivative instruments may result in continued volatility of our results of operations based on changes in market pricing, counterparty credit risk and other relevant factors, notwithstanding the operational intent to mitigate risk exposure over time.
Revenues
| | | | | | | | | | | | | | | | | | | | | | | | | | | | | | | |
| | | Year Ended December 31, | | | | | | |
| (in millions) | | | | | | | 2021 | | 2020 | | | | Variance ($) | | | | |
| LNG revenues | | | | | | | $ | 15,395 | | | $ | 8,924 | | | | | $ | 6,471 | | | | | | | |
| Regasification revenues | | | | | | | 269 | | | 269 | | | | | — | | | | | | | |
| Other revenues | | | | | | | 200 | | | 165 | | | | | 35 | | | | | | | |
| | | | | | | | | | | | | | | | | | | |
| Total revenues | | | | | | | $ | 15,864 | | | $ | 9,358 | | | | | $ | 6,506 | | | | | | | |
Total revenues increased during the year ended December 31, 2021 from the comparable period in 2020, primarily as a result of increased revenues per MMBtu and higher volume of LNG delivered between the periods. Revenues per MMBtu of LNG were higher due to improved market prices recognized by our integrated marketing function as a result of appreciation in international LNG prices and increases in Henry Hub prices, as well as variable fees that are received in addition to fixed fees when the customers take delivery of scheduled cargoes as opposed to exercising their contractual right to not take delivery. The volume of LNG delivered between the periods increased due to the non-recurrence of notification by our customers to not take delivery of scheduled LNG cargoes during the year ended December 31, 2021 and as a result of production from Train 3 of the CCL Project, which achieved substantial completion on March 26, 2021.
Prior to substantial completion of a Train, amounts received from the sale of commissioning cargoes from that Train are offset against LNG terminal construction-in-process, because these amounts are earned or loaded during the testing phase for the construction of that Train. During the years ended December 31, 2021 and 2020, we realized offsets to LNG terminal costs of $319 million and $19 million, corresponding to 42 TBtu and 3 TBtu respectively, that were related to the sale of commissioning cargoes from Train 3 of the CCL Project and Train 6 of the SPL Project.
Also included in LNG revenues are sales of certain unutilized natural gas procured for the liquefaction process and other revenues, which was $320 million and $466 million during the years ended December 31, 2021 and 2020, respectively. Additionally, LNG revenues include gains and losses from derivative instruments, which include the realized value associated with a portion of derivative instruments that settle through physical delivery. We recognized offsets to revenues of $1.8 billion and $30 million during the years ended December 31, 2021 and 2020, respectively, related to the gains and losses from derivative instruments due to shifts in forward commodity curves.
We expect the volume of LNG produced and available for sale to increase in the future as Train 6 of the SPL Project achieved substantial completion on February 4, 2022.
The following table presents the components of LNG revenues and the corresponding LNG volumes delivered:
| | | | | | | | | | | | | | | | | |
| | | Year Ended December 31, |
| | | | | | 2021 | | 2020 | | |
LNG revenues (in millions): | | | | | | | | | |
| LNG from the Liquefaction Projects sold under third party long-term agreements (1) | | | | | $ | 11,990 | | | $ | 6,303 | | | |
| LNG from the Liquefaction Projects sold by our integrated marketing function under short-term agreements | | | | | 4,361 | | | 802 | | | |
| LNG procured from third parties | | | | | 499 | | | 414 | | | |
| LNG revenues associated with cargoes not delivered per customer notification (2) | | | | | — | | | 969 | | | |
| Net derivative losses | | | | | (1,776) | | | (30) | | | |
| Other revenues | | | | | 321 | | | 466 | | | |
| Total LNG revenues | | | | | $ | 15,395 | | | $ | 8,924 | | | |
| | | | | | | | | |
Volumes delivered as LNG revenues (in TBtu): | | | | | | | | | |
| LNG from the Liquefaction Projects sold under third party long-term agreements (1) | | | | | 1,608 | | | 1,158 | | | |
| LNG from the Liquefaction Projects sold by our integrated marketing function under short-term agreements | | | | | 344 | | | 227 | | | |
| LNG procured from third parties | | | | | 45 | | | 103 | | | |
| Total volumes delivered as LNG revenues | | | | | 1,997 | | | 1,488 | | | |
| | | | | | | | | |
| | | | | | | | | |
(1)Long-term agreements include agreements with an initial tenure of 12 months or more.
(2)LNG revenues include revenues with no corresponding volumes due to revenues attributable to LNG cargoes for which customers notified us that they would not take delivery.
Operating costs and expenses
| | | | | | | | | | | | | | | | | | | | | | | | | | | | | | | |
| | | Year Ended December 31, | | | | | | | | |
| (in millions) | | | | | | | 2021 | | 2020 | | | | Variance ($) | | | | |
| Cost of sales | | | | | | | $ | 13,773 | | | $ | 4,161 | | | | | $ | 9,612 | | | | | | | |
| | | | | | | | | | | | | | | | | | | |
| Operating and maintenance expense | | | | | | | 1,444 | | | 1,320 | | | | | 124 | | | | | | | |
| Development expense | | | | | | | 7 | | | 6 | | | | | 1 | | | | | | | |
| Selling, general and administrative expense | | | | | | | 325 | | | 302 | | | | | 23 | | | | | | | |
| Depreciation and amortization expense | | | | | | | 1,011 | | | 932 | | | | | 79 | | | | | | | |
| | | | | | | | | | | | | | | | | | | |
| Impairment expense and loss on disposal of assets | | | | | | | 5 | | | 6 | | | | | (1) | | | | | | | |
| | | | | | | | | | | | | | | | | | | |
| | | | | | | | | | | | | | | | | | | |
| Total operating costs and expenses | | | | | | | $ | 16,565 | | | $ | 6,727 | | | | | $ | 9,838 | | | | | | | |
| | | | | | | | | | | | | | | | | | | |
| | | | | | | | | | | | | | | | | | | |
| | | | | | | | | | | | | | | | | | | |
Our total operating costs and expenses increased during the year ended December 31, 2021 from the comparable period in 2020, primarily as a result of increased cost of sales. Cost of sales includes costs incurred directly for the production and delivery of LNG from the Liquefaction Projects, to the extent those costs are not utilized for the commissioning process. Cost of sales increased during the year ended December 31, 2021 from the comparable 2020 period, primarily due to increased pricing of natural gas feedstock as a result of higher U.S. natural gas prices and increased volume of LNG delivered, as well as unfavorable changes in our commodity derivatives to secure natural gas feedstock for the Liquefaction Projects driven by unfavorable shifts in international forward commodity curves, as discussed above under Net loss attributable to common stockholders. Cost of sales also includes costs associated with the sale of certain unutilized natural gas procured for the liquefaction process and a portion of derivative instruments that settle through physical delivery, port and canal fees, variable transportation and storage costs, net of margins from the sale of natural gas procured for the liquefaction process and other costs to convert natural gas into LNG.
Operating and maintenance expense primarily includes costs associated with operating and maintaining the Liquefaction Projects. During the year ended December 31, 2021, operating and maintenance expense increased from the comparable period in 2020, primarily due to increased natural gas transportation and storage capacity demand charges and increased third party service, generally as a result of an additional Train that was in operation between the periods. Operating and maintenance expense also includes insurance and regulatory and other operating costs.
Depreciation and amortization expense increased during the year ended December 31, 2021 from the comparable period in 2020 as a result of commencing operations of Train 3 of the CCL Project in March 2021.
We expect our operating costs and expenses to generally increase as Train 6 of the SPL Project achieved substantial completion on February 4, 2022, although we expect certain costs will not proportionally increase with the number of operational Trains as cost efficiencies will be realized.
Other expense
| | | | | | | | | | | | | | | | | | | | | | | | | | | | | |
| | | Year Ended December 31, | | | | | | |
| (in millions) | | | | | | | 2021 | | 2020 | | | | Variance ($) |
| Interest expense, net of capitalized interest | | | | | | | $ | 1,438 | | | $ | 1,525 | | | | | $ | (87) | | | | | |
| Loss on modification or extinguishment of debt | | | | | | | 116 | | | 217 | | | | | (101) | | | | | |
| Interest rate derivative loss, net | | | | | | | 1 | | | 233 | | | | | (232) | | | | | |
| Other expense, net | | | | | | | 22 | | | 112 | | | | | (90) | | | | | |
| Total other expense | | | | | | | $ | 1,577 | | | $ | 2,087 | | | | | $ | (510) | | | | | |
Interest expense, net of capitalized interest, decreased during the year ended December 31, 2021 from the comparable 2020 period as a result of lower interest costs as a result of refinancing higher cost debt and repayment of debt in accordance with our capital allocation plan, partially offset by the portion of total interest costs that was eligible for capitalization due to the completion of construction of Train 3 of the CCL Project in March 2021. During the years ended December 31, 2021 and 2020, we incurred $1.6 billion and $1.8 billion of total interest cost, respectively, of which we capitalized $166 million and $248 million, respectively, which was primarily related to interest costs incurred for the construction of the Liquefaction Projects.
Interest rate derivative loss, net decreased during the year ended December 31, 2021 compared to the comparable 2020 period, primarily due to the settlement of certain outstanding derivatives in August 2020 that were in an unfavorable position and a favorable shift in the long-term forward LIBOR curve between the periods
Other expense, net decreased during the year ended December 31, 2021 from the comparable period in 2020 primarily due to lower other-than-temporary impairment losses related to our investment in Midship Holdings, LLC that were recognized between the periods. These impairment losses were partially offset by an increase in interest income earned on our cash and cash equivalents.
Income tax provision (benefit)
| | | | | | | | | | | | | | | | | | | | | | | | | | | | | |
| | | Year Ended December 31, | | | | | | |
| (in millions) | | | | | | | 2021 | | 2020 | | | | Variance |
| Income (loss) before income taxes and non-controlling interest | | | | | | | $ | (2,278) | | | $ | 544 | | | | | $ | (2,822) | | | | | |
| Income tax provision (benefit) | | | | | | | $ | (713) | | | $ | 43 | | | | | $ | (756) | | | | | |
| Effective tax rate | | | | | | | 31.3 | % | | 7.9 | % | | | | 23.4 | % | | | | |
Our effective income tax rate for the year ended December 31, 2021 reflected a 31.3% tax benefit, compared to a 7.9% tax expense for the year ended December 31, 2020. The recorded tax benefit for 2021 was greater than the statutory income tax rate primarily due to income allocated to non-controlling interest that is not taxable to Cheniere and the partial release of the valuation allowance on our Louisiana net operating loss carryforwards. The prior year tax expense was lower than the statutory income tax rate primarily due to income allocated to non-controlling interest that is not taxable to Cheniere. See further discussion in Note 15 – Income Taxes of our Notes to Consolidated Financial Statements.
Our effective tax rate is subject to variation prospectively due to variability in our pre-tax and taxable earnings and the proportion of such earnings attributable to non-controlling interests.
Net income attributable to non-controlling interest
| | | | | | | | | | | | | | | | | | | | | | | | | | | | | |
| | | Year Ended December 31, | | | | | | |
| (in millions) | | | | | | | 2021 | | 2020 | | | | Variance ($) |
| Net income attributable to non-controlling interest | | | | | | | $ | 778 | | | $ | 586 | | | | | $ | 192 | | | | | |
Net income attributable to non-controlling interest increased during the year ended December 31, 2021 from the year ended December 31, 2020 primarily due to an increase in consolidated net income recognized by CQP, which increased from net income of $1.2 billion in the year ended December 31, 2020 to $1.6 billion in the year ended December 31, 2021.
Liquidity and Capital Resources
The following information describes our ability to generate and obtain adequate amounts of cash to meet our requirements in the short term and the long term. In the short term, we expect to meet our cash requirements using operating cash flows and available liquidity, consisting of cash and cash equivalents, restricted cash and cash equivalents and available commitments under our credit facilities. In the long term, we expect to meet our cash requirements using operating cash flows and other future potential sources of liquidity, which may include debt and equity offerings by us or our subsidiaries. The table below provides a summary of our available liquidity as of December 31, 2021 (in millions). Future material sources of liquidity are discussed below.
| | | | | | | |
| December 31, 2021 | | |
| Cash and cash equivalents (1) | $ | 1,404 | | | |
| Restricted cash and cash equivalents designated for the following purposes: | | | |
| | | |
| SPL Project | 98 | | | |
| | | |
| | | |
| CCL Project | 44 | | | |
| Cash held by our subsidiaries that is restricted to Cheniere | 271 | | | |
| Available commitments under our credit facilities (2): | | | |
| | | |
$1.2 billion Working Capital Revolving Credit and Letter of Credit Reimbursement Agreement (the “2020 SPL Working Capital Facility”) | 805 | | | |
| CQP Credit Facilities executed in 2019 (“2019 CQP Credit Facilities”) | 750 | | | |
| | | |
| | | |
| $1.2 billion CCH Working Capital Facility (“CCH Working Capital Facility”) | 589 | | | |
Cheniere Revolving Credit Facility | 1,250 | | | |
| | | |
| Total available commitments under our credit facilities | 3,394 | | | |
| | | |
| Total available liquidity | $ | 5,211 | | | |
(1)Amounts presented include balances held by our consolidated variable interest entity, CQP, as discussed in Note 9—Non-controlling Interest and Variable Interest Entity of our Notes to Consolidated Financial Statements. As of December 31, 2021, assets of CQP, which are included in our Consolidated Balance Sheets, included $0.9 billion of cash and cash equivalents. (2)Available commitments represent total commitments less loans outstanding and letters of credit issued under each of our credit facilities as of December 31, 2021. See Note 11—Debt of our Notes to Consolidated Financial Statements for additional information on our credit facilities and other debt instruments.
Our liquidity position subsequent to December 31, 2021 is driven by future sources of liquidity and future cash requirements. Future sources of liquidity are expected to be composed of (1) cash receipts from executed contracts, under which we are contractually entitled to future consideration, and (2) additional sources of liquidity, from which we expect to receive cash although the cash is not underpinned by executed contracts. Future cash requirements are expected to be composed of (1) cash payments under executed contracts, under which we are contractually obligated to make payments, and (2) additional cash requirements, under which we expect to make payments although we are not contractually obligated to make the payments under executed contracts. Future sources of liquidity and future cash requirements are estimates based on management’s assumptions and currently known market conditions and other factors as of December 31, 2021.
Although material sources of liquidity and material cash requirements are presented below from a consolidated standpoint, SPL, CQP, CCH and Cheniere operate with independent capital structures. Certain restrictions under debt and equity instruments executed by our subsidiaries limit each entity’s ability to distribute cash, including the following:
•SPL and CCH are required to deposit all cash received into restricted cash and cash equivalents accounts under certain of their debt agreements. The usage or withdrawal of such cash is restricted to the payment of liabilities related to the Liquefaction Projects and other restricted payments. The majority of the cash held by SPL and CCH that is restricted to Cheniere relates to advance funding for operation and construction of the Liquefaction Projects;
•CQP is required under its partnership agreement to distribute to unitholders all available cash on hand at the end of a quarter less the amount of any reserves established by its general partner. Our 48.6% limited partner interest, 100% general partner interest and incentive distribution rights in CQP limit our right to receive cash held by CQP to the amounts specified by the provisions of CQP’s partnership agreement; and
•SPL, CQP and CCH are restricted by affirmative and negative covenants included in certain of their debt agreements in their ability to make certain payments, including distributions, unless specific requirements are satisfied.
Notwithstanding the restrictions noted above, we believe that sufficient flexibility exists within the Cheniere complex to enable each independent capital structure to meet its currently anticipated cash requirements. The sources of liquidity at SPL, CQP and CCH primarily fund the cash requirements of the respective entity, and any remaining liquidity not subject to restriction, as supplemented by liquidity provided by Cheniere Marketing, is available to enable Cheniere to meet its cash requirements.
Future Sources and Uses of Liquidity
Future Sources of Liquidity under Executed Contracts
Because many of our sales contracts have long-term durations, we are contractually entitled to significant future consideration under our SPAs and TUAs which has not yet been recognized as revenue. This future consideration is in most cases not yet legally due to us and was not reflected on our Consolidated Balance Sheets as of December 31, 2021. In addition, a significant portion of this future consideration is subject to variability as discussed more specifically below. We anticipate that this consideration will be available to meet liquidity needs in the future. The following table summarizes our estimate of future material sources of liquidity to be received from executed contracts as of December 31, 2021 (in billions):
| | | | | | | | | | | | | | | | | | | | | | | | |
| | | Estimated Revenues Under Executed Contracts by Period (1) |
| | | | | | | | |
| | | 2022 | | 2023 - 2026 | | Thereafter | | Total |
| LNG revenues (fixed fees) (2) | | $ | 5.7 | | | $ | 25.0 | | | $ | 76.4 | | | $ | 107.1 | |
| LNG revenues (variable fees) (2) (3) | | 8.0 | | | 30.6 | | | 103.4 | | | 142.0 | |
| Regasification revenues | | 0.3 | | | 1.0 | | | 0.6 | | | 1.9 | |
| Financial derivatives (4) | | (0.3) | | | — | | | — | | | (0.3) | |
| | | | | | | | |
| Total | | $ | 13.7 | | | $ | 56.6 | | | $ | 180.4 | | | $ | 250.7 | |
(1)Excludes contracts for which conditions precedent have not been met. Agreements in force as of December 31, 2021 that have terms dependent on project milestone dates are based on the estimated dates as of December 31, 2021. The timing of revenue recognition under GAAP may not align with cash receipts, although we do not consider the timing difference to be material. The estimates above reflect management’s assumptions and currently known market conditions and other factors as of December 31, 2021. Estimates are not guarantees of future performance and actual results may differ materially as a result of a variety of factors described in this annual report on Form 10-K.
(2)LNG revenues exclude revenues from contracts with original expected durations of one year or less. Fixed fees are fees that are due to us regardless of whether a customer exercises their contractual right to not take delivery of an LNG cargo under the contract. Variable fees are receivable only in connection with LNG cargoes that are delivered.
(3)LNG revenues (variable fees) reflect the assumption that customers elect to take delivery of all cargoes made available under the contract. LNG revenues (variable fees) are based on estimated forward prices and basis spreads as of December 31, 2021. The pricing structure of our SPA arrangements with our customers incorporates a variable fee per MMBtu of LNG generally equal to 115% of Henry Hub, which is paid upon delivery, thus limiting our net exposure to future increases in natural gas prices. Certain of our contracts contain additional variable consideration based on the
outcome of contingent events and the movement of various indexes. We have not included such variable consideration to the extent the consideration is considered constrained due to the uncertainty of ultimate pricing and receipt.
(4)Financial derivatives include certain LNG Trading Derivatives that are recorded as LNG Revenues based on the nature and intent of the derivative instrument. Pricing of financial derivatives is based on estimated forward prices and basis spreads as of December 31, 2021.
LNG Revenues
We have contracted substantially all of the total production capacity from the Liquefaction Projects. The majority of the contracted capacity is comprised of fixed-price, long-term SPAs that SPL and CCL have executed with third parties to sell LNG from Trains 1 through 6 of the SPL Project and Trains 1 through 3 of the CCL Project. Substantially all of our contracted capacity is from contracts with terms exceeding 10 years. Excluding contracts with terms less than 10 years, our SPAs had approximately 17 years of weighted average remaining life as of December 31, 2021. Under the SPAs, the customers purchase LNG on a free on board (“FOB”) basis for a price consisting of a fixed fee per MMBtu of LNG (a portion of which is subject to annual adjustment for inflation) plus a variable fee per MMBtu of LNG generally equal to 115% of Henry Hub. Certain customers may elect to cancel or suspend deliveries of LNG cargoes, with advance notice as governed by each respective SPA, in which case the customers would still be required to pay the fixed fee with respect to the contracted volumes that are not delivered as a result of such cancellation or suspension. The variable fees under our SPAs were generally sized with the intention to cover the costs of gas purchases and variable transportation and liquefaction fuel to produce the LNG to be sold under each such SPA. In aggregate, the annual fixed fee portion to be paid by the third-party SPA customers is approximately $2.9 billion for Trains 1 through 5 of the SPL Project. After giving effect to an SPA that Cheniere has committed to provide to SPL and upon the date of first commercial delivery of Train 6 of the SPL Project, the annual fixed fee portion to be paid by the third-party SPA customers is expected to increase to at least $3.3 billion. In aggregate, the minimum annual fixed fee portion to be paid by the third-party SPA customers is approximately $1.8 billion for Trains 1 through 3 of the CCL Project. Our long-term SPA customers consist of creditworthy counterparties, with an average credit rating of A-, A3 and A- by S&P, Moody’s Corporation and Fitch, respectively. A discussion of revenues under our SPAs can be found in Note 13—Revenues from Contracts with Customers of our Notes to Consolidated Financial Statements.
We market and sell LNG produced by the Liquefaction Projects that is not required for other customers through our integrated marketing function, Cheniere Marketing. Cheniere Marketing has a portfolio of long-, medium- and short-term SPAs to deliver commercial LNG cargoes to locations worldwide. These volumes are expected to be primarily sourced by LNG produced by the Liquefaction Projects but supplemented by volumes procured from other locations worldwide, as needed.
As of December 31, 2021, Cheniere Marketing has sold or has options to sell approximately 7,974 TBtu of LNG to be delivered to third party customers between 2022 and 2045, including 7,791 TBtu from long-term executed contracts that are included in the Future Sources of Liquidity under Executed Contracts table above. The cargoes have been sold either on a FOB basis (delivered to the customer at the Sabine Pass LNG Terminal or the Corpus Christi LNG Terminal, as applicable) or a delivered at terminal (“DAT”) basis (delivered to the customer at their specified LNG receiving terminal).
Regasification Revenues
SPLNG has entered into two long-term, third party TUAs, under which SPLNG’s customers are required to pay fixed monthly fees, whether or not they use the approximately 2 Bcf/d of the regasification capacity they have reserved at the Sabine Pass LNG Terminal. Total and Chevron U.S.A. Inc. (“Chevron”) are each obligated to make monthly capacity payments to SPLNG aggregating approximately $125 million annually, prior to inflation adjustments, for 20 years that commenced in 2009. Total S.A. has guaranteed Total’s obligations under its TUA up to $2.5 billion, subject to certain exceptions, and Chevron Corporation has guaranteed Chevron’s obligations under its TUA up to 80% of the fees payable by Chevron.
SPLNG has also entered into a TUA with SPL to reserve the remaining capacity at the Sabine Pass LNG Terminal. SPL is obligated to make monthly capacity payments to SPLNG aggregating approximately $250 million annually, prior to inflation adjustments, continuing until at least May 2036. SPL entered into a partial TUA assignment agreement with Total, whereby SPL gained access to substantially all of Total’s capacity and other services provided under Total’s TUA with SPLNG that started in 2019. Notwithstanding any arrangements between Total and SPL, payments required to be made by Total to SPLNG will continue to be made by Total to SPLNG in accordance with its TUA. Payments made by SPL to Total under this partial TUA assignment agreement are included in other purchase obligations in the Future Cash Requirements for Operations and
Capital Expenditures under Executed Contracts table below. Full discussion of SPLNG’s revenues under the TUA agreements and the partial TUA assignment can be found in Note 13—Revenues from Contracts with Customers of our Notes to Consolidated Financial Statements.
Financial Derivatives
Cheniere Marketing has entered into financial derivatives to minimize future cash flow variability associated with Cheniere Marketing’s LNG agreements. Full discussion of financial derivatives can be found in Note 7—Derivative Instruments of our Notes to Consolidated Financial Statements.
Additional Future Sources of Liquidity
Available Commitments under Credit Facilities
As of December 31, 2021, we had $3.4 billion in available commitments under our credit facilities, subject to compliance with the applicable covenants, to potentially meet liquidity needs. Our credit facilities mature between 2023 and 2026.
Uncontracted Liquefaction Supply
We expect a portion of total production capacity from the Liquefaction Projects that has not yet been contracted under executed agreements as of December 31, 2021 to be available for Cheniere Marketing to market to additional LNG customers. Debottlenecking opportunities and other optimization projects have led to increased run-rate production levels which has increased the production capacity available for Cheniere Marketing to the extent it has not already been contracted to other customers.
Financially Disciplined Growth
We expect to reach FID on Corpus Christi Stage 3 in 2022 based on our progress in commercializing the project and the strong global LNG market. Corpus Christi Stage 3 is a shovel-ready, brownfield project with an incremental liquefaction capacity of approximately 10 mtpa. Beyond Corpus Christi Stage 3, our significant land positions at the Corpus Christi and Sabine Pass LNG terminals provide potential development and investment opportunities for further liquefaction capacity expansion at strategically advantaged locations with proximity to pipeline infrastructure and resources.
Future Cash Requirements for Operations and Capital Expenditures under Executed Contracts
We are committed to make future cash payments for operations and capital expenditures pursuant to certain of our contracts. The following table summarizes our estimate of material cash requirements for operations and capital expenditures under executed contracts as of December 31, 2021 (in billions):
| | | | | | | | | | | | | | | | | | | | | | | | |
| | | Estimated Payments Due Under Executed Contracts by Period (1) |
| | | | | | | | |
| | | 2022 | | 2023 - 2026 | | Thereafter | | Total |
| Purchase obligations (2): | | | | | | | | |
| Natural gas supply agreements (3) | | $ | 8.4 | | | $ | 15.3 | | | $ | 12.5 | | | $ | 36.2 | |
| Natural gas transportation and storage service agreements (4) | | 0.4 | | | 1.6 | | | 4.0 | | | 6.0 | |
| Capital expenditures (5) | | 0.2 | | | — | | | — | | | 0.2 | |
| Other purchase obligations (6) | | 0.4 | | | 0.6 | | | 0.6 | | | 1.6 | |
| Leases (7) | | 0.8 | | | 2.0 | | | 0.9 | | | 3.7 | |
| | | | | | | | |
| | | | | | | | |
| Total | | $ | 10.2 | | | $ | 19.5 | | | $ | 18.0 | | | $ | 47.7 | |
(1)Excludes contracts for which conditions precedent have not been met. Agreements in force as of December 31, 2021 that have terms dependent on project milestone dates are based on the estimated dates as of December 31, 2021. The estimates above reflect management’s assumptions and currently known market conditions and other factors as of December 31, 2021. Estimates are not guarantees of future performance and actual results may differ materially as a result of a variety of factors described in this annual report on Form 10-K.
(2)Purchase obligations consist of agreements to purchase goods or services that are enforceable and legally binding that specify fixed or minimum quantities to be purchased. As project milestones and other conditions precedent are achieved, our obligations are expected to increase accordingly. We include contracts for which we have an early termination option if the option is not currently expected to be exercised.
(3)Pricing of natural gas supply agreements is based on estimated forward prices and basis spreads as of December 31, 2021. Pricing of IPM agreements is based on global gas market prices less fixed liquefaction fees and certain costs incurred by us. Does not include incremental volumes of approximately 1,790 TBtu and 548 TBtu, respectively, pursuant to an amended IPM agreement and GSA with EOG that was executed subsequent to December 31, 2021, a portion of which is conditional on the in-service date of certain asset infrastructure and substantially all of which will be delivered after 2026. See Overview of Significant Events for additional discussion.
(4)Includes $0.4 billion of purchase obligations to related parties under the natural gas transportation and storage service agreements.
(5)Capital expenditures primarily consist of costs incurred through our EPC contract with Bechtel Oil, Gas and Chemicals, Inc. (“Bechtel”) for the engineering, procurement and construction of Train 6 of the SPL Project, which achieved substantial completion on February 4, 2022, and the third marine berth that is currently under construction.
(7)Leases include payments under (1) operating leases, (2) finance leases, (3) short-term leases and (4) vessel time charters that were executed as of December 31, 2021 but will commence in the future. Certain of our leases also contain variable payments, such as inflation, which are not included above unless the contract terms require the payment of a fixed amount that is unavoidable. Payments during renewal options that are exercisable at our sole discretion are included only to the extent that the option is believed to be reasonably certain to be exercised.
Natural Gas Supply, Transportation and Storage Service Agreements
We have secured natural gas feedstock for the Corpus Christi and Sabine Pass LNG terminals through long-term natural gas supply and IPM agreements. Under our IPM agreements, we pay for natural gas feedstock based on global gas market prices less fixed liquefaction fees and certain costs incurred by us. While IPM agreements are not revenue contracts for accounting purposes, the payment structure for the purchase of natural gas under the IPM agreements generates a take-or-pay style fixed liquefaction fee, assuming that LNG produced from the natural gas feedstock is subsequently sold at a price approximating the global LNG market price paid for the natural gas feedstock purchase.
As of December 31, 2021, we have secured approximately 86% of the natural gas supply required to support the total forecasted production capacity of the Liquefaction Projects during 2022. Natural gas supply secured decreases as a percentage of forecasted production capacity beyond 2022. Natural gas supply is generally secured on an indexed pricing basis, with title transfer occurring upon receipt of the commodity. As further described in the LNG Revenues section above, the pricing structure of our SPA arrangements with our customers incorporates a variable fee per MMBtu of LNG generally equal to 115% of Henry Hub, which is paid upon delivery, thus limiting our net exposure to future increases in natural gas prices. Inclusive of amounts under contracts with unsatisfied conditions precedent as of December 31, 2021 and those executed by CCL Stage III, we have secured up to 10,872 TBtu of natural gas feedstock through agreements with remaining terms that range up to 15 years. A discussion of our natural gas supply and IPM agreements can be found in Note 7—Derivative Instruments of our Notes to Consolidated Financial Statements.
To ensure that we are able to transport natural gas feedstock to the Corpus Christi and Sabine Pass LNG terminals, we have entered into transportation precedent and other agreements to secure firm pipeline transportation capacity from pipeline companies. We have also entered into firm storage services agreements with third parties to assist in managing variability in natural gas needs for the Liquefaction Projects.
Capital Expenditures
We enter into lump sum turnkey contracts with third party contractors for the engineering, procurement and construction (“EPC”) of our Liquefaction Projects. The historical contracts have been executed with Bechtel, who has charged a lump sum for all work performed and generally bore project cost, schedule and performance risks unless certain specified events occurred,
in which case Bechtel caused us to enter into a change order, or we agreed with Bechtel to a change order. The future capital expenditures included in the table above primarily consist of costs incurred under the Bechtel EPC contract for Train 6 of the SPL Project. The total contract price of the EPC contract for Train 6, which achieved substantial completion on February 4, 2022, and the third marine berth that is currently under construction is approximately $2.5 billion. We anticipate our future cash requirements for capital expenditures will increase in connection with the expected final investment decision (“FID”) of Corpus Christi Stage 3. See Financially Disciplined Growth section for further discussion.
Leases
Our obligations under our lease arrangements primarily consist of LNG vessel time charters with terms of up to 10 years to ensure delivery of cargoes sold on a DAT basis. We have also entered into leases for the use of tug vessels, office space and facilities and land sites. A discussion of our lease obligations can be found in Note 12—Leases of our Notes to Consolidated Financial Statements.
Additional Future Cash Requirements for Operations and Capital Expenditures
Corporate Activities
We are required to maintain corporate and general and administrative functions to serve our business activities. During the year ended December 31, 2021, selling, general and administrative expense was $0.3 billion, a portion of which was related to leases for office space, which is included in the table of cash requirements for operations and capital expenditures under executed contracts above. Our full-time employee headcount was 1,550 as of January 31, 2022.
Financially Disciplined Growth
We expect to reach FID of Corpus Christi Stage 3 in 2022, which will result in additional cash requirements to fund the construction and operations of Corpus Christi Stage 3 in excess of our current contractual obligations under executed contracts discussed above. However, in connection with reaching FID, we expect to secure financing to meet the cash needs that Corpus Christi Stage 3 will initially require, in support of commercializing the project.
Beyond Corpus Christi Stage 3, our significant land positions at the Corpus Christi and Sabine Pass LNG terminals provide potential development and investment opportunities for further liquefaction capacity expansion at strategically advantaged locations with proximity to pipeline infrastructure and resources. We expect that any potential future expansion at the Corpus Christi or Sabine Pass LNG terminals would increase cash requirements to support expanded operations, although expansion could be designed to leverage shared infrastructure to reduce the incremental costs of any potential expansion.
Future Cash Requirements for Financing under Executed Contracts
We are committed to make future cash payments for financing pursuant to certain of our contracts. The following table summarizes our estimate of material cash requirements for financing under executed contracts as of December 31, 2021 (in billions):
| | | | | | | | | | | | | | | | | | | | | | | | |
| | | Estimated Payments Due Under Executed Contracts by Period (1) |
| | | | | | | | |
| | | 2022 | | 2023 - 2026 | | Thereafter | | Total |
| Debt (2) | | $ | 0.9 | | | $ | 11.5 | | | $ | 17.9 | | | $ | 30.3 | |
| Interest payments (2) | | 1.4 | | | 4.3 | | | 2.6 | | | 8.3 | |
| Total | | $ | 2.3 | | | $ | 15.8 | | | $ | 20.5 | | | $ | 38.6 | |
(1)The estimates above reflect management’s assumptions and currently known market conditions and other factors as of December 31, 2021. Estimates are not guarantees of future performance and actual results may differ materially as a result of a variety of factors described in this annual report on Form 10-K.
(2)Debt and interest payments are based on the total debt balance, scheduled contractual maturities and fixed or estimated forward interest rates in effect at December 31, 2021, excluding debt and interest payments on the 2045 Cheniere Convertible Senior Notes which are based on the redemption payment made January 5, 2022. In December 2021, we issued a notice of redemption for all $0.6 billion aggregate principal amount outstanding of the 2045 Cheniere Convertible Senior Notes. The redemption payment of $0.5 billion is included in 2022 debt payments for consistency
with expected cash flow presentation in our Consolidated Statements of Cash Flows when the instrument settles. Other than debt and interest payments on the 2045 Cheniere Convertible Senior Notes, debt and interest payments do not contemplate repurchases, repayments and retirements that we expect to make prior to contractual maturity. See further discussion in Note 11—Debt of our Notes to Consolidated Financial Statements.
Debt
As of December 31, 2021, our debt complex was comprised of senior notes with an aggregate outstanding principal balance of $27.8 billion, credit facilities with an aggregate outstanding balance of $2.0 billion and convertible notes with an outstanding principal balance of $625 million. As of December 31, 2021, each of our issuers was in compliance with all covenants related to their respective debt agreements. Further discussion of our debt obligations, including the restrictions imposed by these arrangements, can be found in Note 11—Debt of our Notes to Consolidated Financial Statements.
Interest
As of December 31, 2021, our senior notes had a weighted average contractual interest rate of 4.84%, our credit facilities had weighted average interest rates on outstanding balances ranging from 1.85% to 3.50% and our convertible notes had an effective interest rate of 9.4%. Borrowings under our credit facilities are indexed to LIBOR, which is expected to be phased out by 2023. It is currently unclear whether LIBOR will be utilized beyond that date or whether it will be replaced by a particular rate. We amended certain credit facilities in 2021 to establish a SOFR-indexed replacement rate for LIBOR. We intend to continue working with our lenders and counterparties to pursue amendments to our debt and interest rate swap agreements that are currently indexed to LIBOR. Undrawn commitments under our credit facilities are subject to commitment fees ranging from 0.20% to 0.50%. Issued letters of credit under our credit facilities are subject to letter of credit fees ranging from 1.25% to 1.625%. We had $756 million aggregate amount of issued letters of credit under our credit facilities as of December 31, 2021.
Additional Future Cash Requirements for Financing
CQP Distribution
CQP is required by its partnership agreement to distribute to unitholders all available cash at the end of a quarter less the amount of any reserves established by its general partner. We own a 48.6% limited partner interest in CQP in the form of 239.9 million common units, with the remaining non-controlling limited partner interest held by Blackstone Inc., Brookfield Asset Management Inc. and the public. During the year ended December 31, 2021, CQP paid $649 million in distributions to its non-controlling interest.
Capital Allocation Plan
Cheniere Dividend
In September 2021, Cheniere declared an inaugural quarterly dividend of $0.33 per common share. As of December 31, 2021, there were 253.6 million shares of our common stock outstanding. On January 25, 2022, we declared a quarterly dividend of $0.33 per common share that is payable on February 28, 2022 to shareholders of record as of February 7, 2022.
Share Repurchase Program
In 2019, our Board authorized a three-year, $1.0 billion share repurchase program. In 2021, our Board authorized a reset of the share repurchase program, which reset the available balance to $1.0 billion, inclusive of any amounts remaining under the previous authorization as of September 30, 2021, for an additional three years beginning on October 1, 2021. As of December 31, 2021, we had up to $998 million available under the share repurchase program. The timing and amount of any shares of our common stock that are repurchased under the share repurchase program will be determined by management based on market conditions and other factors. During the year ended December 31, 2021, we repurchased a total of 0.1 million shares of our common stock for $9 million at a weighted average price per share of $87.32. A discussion of our share repurchase program can be found in Item 5. Market for Registrant’s Common Equity, Related Stockholders Matters and Issuer Purchase of Equity Securities.
Debt Repurchases, Repayments and Redemptions
We expect to repurchase, repay or redeem approximately $1.0 billion of existing indebtedness each year through 2024, with the intent of reaching investment grade consolidated credit metrics by the early-to-mid 2020s. Going forward, we expect to prioritize repayment of secured callable or maturing project debt to strengthen project credit metrics and lessen subordination of the corporate level credit profiles.
Financially Disciplined Growth
We expect to reach FID of Corpus Christi Stage 3 in 2022, which will increase cash requirements for financing the construction of Corpus Christi Stage 3. To the extent that liquefaction capacity at the Corpus Christi and Sabine Pass LNG terminals is expanded beyond the Liquefaction Projects and Corpus Christi Stage 3, we expect that additional financing would be used to fund construction of the expansion.
Sources and Uses of Cash
The following table summarizes the sources and uses of our cash, cash equivalents and restricted cash and cash equivalents for the years ended December 31, 2021 and 2020 (in millions). The table presents capital expenditures on a cash basis; therefore, these amounts differ from the amounts of capital expenditures, including accruals, which are referred to elsewhere in this report. Additional discussion of these items follows the table.
| | | | | | | | | | | | | |
| Year Ended December 31, |
| 2021 | | 2020 | | |
| | | | | |
| Net cash provided by operating activities | $ | 2,469 | | | $ | 1,265 | | | |
| Net cash used in investing activities | (912) | | | (1,947) | | | |
| Net cash used in financing activities | (1,817) | | | (235) | | | |
| | | | | |
| | | | | |
| | | | | |
| | | | | |
| | | | | |
| | | | | |
| | | | | |
| | | | | |
| | | | | |
| | | | | |
| | | | | |
| | | | | |
| | | | | |
| | | | | |
| | | | | |
| | | | | |
| | | | | |
| Net decrease in cash, cash equivalents and restricted cash and cash equivalents | $ | (260) | | | $ | (917) | | | |
| | | | | |
| | | | | |
Operating Cash Flows
Our operating cash net inflows during the years ended December 31, 2021 and 2020 were $2,469 million and $1,265 million, respectively. The $1,204 million increase in operating cash inflows in 2021 compared to 2020 was primarily related to increased cash receipts from the sale of LNG cargoes due to higher revenue per MMBtu and higher volume of LNG delivered, as well as from higher than normal contributions from LNG and natural gas portfolio optimization activities due to significant volatility in LNG and natural gas markets during the year ended December 31, 2021. Partially offsetting these operating cash inflows were higher operating cash outflows due to higher natural gas feedstock costs and payment of paid-in-kind interest on our convertible notes.
Investing Cash Flows
Our investing cash net outflows in both years primarily was for the construction costs for the Liquefaction Projects. The $1,035 million decrease in 2021 compared to 2020 was primarily due to the completion of Train 3 of the CCL Project in March 2021, which was under construction throughout 2020. These costs are capitalized as construction-in-process until achievement of substantial completion. Additionally, we purchased land adjacent to the CCL Project for potential future expansion purposes and received proceeds from the sale of fixed assets from divestment of non-core land holdings.
Financing Cash Flows
During the year ended December 31, 2021, we had total debt issuances of $5,911 million, which was comprised of $3,932 million aggregate principal amount of senior notes and aggregate borrowings of $1,979 million under our credit facilities. The proceeds from these issuances and borrowings, together with cash on hand, were used to redeem or repay a total of $6,810 million in debt, comprised of $3,600 million aggregate principal amount of senior notes, $295 million of our 4.875% Convertible Unsecured Notes due 2021 (“2021 Cheniere Convertible Notes”) and $2,915 million aggregate outstanding borrowings under our credit facilities.
During the year ended December 31, 2020, we had total debt issuances of $7,823 million, which was comprised of $4,764 million aggregate principal amount of senior notes and aggregate borrowings of $3,059 million under our credit
facilities. The proceeds from these issuances and borrowings, together with cash on hand, were used to redeem or repay a total of $6,940 million in debt, comprised of $2.0 billion aggregate principal amount of SPL’s 5.625% Senior Secured Notes due 2021 (the “2021 SPL Senior Notes”) $1,513 million of our convertible notes and $3,427 million aggregate outstanding borrowings under our credit facilities. Additionally, during the year ended December 31, 2020, we entered into the 2020 SPL Working Capital Facility to replace the previous working capital facility.
Debt Issuances and Related Financing Costs
The following table shows the issuances of debt during the years ended December 31, 2021 and 2020, including intra-quarter borrowings (in millions):
| | | | | | | | | | | | | | | | |
| | Year Ended December 31, |
| | 2021 | | 2020 | | |
| | | | | | |
| SPL: | | | | | | |
| 4.500% Senior Secured Notes due 2030 | | $ | — | | | $ | 1,995 | | | |
2037 SPL Private Placement Senior Secured Notes | | 482 | | | — | | | |
| | | | | | |
| CQP: | | | | | | |
| | | | | | |
2031 CQP Senior Notes | | 1,500 | | | — | | | |
2032 CQP Senior Notes | | 1,200 | | | — | | | |
| | | | | | |
| | | | | | |
| CCH: | | | | | | |
| | | | | | |
3.72% weighted average rate Senior Secured Notes due 2039 | | 750 | | | 769 | | | |
| | | | | | |
| CCH Working Capital Facility | | 400 | | | 281 | | | |
| | | | | | |
| Cheniere: | | | | | | |
| 4.625% Senior Secured Notes due 2028 | | — | | | 2,000 | | | |
| Cheniere Revolving Credit Facility | | 1,359 | | | 455 | | | |
| Cheniere’s term loan facility (“Cheniere Term Loan Facility”) | | 220 | | | 2,323 | | | |
| Total issuances | | $ | 5,911 | | | $ | 7,823 | | | |
During the years ended December 31, 2021 and 2020, we incurred debt issuance costs and other financing costs of $53 million and $125 million, respectively, related to the debt issuances above and closing of credit facilities during the respective periods.
Debt Redemptions and Repayments and Related Modification or Extinguishment Costs
The following table shows the redemptions and repayments of debt during the years ended December 31, 2021 and 2020, including intra-quarter repayments (in millions):
| | | | | | | | | | | | | | | | |
| | Year Ended December 31, |
| | 2021 | | 2020 | | |
| | | | | | |
| SPL: | | | | | | |
2021 SPL Senior Notes | | $ | — | | | $ | (2,000) | | | |
| 2022 SPL Senior Notes | | (1,000) | | | — | | | |
| | | | | | |
| CQP: | | | | | | |
2025 CQP Senior Notes | | (1,500) | | | — | | | |
2026 CQP Senior Notes | | (1,100) | | | — | | | |
| | | | | | |
| | | | | | |
| CCH: | | | | | | |
CCH Credit Facility | | (898) | | | (141) | | | |
| CCH Working Capital Facility | | (290) | | | (656) | | | |
| | | | | | |
| Cheniere: | | | | | | |
| 11% Convertible Senior Secured Notes due 2025 | | — | | | (1,000) | | | |
2021 Cheniere Convertible Notes | | (295) | | | (513) | | | |
| Cheniere Revolving Credit Facility | | (1,359) | | | (455) | | | |
| Cheniere Term Loan Facility | | (368) | | | (2,175) | | | |
| | | | | | |
| Total redemption and repayments | | $ | (6,810) | | | $ | (6,940) | | | |
| | | | | | |
| | | | | | |
| | | | | | |
| | | | | | |
| | | | | | |
| | | | | | |
| | | | | | |
| | | | | | |
| | | | | | |
| | | | | | |
| | | | | | |
| | | | | | |
| | | | | | |
| | | | | | |
| | | | | | |
| | | | | | |
| | | | | | |
| | | | | | |
| | | | | | |
| | | | | | |
During the years ended December 31, 2021 and 2020, we incurred debt modification or extinguishment costs of $82 million and $172 million, respectively, related to these redemptions and repayments, primarily for the payment of early redemption fees and write off of unamortized issuance costs.
Non-Controlling Interest Distributions
In addition to the above debt transactions, CQP paid distributions during the years ended December 31, 2021, 2020 and 2019 to non-controlling interests since we own 48.6% limited partner interest in CQP and the remaining non-controlling interest is held by Blackstone Inc., Brookfield Asset Management Inc. and the public. During the year ended December 31, 2021, CQP paid $649 million in distributions to its non-controlling interest. During the years ended December 31, 2021 and 2020, we also paid $9 million and $155 million, respectively, to repurchase approximately 0.1 million shares and 2.9 million shares, respectively, of our common stock under our share repurchase program.
Summary of Critical Accounting Estimates
The preparation of Consolidated Financial Statements in conformity with GAAP requires management to make certain estimates and assumptions that affect the amounts reported in the Consolidated Financial Statements and the accompanying notes. Management evaluates its estimates and related assumptions regularly, including those related to the valuation of derivative instruments. Changes in facts and circumstances or additional information may result in revised estimates, and actual results may differ from these estimates. Management considers the following to be its most critical accounting estimates that involve significant judgment.
Fair Value of Derivative Instruments
All derivative instruments, other than those that satisfy specific exceptions, are recorded at fair value. We record changes in the fair value of our derivative positions through earnings, based on the value for which the derivative instrument could be exchanged between willing parties. If market quotes are not available to estimate fair value, management’s best estimate of fair value is based on the quoted market price of derivatives with similar characteristics or determined through industry-standard valuation approaches. Such evaluations may involve significant judgment and the results are based on expected future events or conditions, particularly for those valuations using inputs unobservable in the market as discussed below.
Our derivative instruments consist of interest rate swaps, financial commodity derivative contracts transacted in an over-the-counter market, physical commodity contracts and foreign currency exchange (“FX”) contracts. We value our interest rate swaps using observable inputs including interest rate curves, risk adjusted discount rates, credit spreads and other relevant data. Valuation of our financial commodity derivative contracts is determined using observable commodity price curves and other relevant data. We estimate the fair values of our FX derivative instruments using observable FX rates and other relevant data.
Valuation of our physical commodity derivative contracts, consisting primarily of natural gas supply contracts for the operation of our liquified natural gas facilities, is often developed through the use of internal models which incorporate significant observable and unobservable inputs. In instances where observable data is unavailable, consideration is given to the assumptions that market participants would use in valuing the asset or liability. This includes assumptions about market risks, such as future prices of energy units for unobservable periods, liquidity and volatility, and associated events deriving fair value including, but not limited to, evaluation of whether the respective market exists from the perspective of market participants as infrastructure is developed.
The valuation of certain physical commodity derivatives requires the use of significant unobservable inputs and judgment in estimating underlying forward commodity curves due to periods of unobservability or limited liquidity. Such valuations are more susceptible to variability particularly when markets are volatile. Provided below is the change in unrealized valuation gain (loss) of instruments valued through the use of internal models which incorporate significant unobservable inputs for the years ended December 31, 2021 and 2020 (in millions). The changes shown are limited to instruments still held at the end of each respective period.
| | | | | | | | | | | |
| Year Ended December 31, |
| 2021 | | 2020 |
| Change in unrealized gain (loss) relating to instruments still held at end of period | $ | (4,305) | | | $ | 156 | |
The $4.3 billion unrealized valuation loss on instruments held during the year ended December 31, 2021 is primarily attributed to significant appreciation in estimated forward international LNG commodity curves on our IPM agreements from December 31, 2020 to December 31, 2021, relative to prior comparative period.
The ultimate fair value of our derivative instruments is uncertain, and we believe that it is reasonably possible that a material change in the estimated fair value could occur in the near future, particularly as it relates to commodity prices given the level of volatility in the current year. See Item 7A. Quantitative and Qualitative Disclosures About Market Risk for further analysis of the sensitivity of the fair value of our derivatives to hypothetical changes in underlying prices.
Recent Accounting Standards
ITEM 7A. QUANTITATIVE AND QUALITATIVE DISCLOSURES ABOUT MARKET RISK
Marketing and Trading Commodity Price Risk
We have entered into commodity derivatives consisting of natural gas supply contracts for the commissioning and operation of the SPL Project, the CCL Project and potential future development of Corpus Christi Stage 3 (“Liquefaction Supply Derivatives”). We have also entered into physical and financial derivatives to hedge the exposure to the commodity markets in which we have contractual arrangements to purchase or sell physical LNG (collectively, “LNG Trading Derivatives”). In order to test the sensitivity of the fair value of the Liquefaction Supply Derivatives and the LNG Trading Derivatives to changes in underlying commodity prices, management modeled a 10% change in the commodity price for natural gas for each delivery location and a 10% change in the commodity price for LNG, respectively, as follows (in millions):
| | | | | | | | | | | | | | | | | | | | | | | |
| December 31, 2021 | | December 31, 2020 |
| Fair Value | | Change in Fair Value | | Fair Value | | Change in Fair Value |
| Liquefaction Supply Derivatives | $ | (4,038) | | | $ | 903 | | | $ | 240 | | | $ | 204 | |
| LNG Trading Derivatives | (400) | | | 38 | | | (134) | | | 44 | |
See Note 7—Derivative Instruments of our Notes to Consolidated Financial Statements for additional details about our derivative instruments.
Interest Rate Risk
We are exposed to interest rate risk primarily when we incur debt related to project financing. Interest rate risk is managed in part by replacing outstanding floating-rate debt with fixed-rate debt with varying maturities. CCH has entered into interest rate swaps to hedge the exposure to volatility in a portion of the floating-rate interest payments under the CCH Credit Facility (“CCH Interest Rate Derivatives”). In order to test the sensitivity of the fair value of the CCH Interest Rate Derivatives to changes in interest rates, management modeled a 10% change in the forward one-month LIBOR curve across the remaining terms of the CCH Interest Rate Derivatives as follows (in millions):
| | | | | | | | | | | | | | | | | | | | | | | |
| December 31, 2021 | | December 31, 2020 |
| Fair Value | | Change in Fair Value | | Fair Value | | Change in Fair Value |
| CCH Interest Rate Derivatives | $ | (40) | | | $ | — | | | $ | (140) | | | $ | 1 | |
| | | | | | | |
See Note 7—Derivative Instruments of our Notes to Consolidated Financial Statements for additional details about our derivative instruments.
Foreign Currency Exchange Risk
We have entered into foreign currency exchange (“FX”) contracts to hedge exposure to currency risk associated with operations in countries outside of the United States (“FX Derivatives”). In order to test the sensitivity of the fair value of the FX Derivatives to changes in FX rates, management modeled a 10% change in FX rate between the U.S. dollar and the applicable foreign currencies as follows (in millions):
| | | | | | | | | | | | | | | | | | | | | | | |
| December 31, 2021 | | December 31, 2020 |
| Fair Value | | Change in Fair Value | | Fair Value | | Change in Fair Value |
| FX Derivatives | $ | 12 | | | $ | 2 | | | $ | (22) | | | $ | 2 | |
See Note 7—Derivative Instruments of our Notes to Consolidated Financial Statements for additional details about our derivative instruments.
ITEM 8. FINANCIAL STATEMENTS AND SUPPLEMENTARY DATA
INDEX TO CONSOLIDATED FINANCIAL STATEMENTS
CHENIERE ENERGY, INC. AND SUBSIDIARIES
MANAGEMENT’S REPORT TO THE STOCKHOLDERS OF CHENIERE ENERGY, INC.
Management’s Report on Internal Control Over Financial Reporting
As management, we are responsible for establishing and maintaining adequate internal control over financial reporting for Cheniere Energy, Inc. and its subsidiaries (“Cheniere”). In order to evaluate the effectiveness of internal control over financial reporting, as required by Section 404 of the Sarbanes-Oxley Act of 2002, we have conducted an assessment, including testing using the criteria in Internal Control—Integrated Framework (2013) issued by the Committee of Sponsoring Organizations of the Treadway Commission (“COSO”). Cheniere’s system of internal control over financial reporting is designed to provide reasonable assurance regarding the reliability of financial reporting and the preparation of financial statements for external purposes in accordance with accounting principles generally accepted in the United States of America. Because of its inherent limitations, internal control over financial reporting may not prevent or detect misstatements and, even when determined to be effective, can only provide reasonable assurance with respect to financial statement preparation and presentation.
Based on our assessment, we have concluded that Cheniere maintained effective internal control over financial reporting as of December 31, 2021, based on criteria in Internal Control—Integrated Framework (2013) issued by the COSO.
Cheniere’s independent registered public accounting firm, KPMG LLP, has issued an audit report on Cheniere’s internal control over financial reporting as of December 31, 2021, which is contained in this Form 10-K.
Management’s Certifications
The certifications of Cheniere’s Chief Executive Officer and Chief Financial Officer required by the Sarbanes-Oxley Act of 2002 have been included as Exhibits 31 and 32 in Cheniere’s Form 10-K.
CHENIERE ENERGY, INC.
| | | | | | | | | | | | | | |
| | | | | |
| By: | /s/ Jack A. Fusco | | By: | /s/ Zach Davis |
| Jack A. Fusco | | | Zach Davis |
| | President and Chief Executive Officer
(Principal Executive Officer) | | | Executive Vice President and Chief Financial Officer
(Principal Financial Officer) |
REPORT OF INDEPENDENT REGISTERED PUBLIC ACCOUNTING FIRM
To the Stockholders and Board of Directors
Cheniere Energy, Inc.:
Opinion on the Consolidated Financial Statements
We have audited the accompanying consolidated balance sheets of Cheniere Energy, Inc. and subsidiaries (the Company) as of December 31, 2021 and 2020, the related consolidated statements of operations, stockholders’ equity (deficit), and cash flows for each of the years in the three-year period ended December 31, 2021, and the related notes and financial statement schedules I to II (collectively, the consolidated financial statements). In our opinion, the consolidated financial statements present fairly, in all material respects, the financial position of the Company as of December 31, 2021 and 2020, and the results of its operations and its cash flows for each of the years in the three-year period ended December 31, 2021, in conformity with U.S. generally accepted accounting principles.
We also have audited, in accordance with the standards of the Public Company Accounting Oversight Board (United States) (PCAOB), the Company’s internal control over financial reporting as of December 31, 2021, based on criteria established in Internal Control—Integrated Framework (2013) issued by the Committee of Sponsoring Organizations of the Treadway Commission, and our report dated February 23, 2022 expressed an unqualified opinion on the effectiveness of the Company’s internal control over financial reporting.
Basis for Opinion
These consolidated financial statements are the responsibility of the Company’s management. Our responsibility is to express an opinion on these consolidated financial statements based on our audits. We are a public accounting firm registered with the PCAOB and are required to be independent with respect to the Company in accordance with the U.S. federal securities laws and the applicable rules and regulations of the Securities and Exchange Commission and the PCAOB.
We conducted our audits in accordance with the standards of the PCAOB. Those standards require that we plan and perform the audit to obtain reasonable assurance about whether the consolidated financial statements are free of material misstatement, whether due to error or fraud. Our audits included performing procedures to assess the risks of material misstatement of the consolidated financial statements, whether due to error or fraud, and performing procedures that respond to those risks. Such procedures included examining, on a test basis, evidence regarding the amounts and disclosures in the consolidated financial statements. Our audits also included evaluating the accounting principles used and significant estimates made by management, as well as evaluating the overall presentation of the consolidated financial statements. We believe that our audits provide a reasonable basis for our opinion.
Critical Audit Matter
The critical audit matter communicated below is a matter arising from the current period audit of the consolidated financial statements that was communicated or required to be communicated to the audit committee and that: (1) relates to accounts or disclosures that are material to the consolidated financial statements and (2) involved our especially challenging, subjective, or complex judgments. The communication of a critical audit matter does not alter in any way our opinion on the consolidated financial statements, taken as a whole, and we are not, by communicating the critical audit matter below, providing a separate opinion on the critical audit matter or on the accounts or disclosures to which it relates.
Fair value of the level 3 physical liquefaction supply derivatives
As discussed in Notes 2 and 7 to the consolidated financial statements, the Company recorded fair value of level 3 physical liquefaction supply derivatives of $(4,036) million, as of December 31, 2021. The physical liquefaction supply derivatives consist of natural gas supply contracts for the operation of the liquefied natural gas facilities. The fair value of the level 3 physical liquefaction supply derivatives is developed using internal models that incorporate significant unobservable inputs.
We identified the evaluation of the fair value of the level 3 physical liquefaction supply derivatives as a critical audit matter. Specifically, there is subjectivity in certain assumptions used to estimate the fair value, including assumptions for future prices of energy units for unobservable periods and liquidity.
The following are the primary procedures we performed to address this critical audit matter. We evaluated the design and tested the operating effectiveness of certain internal controls related to the valuation of the level 3 physical liquefaction
supply derivatives. This included controls related to the assumptions for significant unobservable inputs and the fair value model. For a selection of level 3 liquefaction supply derivatives, we involved valuation professionals with specialized skills and knowledge who assisted in:
•evaluating the future prices of energy units for observable periods by comparing to market data, including quoted or published forward prices
•developing independent fair value estimates and comparing the independently developed estimates to the Company’s fair value estimates.
In addition, we evaluated the Company’s assumptions for future prices of energy units for unobservable periods and liquidity by comparing them to market or third-party data, including adjustments for third party quoted transportation prices.
We have served as the Company’s auditor since 2014.
Houston, Texas
February 23, 2022
REPORT OF INDEPENDENT REGISTERED PUBLIC ACCOUNTING FIRM
To the Stockholders and Board of Directors
Cheniere Energy, Inc.:
Opinion on Internal Control Over Financial Reporting
We have audited Cheniere Energy, Inc. and subsidiaries’ (the Company) internal control over financial reporting as of December 31, 2021, based on criteria established in Internal Control—Integrated Framework (2013) issued by the Committee of Sponsoring Organizations of the Treadway Commission. In our opinion, the Company maintained, in all material respects, effective internal control over financial reporting as of December 31, 2021, based on criteria established in Internal Control—Integrated Framework (2013) issued by the Committee of Sponsoring Organizations of the Treadway Commission.
We also have audited, in accordance with the standards of the Public Company Accounting Oversight Board (United States) (PCAOB), the consolidated balance sheets of the Company as of December 31, 2021 and 2020, the related consolidated statements of operations, stockholders’ equity (deficit), and cash flows for each of the years in the three-year period ended December 31, 2021, and the related notes and financial statement schedules I to II (collectively, the consolidated financial statements), and our report dated February 23, 2022 expressed an unqualified opinion on those consolidated financial statements.
Basis for Opinion
The Company’s management is responsible for maintaining effective internal control over financial reporting and for its assessment of the effectiveness of internal control over financial reporting, included in the accompanying Management’s Report on Internal Control Over Financial Reporting. Our responsibility is to express an opinion on the Company’s internal control over financial reporting based on our audit. We are a public accounting firm registered with the PCAOB and are required to be independent with respect to the Company in accordance with the U.S. federal securities laws and the applicable rules and regulations of the Securities and Exchange Commission and the PCAOB.
We conducted our audit in accordance with the standards of the PCAOB. Those standards require that we plan and perform the audit to obtain reasonable assurance about whether effective internal control over financial reporting was maintained in all material respects. Our audit of internal control over financial reporting included obtaining an understanding of internal control over financial reporting, assessing the risk that a material weakness exists, and testing and evaluating the design and operating effectiveness of internal control based on the assessed risk. Our audit also included performing such other procedures as we considered necessary in the circumstances. We believe that our audit provides a reasonable basis for our opinion.
Definition and Limitations of Internal Control Over Financial Reporting
A company’s internal control over financial reporting is a process designed to provide reasonable assurance regarding the reliability of financial reporting and the preparation of financial statements for external purposes in accordance with generally accepted accounting principles. A company’s internal control over financial reporting includes those policies and procedures that (1) pertain to the maintenance of records that, in reasonable detail, accurately and fairly reflect the transactions and dispositions of the assets of the company; (2) provide reasonable assurance that transactions are recorded as necessary to permit preparation of financial statements in accordance with generally accepted accounting principles, and that receipts and expenditures of the company are being made only in accordance with authorizations of management and directors of the company; and (3) provide reasonable assurance regarding prevention or timely detection of unauthorized acquisition, use, or disposition of the company’s assets that could have a material effect on the financial statements.
Because of its inherent limitations, internal control over financial reporting may not prevent or detect misstatements. Also, projections of any evaluation of effectiveness to future periods are subject to the risk that controls may become inadequate because of changes in conditions, or that the degree of compliance with the policies or procedures may deteriorate.
Houston, Texas
February 23, 2022
CHENIERE ENERGY, INC. AND SUBSIDIARIES
CONSOLIDATED STATEMENTS OF OPERATIONS
(in millions, except per share data)
| | | | | | | | | | | | | | | | | | | | | |
| | | Year Ended December 31, |
| | | | | 2021 | | 2020 | | 2019 |
| Revenues | | | | | | | | | |
| LNG revenues | | | | | $ | 15,395 | | | $ | 8,924 | | | $ | 9,246 | |
| Regasification revenues | | | | | 269 | | | 269 | | | 266 | |
| Other revenues | | | | | 200 | | | 165 | | | 218 | |
| | | | | | | | | |
| Total revenues | | | | | 15,864 | | | 9,358 | | | 9,730 | |
| | | | | | | | | |
| Operating costs and expenses | | | | | | | | | |
| Cost of sales (excluding items shown separately below) | | | | | 13,773 | | | 4,161 | | | 5,079 | |
| | | | | | | | | |
| Operating and maintenance expense | | | | | 1,444 | | | 1,320 | | | 1,154 | |
| Development expense | | | | | 7 | | | 6 | | | 9 | |
| Selling, general and administrative expense | | | | | 325 | | | 302 | | | 310 | |
| Depreciation and amortization expense | | | | | 1,011 | | | 932 | | | 794 | |
| | | | | | | | | |
| Impairment expense and loss on disposal of assets | | | | | 5 | | | 6 | | | 23 | |
| | | | | | | | | |
| | | | | | | | | |
| Total operating costs and expenses | | | | | 16,565 | | | 6,727 | | | 7,369 | |
| | | | | | | | | |
| Income (loss) from operations | | | | | (701) | | | 2,631 | | | 2,361 | |
| | | | | | | | | |
| Other expense | | | | | | | | | |
| Interest expense, net of capitalized interest | | | | | (1,438) | | | (1,525) | | | (1,432) | |
| Loss on modification or extinguishment of debt | | | | | (116) | | | (217) | | | (55) | |
| Interest rate derivative loss, net | | | | | (1) | | | (233) | | | (134) | |
| Other expense, net | | | | | (22) | | | (112) | | | (25) | |
| Total other expense | | | | | (1,577) | | | (2,087) | | | (1,646) | |
| | | | | | | | | |
| Income (loss) before income taxes and non-controlling interest | | | | | (2,278) | | | 544 | | | 715 | |
| Less: income tax provision (benefit) | | | | | (713) | | | 43 | | | (517) | |
| Net income (loss) | | | | | (1,565) | | | 501 | | | 1,232 | |
| Less: net income attributable to non-controlling interest | | | | | 778 | | | 586 | | | 584 | |
| Net income (loss) attributable to common stockholders | | | | | $ | (2,343) | | | $ | (85) | | | $ | 648 | |
| | | | | | | | | |
| Net income (loss) per share attributable to common stockholders—basic | | | | | $ | (9.25) | | | $ | (0.34) | | | $ | 2.53 | |
| Net income (loss) per share attributable to common stockholders—diluted | | | | | $ | (9.25) | | | $ | (0.34) | | | $ | 2.51 | |
| | | | | | | | | |
| Weighted average number of common shares outstanding—basic | | | | | 253.4 | | | 252.4 | | | 256.2 | |
| Weighted average number of common shares outstanding—diluted | | | | | 253.4 | | | 252.4 | | | 258.1 | |
The accompanying notes are an integral part of these consolidated financial statements.
57
CHENIERE ENERGY, INC. AND SUBSIDIARIES
CONSOLIDATED BALANCE SHEETS (1)
(in millions, except share data)
| | | | | | | | | | | |
| December 31, |
| | | |
| 2021 | | 2020 |
| ASSETS | | | |
| Current assets | | | |
| Cash and cash equivalents | $ | 1,404 | | | $ | 1,628 | |
| Restricted cash and cash equivalents | 413 | | | 449 | |
| Accounts and other receivables, net of current expected credit losses | 1,506 | | | 647 | |
| | | |
| Inventory | 706 | | | 292 | |
| Current derivative assets | 55 | | | 32 | |
| Margin deposits | 765 | | | 25 | |
| Other current assets | 207 | | | 96 | |
| Total current assets | 5,056 | | | 3,169 | |
| | | |
| | | |
| Property, plant and equipment, net of accumulated depreciation | 30,288 | | | 30,421 | |
| Operating lease assets | 2,102 | | | 759 | |
| | | |
| Derivative assets | 69 | | | 376 | |
| Goodwill | 77 | | | 77 | |
| Deferred tax assets | 1,204 | | | 489 | |
| Other non-current assets, net | 462 | | | 406 | |
| Total assets | $ | 39,258 | | | $ | 35,697 | |
| | | |
| LIABILITIES AND STOCKHOLDERS’ EQUITY | | | |
| Current liabilities | | | |
| Accounts payable | $ | 155 | | | $ | 35 | |
| Accrued liabilities | 2,299 | | | 1,175 | |
| | | |
| Current debt, net of discount and debt issuance costs | 366 | | | 372 | |
| Deferred revenue | 155 | | | 138 | |
| Current operating lease liabilities | 535 | | | 161 | |
| Current derivative liabilities | 1,089 | | | 313 | |
| Other current liabilities | 94 | | | 2 | |
| Total current liabilities | 4,693 | | | 2,196 | |
| | | |
| Long-term debt, net of premium, discount and debt issuance costs | 29,449 | | | 30,471 | |
| Operating lease liabilities | 1,541 | | | 597 | |
| Finance lease liabilities | 57 | | | 57 | |
| | | |
| Derivative liabilities | 3,501 | | | 151 | |
| Other non-current liabilities | 50 | | | 7 | |
| | | |
| Commitments and contingencies (see Note 20) | | | |
| | | |
| Stockholders’ equity | | | |
Preferred stock, $0.0001 par value, 5.0 million shares authorized, none issued | — | | | — | |
Common stock, $0.003 par value, 480.0 million shares authorized; 275.2 million shares and 273.1 million shares issued at December 31, 2021 and 2020, respectively | 1 | | | 1 | |
| | | |
| | | |
| | | |
Treasury stock: 21.6 million shares and 20.8 million shares at December 31, 2021 and 2020, respectively, at cost | (928) | | | (872) | |
| Additional paid-in-capital | 4,377 | | | 4,273 | |
| Accumulated deficit | (6,021) | | | (3,593) | |
| Total stockholders' deficit | (2,571) | | | (191) | |
| Non-controlling interest | 2,538 | | | 2,409 | |
| Total equity (deficit) | (33) | | | 2,218 | |
| Total liabilities and stockholders’ equity (deficit) | $ | 39,258 | | | $ | 35,697 | |
(1)Amounts presented include balances held by our consolidated variable interest entity (“VIE”), CQP, as further discussed in Note 9—Non-controlling Interest and Variable Interest Entity. As of December 31, 2021, total assets and liabilities of CQP, which are included in our Consolidated Balance Sheets, were $19.0 billion and $18.6 billion, respectively, including $0.9 billion of cash and cash equivalents and $0.1 billion of restricted cash and cash equivalents.
The accompanying notes are an integral part of these consolidated financial statements.
58
CHENIERE ENERGY, INC. AND SUBSIDIARIES
CONSOLIDATED STATEMENTS OF STOCKHOLDERS’ EQUITY (DEFICIT)
(in millions)
| | | | | | | | | | | | | | | | | | | | | | | | | | | | | | | | | | | | | | | | | | | | | | | |
| | | | | | | | | | | | | | | |
| Total Stockholders’ Equity | | | |
| | Common Stock | | Treasury Stock | | Additional Paid-in Capital | | Accumulated Deficit | | Non-controlling Interest | | Total
Equity |
| | Shares | | Par Value Amount | | Shares | | Amount | | | | |
| Balance at December 31, 2018 | 257.0 | | | $ | 1 | | | 12.8 | | | $ | (406) | | | $ | 4,035 | | | $ | (4,156) | | | $ | 2,455 | | | $ | 1,929 | |
| Vesting of restricted stock units | 0.9 | | | — | | | — | | | — | | | — | | | — | | | — | | | — | |
| | | | | | | | | | | | | | | |
| | | | | | | | | | | | | | | |
| Share-based compensation | — | | | — | | | — | | | — | | | 131 | | | — | | | — | | | 131 | |
| Shares withheld from employees related to share-based compensation, at cost | (0.3) | | | — | | | 0.3 | | | (19) | | | — | | | — | | | — | | | (19) | |
| Shares repurchased, at cost | (4.0) | | | — | | | 4.0 | | | (249) | | | — | | | — | | | — | | | (249) | |
| Net income attributable to non-controlling interest | — | | | — | | | — | | | — | | | — | | | — | | | 584 | | | 584 | |
| Reacquisition of equity portion of convertible notes, net of tax | — | | | — | | | — | | | — | | | 1 | | | — | | | — | | | 1 | |
| Distributions and dividends to non-controlling interest | — | | | — | | | — | | | — | | | — | | | — | | | (590) | | | (590) | |
| Net income | — | | | — | | | — | | | — | | | — | | | 648 | | | — | | | 648 | |
| Balance at December 31, 2019 | 253.6 | | | 1 | | | 17.1 | | | (674) | | | 4,167 | | | (3,508) | | | 2,449 | | | 2,435 | |
| Vesting of restricted stock units and performance stock units | 2.4 | | | — | | | — | | | — | | | — | | | — | | | — | | | — | |
| | | | | | | | | | | | | | | |
| | | | | | | | | | | | | | | |
| Share-based compensation | — | | | — | | | — | | | — | | | 114 | | | — | | | — | | | 114 | |
| Issued shares withheld from employees related to share-based compensation, at cost | (0.8) | | | — | | | 0.8 | | | (43) | | | — | | | — | | | — | | | (43) | |
| Shares repurchased, at cost | (2.9) | | | — | | | 2.9 | | | (155) | | | — | | | — | | | — | | | (155) | |
| Net loss attributable to non-controlling interest | — | | | — | | | — | | | — | | | — | | | — | | | 586 | | | 586 | |
| | | | | | | | | | | | | | | |
| Reacquisition of equity component of convertible notes, net of tax | — | | | — | | | — | | | — | | | (8) | | | — | | | — | | | (8) | |
| Distributions and dividends to non-controlling interest | — | | | — | | | — | | | — | | | — | | | — | | | (626) | | | (626) | |
| Net loss | — | | | — | | | — | | | — | | | — | | | (85) | | | — | | | (85) | |
| Balance at December 31, 2020 | 252.3 | | | 1 | | | 20.8 | | | (872) | | | 4,273 | | | (3,593) | | | 2,409 | | | 2,218 | |
| | | | | | | | | | | | | | | |
| | | | | | | | | | | | | | | |
| | | | | | | | | | | | | | | |
| | | | | | | | | | | | | | | |
| | | | | | | | | | | | | | | |
| | | | | | | | | | | | | | | |
| | | | | | | | | | | | | | | |
| | | | | | | | | | | | | | | |
| | | | | | | | | | | | | | | |
| | | | | | | | | | | | | | | |
| | | | | | | | | | | | | | | |
| | | | | | | | | | | | | | | |
| | | | | | | | | | | | | | | |
| | | | | | | | | | | | | | | |
| | | | | | | | | | | | | | | |
| | | | | | | | | | | | | | | |
| | | | | | | | | | | | | | | |
| Vesting of restricted stock units and performance stock units | 2.1 | | | — | | | — | | | — | | | — | | | — | | | — | | | — | |
| Share-based compensation | — | | | — | | | — | | | — | | | 105 | | | — | | | — | | | 105 | |
| Issued shares withheld from employees related to share-based compensation, at cost | (0.7) | | | — | | | 0.7 | | | (47) | | | (1) | | | — | | | — | | | (48) | |
| Shares repurchased, at cost | (0.1) | | | — | | | 0.1 | | | (9) | | | — | | | — | | | — | | | (9) | |
| Net income attributable to non-controlling interest | — | | | — | | | — | | | — | | | — | | | — | | | 778 | | | 778 | |
| | | | | | | | | | | | | | | |
| Distributions to non-controlling interest | — | | | — | | | — | | | — | | | — | | | — | | | (649) | | | (649) | |
Dividends declared ($0.33 per common share) | — | | | — | | | — | | | — | | | — | | | (85) | | | — | | | (85) | |
| Net loss | — | | | — | | | — | | | — | | | — | | | (2,343) | | | — | | | (2,343) | |
| Balance at December 31, 2021 | 253.6 | | | $ | 1 | | | 21.6 | | | $ | (928) | | | $ | 4,377 | | | $ | (6,021) | | | $ | 2,538 | | | $ | (33) | |
The accompanying notes are an integral part of these consolidated financial statements.
59
CHENIERE ENERGY, INC. AND SUBSIDIARIES
CONSOLIDATED STATEMENTS OF CASH FLOWS
(in millions)
| | | | | | | | | | | | | | | | | |
| Year Ended December 31, |
| | | |
| 2021 | | 2020 | | 2019 |
| Cash flows from operating activities | | | | | |
| Net income (loss) | $ | (1,565) | | | $ | 501 | | | $ | 1,232 | |
| Adjustments to reconcile net income (loss) to net cash provided by operating activities: | | | | | |
| Depreciation and amortization expense | 1,011 | | | 932 | | | 794 | |
| Share-based compensation expense | 140 | | | 110 | | | 131 | |
| Non-cash interest expense | 19 | | | 51 | | | 143 | |
| Amortization of debt issuance costs, premium and discount | 72 | | | 114 | | | 103 | |
| Reduction of right-of-use assets | 393 | | | 291 | | | 350 | |
| Loss on modification or extinguishment of debt | 116 | | | 217 | | | 55 | |
| Total losses (gains) on derivatives, net | 5,989 | | | 211 | | | (400) | |
| Net cash provided by (used for) settlement of derivative instruments | (1,579) | | | 74 | | | 138 | |
| Impairment expense and loss on disposal of assets | 5 | | | 6 | | | 23 | |
| Impairment expense and loss on equity method investments | 24 | | | 126 | | | 88 | |
| Deferred taxes | (715) | | | 40 | | | (521) | |
| Repayment of paid-in-kind interest related to repurchase of convertible notes | (190) | | | (911) | | | — | |
| Other | 4 | | | 2 | | | — | |
| Changes in operating assets and liabilities: | | | | | |
| Accounts and other receivables, net of current expected credit losses | (799) | | | (154) | | | 1 | |
| | | | | |
| Inventory | (409) | | | 21 | | | 11 | |
| Margin deposits | (741) | | | (13) | | | 6 | |
| Other current assets | (101) | | | (14) | | | (24) | |
| Accounts payable and accrued liabilities | 1,144 | | | 54 | | | 52 | |
| | | | | |
| Deferred revenue | 55 | | | (23) | | | 22 | |
| Operating lease liabilities | (418) | | | (277) | | | (366) | |
| | | | | |
| Other, net | 14 | | | (93) | | | (5) | |
| Net cash provided by operating activities | 2,469 | | | 1,265 | | | 1,833 | |
| | | | | |
| Cash flows from investing activities | | | | | |
| Property, plant and equipment | (966) | | | (1,839) | | | (3,056) | |
| Proceeds from sale of fixed assets | 68 | | | — | | | — | |
| Investment in equity method investment | — | | | (100) | | | (105) | |
| Other | (14) | | | (8) | | | (2) | |
| Net cash used in investing activities | (912) | | | (1,947) | | | (3,163) | |
| | | | | |
| Cash flows from financing activities | | | | | |
| Proceeds from issuances of debt | 5,911 | | | 7,823 | | | 6,434 | |
| Redemptions and repayments of debt | (6,810) | | | (6,940) | | | (4,346) | |
| Debt issuance and other financing costs | (53) | | | (125) | | | (51) | |
| Debt modification or extinguishment costs | (82) | | | (172) | | | (15) | |
| | | | | |
| Distributions to non-controlling interest | (649) | | | (626) | | | (590) | |
| Payments related to tax withholdings for share-based compensation | (48) | | | (43) | | | (19) | |
| Repurchase of common stock | (9) | | | (155) | | | (249) | |
| Cash dividends to shareholders | (85) | | | — | | | — | |
| Other | 8 | | | 3 | | | 4 | |
| Net cash provided by (used in) financing activities | (1,817) | | | (235) | | | 1,168 | |
| | | | | |
| Net decrease in cash, cash equivalents and restricted cash and cash equivalents | (260) | | | (917) | | | (162) | |
| Cash, cash equivalents and restricted cash and cash equivalents—beginning of period | 2,077 | | | 2,994 | | | 3,156 | |
| Cash, cash equivalents and restricted cash and cash equivalents—end of period | $ | 1,817 | | | $ | 2,077 | | | $ | 2,994 | |
Balances per Consolidated Balance Sheets:
| | | | | | | | | | | |
| December 31, |
| 2021 | | 2020 |
| Cash and cash equivalents | $ | 1,404 | | | $ | 1,628 | |
| Restricted cash and cash equivalents | 413 | | | 449 | |
| | | |
| Total cash, cash equivalents and restricted cash and cash equivalents | $ | 1,817 | | | $ | 2,077 | |
The accompanying notes are an integral part of these consolidated financial statements.
60
CHENIERE ENERGY, INC. AND SUBSIDIARIES
NOTES TO CONSOLIDATED FINANCIAL STATEMENTS
NOTE 1—ORGANIZATION AND NATURE OF OPERATIONS
We operate two natural gas liquefaction and export facilities at Sabine Pass and Corpus Christi (respectively, the “Sabine Pass LNG Terminal” and “Corpus Christi LNG Terminal”).
CQP owns the Sabine Pass LNG Terminal located in Cameron Parish, Louisiana, which has natural gas liquefaction facilities consisting of six operational natural gas liquefaction Trains, with Train 6 achieving substantial completion on February 4, 2022, for a total production capacity of approximately 30 mtpa of LNG (the “SPL Project”). The Sabine Pass LNG Terminal also has operational regasification facilities that include five LNG storage tanks, vaporizers and two marine berths, with an additional marine berth that is under construction. CQP also owns a 94-mile pipeline that interconnects the Sabine Pass LNG Terminal with a number of large interstate pipelines (the “Creole Trail Pipeline”) through its subsidiary, CTPL. As of December 31, 2021, we owned 100% of the general partner interest and 48.6% of the limited partner interest in CQP.
The Corpus Christi LNG Terminal is located near Corpus Christi, Texas. We currently operate three Trains, for a total production capacity of approximately 15 mtpa of LNG. We also own a 21.5-mile natural gas supply pipeline that interconnects the Corpus Christi LNG Terminal with several interstate and intrastate natural gas pipelines (the “Corpus Christi Pipeline” and together with the Trains, the “CCL Project”) through our subsidiary CCP, as part of the CCH Group. The CCL Project also contains three LNG storage tanks and two marine berths.
Additionally, separate from the CCH Group, we are developing an expansion of the Corpus Christi LNG Terminal adjacent to the CCL Project (“Corpus Christi Stage 3”) through our subsidiary CCL Stage III, for up to seven midscale Trains with an expected total production capacity of over 10 mtpa of LNG. We received approval from FERC in November 2019 to site, construct and operate the expansion project.
We remain focused on operational excellence and customer satisfaction. Increasing demand for LNG has allowed us to expand our liquefaction infrastructure in a financially disciplined manner. We have increased available liquefaction capacity at the SPL Project and the CCL Project (collectively, the “Liquefaction Projects”) as a result of debottlenecking and other optimization projects. We hold significant land positions at both the Sabine Pass LNG Terminal and the Corpus Christi LNG Terminal which provide opportunity for further liquefaction capacity expansion. The development of these sites or other projects, including infrastructure projects in support of natural gas supply and LNG demand, will require, among other things, acceptable commercial and financing arrangements before we make a final investment decision (“FID”).
NOTE 2—SUMMARY OF SIGNIFICANT ACCOUNTING POLICIES
Basis of Presentation
Our Consolidated Financial Statements have been prepared in accordance with GAAP. The Consolidated Financial Statements include the accounts of Cheniere, its subsidiaries and affiliates in which we hold a controlling interest, reflecting ownership of a majority of the voting interest, as of the financial statement date. Additionally, we consolidate a VIE under certain criteria discussed further below. All intercompany accounts and transactions have been eliminated in consolidation. When necessary, reclassifications that are not material to our Consolidated Financial Statements are made to prior period financial information to conform to the current year presentation.
VIEs
We make a determination at the inception of each arrangement whether an entity in which we have made an investment or in which we have other variable interests is considered a VIE. Generally, an entity is a VIE if either (1) the entity does not have sufficient equity at risk to finance its activities without additional subordinated financial support from other parties, (2) the entity’s investors lack any characteristics of a controlling financial interest or (3) which was established with non-substantive voting.
We consolidate VIEs when we are deemed to be the primary beneficiary. The primary beneficiary of a VIE is generally the party that both: (1) has the power to make decisions that most significantly affect the economic performance of the VIE and (2) has the obligation to absorb losses or the right to receive benefits that in either case could potentially be significant to the
CHENIERE ENERGY, INC. AND SUBSIDIARIES
NOTES TO CONSOLIDATED FINANCIAL STATEMENTS—CONTINUED
VIE. If we are not deemed to be the primary beneficiary of a VIE, we account for the investment or other variable interests in a VIE in accordance with applicable GAAP.
Non-controlling Interests
When we consolidate an entity, we include 100% of the assets, liabilities, revenues and expenses of the subsidiary in our Consolidated Financial Statements. For those entities that we consolidate in which our ownership is less than 100%, we record a non-controlling interest as a component of equity on our Consolidated Balance Sheets, which represents the third party ownership in the net assets of the respective consolidated subsidiary. Additionally, the portion of the net income or loss attributable to the non-controlling interest is reported as net income (loss) attributable to non-controlling interest on our Consolidated Statements of Operations. Changes in our ownership interests in an entity that do not result in deconsolidation are generally recognized within equity. See Note 9—Non-controlling Interest and Variable Interest Entities for additional details about our non-controlling interest.
Equity Method Investments
Investments in non-controlled entities, which Cheniere has the ability to exercise significant influence over operating and financial policies are accounted for using the equity method of accounting, with our share of earnings or losses reported in other income (expense) on our Consolidated Statements of Operations. In applying the equity method of accounting, the investments are initially recognized at cost, and subsequently adjusted for our proportionate share of earnings, losses and distributions. Investments accounted for using the equity method of accounting are reported as a component of other noncurrent assets. See Note 8—Other Non-Current Assets, Net for additional details about our equity method investments.
Use of Estimates
The preparation of Consolidated Financial Statements in conformity with GAAP requires management to make certain estimates and assumptions that affect the amounts reported in the Consolidated Financial Statements and the accompanying notes. Management evaluates its estimates and related assumptions regularly, including those related to fair value measurements of derivatives and other instruments, useful lives of property, plant and equipment, certain valuations including leases and asset retirement obligations (“AROs”) and recoverability of deferred tax assets, each as further discussed under the respective sections within this note. Changes in facts and circumstances or additional information may result in revised estimates, and actual results may differ from these estimates.
Fair Value Measurements
Fair value is the price that would be received to sell an asset or paid to transfer a liability in an orderly transaction between market participants. Hierarchy Levels 1, 2 and 3 are terms for the priority of inputs to valuation approaches used to measure fair value. Hierarchy Level 1 inputs are quoted prices in active markets for identical assets or liabilities. Hierarchy Level 2 inputs are inputs that are directly or indirectly observable for the asset or liability, other than quoted prices included within Level 1. Hierarchy Level 3 inputs are inputs that are not observable in the market.
In determining fair value, we use observable market data when available, or models that incorporate observable market data. In addition to market information, we incorporate transaction-specific details that, in management’s judgment, market participants would take into account in measuring fair value. We maximize the use of observable inputs and minimize our use of unobservable inputs in arriving at fair value estimates.
The carrying amount of cash and cash equivalents, restricted cash and cash equivalents, accounts receivable and accounts payable reported on the Consolidated Balance Sheets approximates fair value. The fair value of debt is the estimated amount we would have to pay to repurchase our debt in the open market, including any premium or discount attributable to the difference between the stated interest rate and market interest rate at each balance sheet date. Debt fair values, as disclosed in Note 11—Debt, are based on quoted market prices for identical instruments, if available, or based on valuations of similar debt instruments using observable or unobservable inputs.
CHENIERE ENERGY, INC. AND SUBSIDIARIES
NOTES TO CONSOLIDATED FINANCIAL STATEMENTS—CONTINUED
Revenue Recognition
We recognize revenues when we transfer control of promised goods or services to our customers in an amount that reflects the consideration to which we expect to be entitled to in exchange for those goods or services. See Note 13—Revenues from Contracts with Customers for further discussion of our revenue streams and accounting policies related to revenue recognition.
Cash and Cash Equivalents
We consider all highly liquid investments with an original maturity of three months or less to be cash equivalents.
Restricted Cash and Cash Equivalents
Restricted cash and cash equivalents consist of funds that are contractually or legally restricted as to usage or withdrawal and have been presented separately from cash and cash equivalents on our Consolidated Balance Sheets.
Accounts and Other Receivables
Accounts and other receivables are reported net of any current expected credit losses. Current expected credit losses consider the risk of loss based on past events, current conditions and reasonable and supportable forecasts. A counterparty’s ability to pay is assessed through a credit review process that considers payment terms, the counterparty’s established credit rating or our assessment of the counterparty’s credit worthiness, contract terms, payment status, and other risks or available financial assurances. Adjustments to current expected credit losses are recorded in selling, general and administrative expense in our Consolidated Statements of Operations. As of both December 31, 2021 and 2020, we had current expected credit losses on our accounts and other receivables of $5 million.
Inventory
LNG and natural gas inventory are recorded at the lower of weighted average cost and net realizable value. Materials and other inventory are recorded at the lower of cost and net realizable value. Inventory is charged to expense when sold, or, for certain qualifying costs, capitalized to property, plant and equipment when issued, primarily using the weighted average method.
Property, Plant and Equipment
Property, plant and equipment are recorded at cost. Expenditures for construction and commissioning activities, major renewals and betterments that extend the useful life of an asset are capitalized, while expenditures for maintenance and repairs (including those for planned major maintenance projects) to maintain property, plant and equipment in operating condition are generally expensed as incurred.
Generally, we begin capitalizing the costs of our LNG terminals once the individual project meets the following criteria: (1) regulatory approval has been received, (2) financing for the project is available and (3) management has committed to commence construction. Prior to meeting these criteria, most of the costs associated with a project are expensed as incurred. These costs primarily include professional fees associated with preliminary front-end engineering and design work, costs of securing necessary regulatory approvals and other preliminary investigation and development activities related to our LNG terminals.
Generally, costs that are capitalized prior to a project meeting the criteria otherwise necessary for capitalization include: land acquisition costs, detailed engineering design work and certain permits that are capitalized as other non-current assets.
We realize offsets to LNG terminal costs for sales of commissioning cargoes that were earned or loaded prior to the start of commercial operations of the respective Train during the testing phase for its construction.
CHENIERE ENERGY, INC. AND SUBSIDIARIES
NOTES TO CONSOLIDATED FINANCIAL STATEMENTS—CONTINUED
by asset category. Upon retirement or other disposition of property, plant and equipment, the cost and related accumulated depreciation are removed from the account, and the resulting gains or losses are recorded in impairment expense and loss (gain) on disposal of assets.
Management tests property, plant and equipment for impairment whenever events or changes in circumstances have indicated that the carrying amount of property, plant and equipment might not be recoverable. Assets are grouped at the lowest level for which there are identifiable cash flows that are largely independent of the cash flows of other groups of assets for purposes of assessing recoverability. Recoverability generally is determined by comparing the carrying value of the asset to the expected undiscounted future cash flows of the asset. If the carrying value of the asset is not recoverable, the amount of impairment loss is measured as the excess, if any, of the carrying value of the asset over its estimated fair value.
We recorded $8 million of impairments related to property, plant and equipment during the year ended December 31, 2021. We did not record any impairments related to property, plant and equipment during the years ended December 31, 2020 and 2019.
Interest Capitalization
We capitalize interest costs during the construction period of our LNG terminals and related assets as construction-in-process. Upon commencement of operations, these costs are transferred out of construction-in-process into terminal and interconnecting pipeline facilities assets and are amortized over the estimated useful life of the asset.
Regulated Natural Gas Pipelines
The Creole Trail Pipeline and Corpus Christi Pipeline are subject to the jurisdiction of the FERC in accordance with the Natural Gas Act of 1938 and the Natural Gas Policy Act of 1978. The economic effects of regulation can result in a regulated company recording as assets those costs that have been or are expected to be approved for recovery from customers, or recording as liabilities those amounts that are expected to be required to be returned to customers, in a rate-setting process in a period different from the period in which the amounts would be recorded by an unregulated enterprise. Accordingly, we record assets and liabilities that result from the regulated rate-making process that may not be recorded under GAAP for non-regulated entities. We continually assess whether regulatory assets are probable of future recovery by considering factors such as applicable regulatory changes and recent rate orders applicable to other regulated entities. Based on this continual assessment, we believe the existing regulatory assets are probable of recovery. These regulatory assets and liabilities are primarily classified in our Consolidated Balance Sheets as other assets and other liabilities. We periodically evaluate their applicability under GAAP and consider factors such as regulatory changes and the effect of competition. If cost-based regulation ends or competition increases, we may have to write off the associated regulatory assets and liabilities.
Items that may influence our assessment are:
•inability to recover cost increases due to rate caps and rate case moratoriums;
•inability to recover capitalized costs, including an adequate return on those costs through the rate-making process and the FERC proceedings;
•excess capacity;
•increased competition and discounting in the markets we serve; and
•impacts of ongoing regulatory initiatives in the natural gas industry.
Natural gas pipeline costs include amounts capitalized as an Allowance for Funds Used During Construction (“AFUDC”). The rates used in the calculation of AFUDC are determined in accordance with guidelines established by the FERC. AFUDC represents the cost of debt and equity funds used to finance our natural gas pipeline additions during construction. AFUDC is capitalized as a part of the cost of our natural gas pipelines. Under regulatory rate practices, we generally are permitted to recover AFUDC, and a fair return thereon, through our rate base after our natural gas pipelines are placed in service.
CHENIERE ENERGY, INC. AND SUBSIDIARIES
NOTES TO CONSOLIDATED FINANCIAL STATEMENTS—CONTINUED
Derivative Instruments
We use derivative instruments to hedge our exposure to cash flow variability from interest rate, commodity price and foreign currency exchange (“FX”) rate risk. Derivative instruments are recorded at fair value and included in our Consolidated Balance Sheets as assets or liabilities depending on the derivative position and the expected timing of settlement, unless they satisfy criteria for, and we elect, the normal purchases and sales exception, under which we account for the instrument under the accrual method of accounting, whereby revenues and expenses are recognized only upon delivery, receipt or realization of the underlying transaction. When we have the contractual right and intent to net settle, derivative assets and liabilities are reported on a net basis.
Changes in the fair value of our derivative instruments are recorded in earnings, unless we elect to apply hedge accounting and meet specified criteria. We did not have any derivative instruments designated as cash flow or fair value hedges during the years ended December 31, 2021, 2020 and 2019. See Note 7—Derivative Instruments for additional details about our derivative instruments.
Leases
We determine if an arrangement is, or contains, a lease at inception of the arrangement. When we determine the arrangement is, or contains, a lease, we classify the lease as either an operating lease or a finance lease. Operating and finance leases are recognized on our Consolidated Balance Sheets by recording a lease liability representing the obligation to make future lease payments and a right-of-use asset representing the right to use the underlying asset for the lease term.
Operating and finance lease right-of-use assets and liabilities are generally recognized based on the present value of minimum lease payments over the lease term. In determining the present value of minimum lease payments, we use the implicit interest rate in the lease if readily determinable. In the absence of a readily determinable implicitly interest rate, we discount our expected future lease payments using our relevant subsidiary’s incremental borrowing rate. The incremental borrowing rate is an estimate of the interest rate that a given subsidiary would have to pay to borrow on a collateralized basis over a similar term to that of the lease term. Options to renew a lease are included in the lease term and recognized as part of the right-of-use asset and lease liability, only to the extent they are reasonably certain to be exercised.
We have elected practical expedients to (1) omit leases with an initial term of 12 months or less from recognition on our balance sheet and (2) to combine both the lease and non-lease components of an arrangement in calculating the right-of-use asset and lease liability for all classes of leased assets.
Lease expense for operating lease payments is recognized on a straight-line basis over the lease term. Lease expense for finance leases is recognized as the sum of the amortization of the right-of-use assets on a straight-line basis and the interest on lease liabilities using the effective interest method over the lease term.
Certain of our leases also contain variable payments, such as inflation, that are included in the right-of-use asset and lease liability only when the contract terms require the payment of a fixed amount that is unavoidable.
Concentration of Credit Risk
Financial instruments that potentially subject us to a concentration of credit risk consist principally of derivative instruments and accounts receivable related to our long-term SPAs and regasification contracts, each discussed further below. Additionally, we maintain cash balances at financial institutions, which may at times be in excess of federally insured levels. We have not incurred credit losses related to these cash balances to date.
The use of derivative instruments exposes us to counterparty credit risk, or the risk that a counterparty will be unable to meet its commitments. Certain of our commodity derivative transactions are executed through over-the-counter contracts which are subject to nominal credit risk as these transactions are settled on a daily margin basis with investment grade financial institutions. Collateral deposited for such contracts is recorded within other current assets. Our interest rate and FX derivative instruments are placed with investment grade financial institutions whom we believe are acceptable credit risks. We monitor
CHENIERE ENERGY, INC. AND SUBSIDIARIES
NOTES TO CONSOLIDATED FINANCIAL STATEMENTS—CONTINUED
counterparty creditworthiness on an ongoing basis; however, we cannot predict sudden changes in counterparties’ creditworthiness. In addition, even if such changes are not sudden, we may be limited in our ability to mitigate an increase in counterparty credit risk. Should one of these counterparties not perform, we may not realize the benefit of some of our derivative instruments.
We have contracted our anticipated production capacity under SPAs and under IPM agreements. Substantially all of our contracted capacity is from contracts with terms exceeding 10 years. Excluding contracts with terms less than 10 years, our SPAs and IPM agreements had approximately 17 years of weighted average remaining life as of December 31, 2021. We market and sell LNG produced by the Liquefaction Projects that is not required for other customers through our integrated marketing function. We are dependent on the respective customers’ creditworthiness and their willingness to perform under their respective agreements.
SPLNG has entered into two long-term TUAs with third parties for regasification capacity at the Sabine Pass LNG Terminal. SPLNG is dependent on the respective customers’ creditworthiness and their willingness to perform under their respective TUAs. SPLNG has mitigated this credit risk by securing TUAs for a significant portion of its regasification capacity with creditworthy third party customers with a minimum Standard & Poor’s rating of A.
Our arrangements with our customers incorporate certain provisions to mitigate our exposure to credit losses and include, under certain circumstances, customer collateral, netting of exposures through the use of industry standard commercial agreements and margin deposits with certain counterparties in the over-the-counter derivative market, with such margin deposits primarily facilitated by independent system operators and by clearing brokers. Payments on margin deposits, either by us or by the counterparty depending on the position, are required when the value of a derivative exceeds our pre-established credit limit with the counterparty. Margin deposits are returned to us (or to the counterparty) on or near the settlement date for non-exchange traded derivatives, and we exchange margin calls on a daily basis for exchange traded transactions.
Goodwill
Goodwill is the excess of acquisition cost of a business over the estimated fair value of net assets acquired. Goodwill is not amortized however we test goodwill for impairment at least annually as of October 1st, or more frequently if events or circumstances indicate goodwill is more likely than not impaired. When evaluating goodwill for impairment, we may either perform a qualitative assessment or a quantitative test. The qualitative assessment is an assessment of historical information and relevant events and circumstances to determine whether it is more likely than not that the fair value of a reporting unit is less than its carrying amount, including goodwill. If it is concluded that it is more-likely-than not that an impairment exists, a quantitative test is required which compares the estimated fair value of a reporting unit to its carrying value and measures any goodwill impairment as the amount by which the carrying amount of the reporting unit exceeds its fair value. We may elect not to perform the qualitative assessment and instead perform a quantitative impairment test.
We completed our annual assessment of goodwill impairment in the current year by performing a qualitative assessment; which indicated it was not more likely than not that there was an impairment and therefore no quantitative test was required. Significant judgments and assumptions are inherent in our estimate of future cash flows used to determine the estimate of the reporting unit’s fair value. Factors that could trigger a lower fair value estimate include significant negative industry or economic trends, cost increases, disruptions to our business, regulatory or political environment changes or other unanticipated events.
Debt
Our debt consists of current and long-term secured and unsecured debt securities, convertible debt securities and credit facilities with banks and other lenders. Debt issuances are placed directly by us or through securities dealers or underwriters and are held by institutional and retail investors.
Debt is recorded on our Consolidated Balance Sheets at par value adjusted for unamortized discount or premium and net of unamortized debt issuance costs related to term notes. Debt issuance costs consist primarily of arrangement fees, professional fees, legal fees and printing costs. If debt issuance costs are incurred in connection with a line of credit
CHENIERE ENERGY, INC. AND SUBSIDIARIES
NOTES TO CONSOLIDATED FINANCIAL STATEMENTS—CONTINUED
arrangement or on undrawn funds, the debt issuance costs are presented as an asset on our Consolidated Balance Sheets. Discounts, premiums and debt issuance costs directly related to the issuance of debt are amortized over the life of the debt and are recorded in interest expense, net of capitalized interest using the effective interest method. Gains and losses on the extinguishment or modification of debt are recorded in loss on modification or extinguishment of debt on our Consolidated Statements of Operations.
We classify debt on our Consolidated Balance Sheets based on contractual maturity, with the following exceptions:
•We classify term debt that is contractually due within one year as long-term debt if management has the intent and ability to refinance the current portion of such debt with future cash proceeds from an executed long-term debt agreement.
•We evaluate the classification of long-term debt extinguished after the balance sheet date but before the financial statements are issued based on facts and circumstances existing as of the balance sheet date.
Asset Retirement Obligations
We recognize AROs for legal obligations associated with the retirement of long-lived assets that result from the acquisition, construction, development and/or normal use of the asset and for conditional AROs in which the timing or method of settlement are conditional on a future event that may or may not be within our control. The fair value of a liability for an ARO is recognized in the period in which it is incurred, if a reasonable estimate of fair value can be made. The fair value of the liability is added to the carrying amount of the associated asset. This additional carrying amount is depreciated over the estimated useful life of the asset.
We have not recorded an ARO associated with the Sabine Pass LNG Terminal. Based on the real property lease agreements at the Sabine Pass LNG Terminal, at the expiration of the term of the leases we are required to surrender the LNG terminal in good working order and repair, with normal wear and tear and casualty expected. Our property lease agreements at the Sabine Pass LNG Terminal have terms of up to 90 years including renewal options. We have determined that the cost to surrender the Sabine Pass LNG Terminal in good order and repair, with normal wear and tear and casualty expected, is immaterial.
We have not recorded an ARO associated with the Creole Trail Pipeline or the Corpus Christi Pipeline. We believe that it is not feasible to predict when the natural gas transportation services provided by the Creole Trail Pipeline or the Corpus Christi Pipeline will no longer be utilized. In addition, our right-of-way agreements associated with the Creole Trail Pipeline and the Corpus Christi Pipeline have no stipulated termination dates. We intend to operate the Creole Trail Pipeline and the Corpus Christi Pipeline as long as supply and demand for natural gas exists in the United States and intend to maintain it regularly.
Share-based Compensation
We have awarded share-based compensation in the form of stock (immediately vested), restricted stock shares, restricted stock units, performance stock units and phantom units. The awards and our related accounting policies are more fully described in Note 16—Share-based Compensation.
Income Taxes
Provisions for income taxes are based on taxes payable or refundable for the current year and deferred taxes on temporary differences between the tax basis of assets and liabilities and their reported amounts in our Consolidated Financial Statements. Deferred tax assets and liabilities are included in our Consolidated Financial Statements at currently enacted income tax rates applicable to the period in which the deferred tax assets and liabilities are expected to be realized or settled. As changes in tax laws or rates are enacted, deferred tax assets and liabilities are adjusted through the current period’s provision for income taxes.
A valuation allowance is recorded to reduce the carrying value of our deferred tax assets when it is more likely than not that a portion or all of the deferred tax assets will expire before realization of the benefit or future deductibility is not probable.
CHENIERE ENERGY, INC. AND SUBSIDIARIES
NOTES TO CONSOLIDATED FINANCIAL STATEMENTS—CONTINUED
We recognize the financial statement effects of a tax position when it is more likely than not, based on the technical merits, that the position will be sustained upon examination.
Net Income (Loss) Per Share
Basic net income (loss) per share attributable to common stockholders (“EPS”) excludes dilution and is computed by dividing net income (loss) attributable to common stockholders by the weighted average number of common shares outstanding during the period. Diluted EPS reflects potential dilution and is computed by dividing net income (loss) attributable to common stockholders by the weighted average number of common shares outstanding during the period increased by the number of additional common shares that would have been outstanding if the potential common shares had been issued. The dilutive effect of unvested stock is calculated using the treasury-stock method and the dilutive effect of convertible securities is calculated using the treasury or if-converted method.
Business Segment
We have determined that we operate as a single operating and reportable segment. Substantially all of our long-lived assets are located in the United States. Our chief operating decision maker makes resource allocation decisions and assesses performance based on financial information presented on a consolidated basis in the delivery of an integrated source of LNG to our customers.
Recent Accounting Standards
In August 2020, the Financial Accounting Standards Board (“FASB”) issued Accounting Standards Update (“ASU”) 2020-06, Debt—Debt with Conversion and Other Options (Subtopic 470-20) and Derivatives and Hedging—Contracts in Entity’s Own Equity (Subtopic 815-40): Accounting for Convertible Instruments and Contracts in an Entity’s Own Equity. This guidance simplifies the accounting for convertible instruments primarily by eliminating the existing cash conversion and beneficial conversion models within Subtopic 470-20, which will result in fewer embedded conversion options being accounted for separately from the debt host. The guidance also amends and simplifies the calculation of earnings per share relating to convertible instruments. This guidance is effective for annual periods beginning after December 15, 2021, including interim periods within that reporting period, with earlier adoption permitted for fiscal years beginning after December 15, 2020, including interim periods within that reporting period, using either a full or modified retrospective approach. We plan to adopt this guidance on January 1, 2022 using the modified retrospective approach. Preliminarily, we anticipate the adoption of ASU 2020-06 will primarily result in the reclassification of the previously bifurcated equity component associated with the 4.25% Convertible Senior Notes due 2045 (the “2045 Cheniere Convertible Senior Notes”) to debt as a result of the elimination of the cash conversion model. We currently estimate that the reclassification of the $194 million equity component will result in an approximate $190 million increase in the carrying value of our 2045 Cheniere Convertible Senior Notes, with the difference primarily impacting retained earnings as of January 1, 2022. In December 2021, we issued a notice of redemption for all $625 million aggregate principal amount outstanding of 2045 Cheniere Convertible Senior Notes, which were redeemed on January 5, 2022. We continue to evaluate the impact of the provisions of this guidance on our Consolidated Financial Statements and related disclosures. See Note 11—Debt for further discussion on the 2045 Cheniere Convertible Senior Notes.
In March 2020, the FASB issued ASU 2020-04, Reference Rate Reform (Topic 848): Facilitation of the Effects of Reference Rate Reform on Financial Reporting. This guidance primarily provides temporary optional expedients which simplify the accounting for contract modifications to existing contracts expected to arise from the market transition from LIBOR to alternative reference rates. The transition period under this standard is effective March 12, 2020 and will apply through December 31, 2022.
We have various credit facilities and interest rate swaps indexed to LIBOR, as further described in Note 7—Derivative Instruments and Note 11—Debt. To date, we have amended certain of our credit facilities to incorporate a fallback replacement rate indexed to SOFR as a result of the expected LIBOR transition. We elected to apply the optional expedients as applicable to certain modified terms, however the impact of applying the optional expedients has not been material thus far. We will continue to elect to apply the optional expedients to qualifying contract modifications in the future.
CHENIERE ENERGY, INC. AND SUBSIDIARIES
NOTES TO CONSOLIDATED FINANCIAL STATEMENTS—CONTINUED
NOTE 3—RESTRICTED CASH AND CASH EQUIVALENTS
Restricted cash and cash equivalents consists of funds that are contractually or legally restricted as to usage or withdrawal and have been presented separately from cash and cash equivalents on our Consolidated Balance Sheets. As of December 31, 2021 and 2020, restricted cash and cash equivalents consisted of the following (in millions):
| | | | | | | | | | | | | | |
| | December 31, |
| | | | |
| | 2021 | | 2020 |
| Restricted cash and cash equivalents | | | | |
| SPL Project | | $ | 98 | | | $ | 97 | |
| | | | |
| CCL Project | | 44 | | | 70 | |
| Cash held by our subsidiaries that is restricted to Cheniere | | 271 | | | 282 | |
| Total restricted cash and cash equivalents | | $ | 413 | | | $ | 449 | |
| | | | |
| | | | |
| | | | |
| | | | |
| | | | |
| | | | |
Pursuant to the accounts agreements entered into with the collateral trustees for the benefit of SPL’s debt holders and CCH’s debt holders, SPL and CCH are required to deposit all cash received into reserve accounts controlled by the collateral trustees. The usage or withdrawal of such cash is restricted to the payment of liabilities related to the Liquefaction Projects and other restricted payments. The majority of the cash held by our subsidiaries that is restricted to Cheniere relates to advance funding for operation and construction needs of the Liquefaction Projects.
NOTE 4—ACCOUNTS AND OTHER RECEIVABLES, NET OF CURRENT EXPECTED CREDIT LOSSES
As of December 31, 2021 and 2020, accounts and other receivables, net of current expected credit losses consisted of the following (in millions):
| | | | | | | | | | | | | | |
| | December 31, |
| | | | |
| | 2021 | | 2020 |
| Trade receivables | | | | |
| SPL and CCL | | $ | 802 | | | $ | 482 | |
| | | | |
| Cheniere Marketing | | 640 | | | 113 | |
| Other accounts receivable | | 64 | | | 52 | |
| Total accounts and other receivables, net of current expected credit losses | | $ | 1,506 | | | $ | 647 | |
NOTE 5—INVENTORY
As of December 31, 2021 and 2020, inventory consisted of the following (in millions):
| | | | | | | | | | | | | | |
| | December 31, |
| | | | |
| | 2021 | | 2020 |
| Materials | | $ | 174 | | | $ | 150 | |
| LNG in-transit | | 312 | | | 88 | |
| LNG | | 153 | | | 27 | |
| Natural gas | | 64 | | | 26 | |
| Other | | 3 | | | 1 | |
| Total inventory | | $ | 706 | | | $ | 292 | |
CHENIERE ENERGY, INC. AND SUBSIDIARIES
NOTES TO CONSOLIDATED FINANCIAL STATEMENTS—CONTINUED
NOTE 6—PROPERTY, PLANT AND EQUIPMENT, NET OF ACCUMULATED DEPRECIATION
As of December 31, 2021 and 2020, property, plant and equipment, net of accumulated depreciation consisted of the following (in millions):
| | | | | | | | | | | | | | |
| | December 31, |
| | | | |
| | 2021 | | 2020 |
| LNG terminal | | | | |
| LNG terminal and interconnecting pipeline facilities | | $ | 30,660 | | | $ | 27,475 | |
| LNG site and related costs | | 441 | | | 324 | |
| LNG terminal construction-in-process | | 2,995 | | | 5,378 | |
| Accumulated depreciation | | (3,912) | | | (2,935) | |
| Total LNG terminal, net of accumulated depreciation | | 30,184 | | | 30,242 | |
| Fixed assets and other | | | | |
| Computer and office equipment | | 25 | | | 25 | |
| Furniture and fixtures | | 20 | | | 19 | |
| Computer software | | 120 | | | 117 | |
| Leasehold improvements | | 45 | | | 45 | |
| Land | | 1 | | | 59 | |
| Other | | 19 | | | 25 | |
| Accumulated depreciation | | (176) | | | (164) | |
| Total fixed assets and other, net of accumulated depreciation | | 54 | | | 126 | |
| Assets under finance lease | | | | |
| Tug vessels | | 60 | | | 60 | |
| Accumulated depreciation | | (10) | | | (7) | |
| Total assets under finance lease, net of accumulated depreciation | | 50 | | | 53 | |
| Property, plant and equipment, net of accumulated depreciation | | $ | 30,288 | | | $ | 30,421 | |
The following table shows depreciation expense and offsets to LNG terminal costs during the years ended December 31, 2021, 2020 and 2019 (in millions):
| | | | | | | | | | | | | | | | | | | | | | | | |
| | | | Year Ended December 31, |
| | | | | | 2021 | | 2020 | | 2019 |
| Depreciation expense | | | | | | $ | 1,006 | | | $ | 926 | | | $ | 788 | |
| Offsets to LNG terminal costs (1) | | | | | | 319 | | | 19 | | | 301 | |
(1)We recognize offsets to LNG terminal costs related to the sale of commissioning cargoes because these amounts were earned or loaded prior to the start of commercial operations of the respective Trains of the Liquefaction Projects during the testing phase for its construction.
LNG Terminal Costs
Our LNG terminals are depreciated using the straight-line depreciation method applied to groups of LNG terminal assets with varying useful lives. The identifiable components of our LNG terminals have depreciable lives between 6 and 50 years, as follows:
| | | | | | | | |
| Components | | Useful life (years) |
| LNG storage tanks | | 50 |
| Natural gas pipeline facilities | | 40 |
| Marine berth, electrical, facility and roads | | 35 |
| Water pipelines | | 30 |
| Regasification processing equipment | | 30 |
| Sendout pumps | | 20 |
| Liquefaction processing equipment | | 6-50 |
| Other | | 10-30 |
CHENIERE ENERGY, INC. AND SUBSIDIARIES
NOTES TO CONSOLIDATED FINANCIAL STATEMENTS—CONTINUED
Fixed Assets and Other
Our fixed assets and other are recorded at cost and are depreciated on a straight-line method based on estimated lives of the individual assets or groups of assets.
NOTE 7—DERIVATIVE INSTRUMENTS
We have entered into the following derivative instruments that are reported at fair value:
•interest rate swaps (“CCH Interest Rate Derivatives”) to hedge the exposure to volatility in a portion of the floating-rate interest payments on CCH’s amended and restated term loan credit facility (the “CCH Credit Facility”) and previously, to hedge against changes in interest rates that could impact anticipated future issuances of debt by CCH (“CCH Interest Rate Forward Start Derivatives” and, collectively with the CCH Interest Rate Derivatives, the “Interest Rate Derivatives”);
•commodity derivatives consisting of natural gas supply contracts for the commissioning and operation of the Liquefaction Projects and potential future development of Corpus Christi Stage 3 (“Physical Liquefaction Supply Derivatives”) and associated economic hedges (“Financial Liquefaction Supply Derivatives,” and collectively with the Physical Liquefaction Supply Derivatives, the “Liquefaction Supply Derivatives”);
•physical derivatives consisting of liquified natural gas contracts in which we have contractual net settlement (“Physical LNG Trading Derivatives”) and financial derivatives to hedge the exposure to the commodity markets in which we have contractual arrangements to purchase or sell physical LNG (collectively, “LNG Trading Derivatives”); and
•foreign currency exchange (“FX”) contracts to hedge exposure to currency risk associated with cash flows denominated in currencies other than United States dollar (“FX Derivatives”), associated with both LNG Trading Derivatives and operations in countries outside of the United States.
We recognize our derivative instruments as either assets or liabilities and measure those instruments at fair value. None of our derivative instruments are designated as cash flow or fair value hedging instruments, and changes in fair value are recorded within our Consolidated Statements of Operations to the extent not utilized for the commissioning process, in which case it is capitalized.
The following table shows the fair value of our derivative instruments that are required to be measured at fair value on a recurring basis as of December 31, 2021 and 2020 (in millions):
| | | | | | | | | | | | | | | | | | | | | | | | | | | | | | | | | | | | | | | | | | | | | | | |
| Fair Value Measurements as of |
| December 31, 2021 | | December 31, 2020 |
| Quoted Prices in Active Markets
(Level 1) | | Significant Other Observable Inputs
(Level 2) | | Significant Unobservable Inputs
(Level 3) | | Total | | Quoted Prices in Active Markets
(Level 1) | | Significant Other Observable Inputs
(Level 2) | | Significant Unobservable Inputs
(Level 3) | | Total |
| CCH Interest Rate Derivatives liability | $ | — | | | $ | (40) | | | $ | — | | | $ | (40) | | | $ | — | | | $ | (140) | | | $ | — | | | $ | (140) | |
| | | | | | | | | | | | | | | |
| Liquefaction Supply Derivatives asset (liability) | 7 | | | (9) | | | (4,036) | | | (4,038) | | | 5 | | | (6) | | | 241 | | | 240 | |
| LNG Trading Derivatives liability | (22) | | | (378) | | | — | | | (400) | | | (3) | | | (131) | | | — | | | (134) | |
| FX Derivatives asset (liability) | — | | | 12 | | | — | | | 12 | | | — | | | (22) | | | — | | | (22) | |
| | | | | | | | | | | | | | | |
We value our Interest Rate Derivatives using an income-based approach utilizing observable inputs to the valuation model including interest rate curves, risk adjusted discount rates, credit spreads and other relevant data. We value our LNG Trading Derivatives and our Liquefaction Supply Derivatives using a market or option-based approach incorporating present value techniques, as needed, using observable commodity price curves, when available, and other relevant data. We value our FX Derivatives with a market approach using observable FX rates and other relevant data.
The fair value of our Physical Liquefaction Supply Derivatives and LNG Trading Derivatives are predominantly driven by observable and unobservable market commodity prices and, as applicable to our natural gas supply contracts, our assessment
CHENIERE ENERGY, INC. AND SUBSIDIARIES
NOTES TO CONSOLIDATED FINANCIAL STATEMENTS—CONTINUED
of the associated events deriving fair value, including, but not limited to, evaluation of whether the respective market exists from the perspective of market participants as infrastructure is developed.
We include our Physical LNG Trading Derivatives and a portion of our Physical Liquefaction Supply Derivatives as Level 3 within the valuation hierarchy as the fair value is developed through the use of internal models which incorporate significant unobservable inputs. In instances where observable data is unavailable, consideration is given to the assumptions that market participants would use in valuing the asset or liability. This includes assumptions about market risks, such as future prices of energy units for unobservable periods, liquidity, volatility and contract duration.
The Level 3 fair value measurements of our Physical LNG Trading Derivatives and the natural gas positions within our Physical Liquefaction Supply Derivatives could be materially impacted by a significant change in certain natural gas and international LNG prices. The following table includes quantitative information for the unobservable inputs for our Level 3 Physical Liquefaction Supply Derivatives as of December 31, 2021:
| | | | | | | | | | | | | | | | | | | | | | | | | | |
| | Net Fair Value Liability
(in millions) | | Valuation Approach | | Significant Unobservable Input | | Range of Significant Unobservable Inputs / Weighted Average (1) |
| Physical Liquefaction Supply Derivatives | | $(4,036) | | Market approach incorporating present value techniques | | Henry Hub basis spread | | $(1.368) - $0.628 / $(0.016) |
| | | | Option pricing model | | International LNG pricing spread, relative to Henry Hub (2) | | 185% - 662% / 248% |
| | | | | | | | |
(1)Unobservable inputs were weighted by the relative fair value of the instruments.
(2)Spread contemplates U.S. dollar-denominated pricing.
Increases or decreases in basis or pricing spreads, in isolation, would decrease or increase, respectively, the fair value of our Physical LNG Trading Derivatives and our Physical Liquefaction Supply Derivatives.
The following table shows the changes in the fair value of our Level 3 Physical LNG Trading Derivatives and Physical Liquefaction Supply Derivatives during the years ended December 31, 2021, 2020 and 2019 (in millions):
| | | | | | | | | | | | | | | | | | | | | | | | |
| | | | Year Ended December 31, |
| | | | | | 2021 | | 2020 | | 2019 |
| Balance, beginning of period | | | | | | $ | 241 | | | $ | 138 | | | $ | (29) | |
| Realized and mark-to-market gains (losses): | | | | | | | | | | |
| Included in cost of sales | | | | | | (4,305) | | | 156 | | | (77) | |
| | | | | | | | | | |
| Purchases and settlements: | | | | | | | | | | |
| Purchases | | | | | | (1) | | | 5 | | | 199 | |
| Settlements | | | | | | 29 | | | (65) | | | 44 | |
| Transfers into Level 3, net (1) | | | | | | — | | | 7 | | | 1 | |
| Balance, end of period | | | | | | $ | (4,036) | | | $ | 241 | | | $ | 138 | |
| Change in unrealized gain (loss) relating to instruments still held at end of period | | | | | | $ | (4,305) | | | $ | 156 | | | $ | (77) | |
(1)Transferred into Level 3 as a result of unobservable market, or out of Level 3 as a result of observable market for the underlying natural gas purchase agreements.
All counterparty derivative contracts provide for the unconditional right of set-off in the event of default. We have elected to report derivative assets and liabilities arising from our derivative contracts with the same counterparty on a net basis. The use of derivative instruments exposes us to counterparty credit risk, or the risk that a counterparty will be unable to meet its commitments in instances when our derivative instruments are in an asset position. Additionally, counterparties are at risk that we will be unable to meet our commitments in instances where our derivative instruments are in a liability position. We incorporate both our own nonperformance risk and the respective counterparty’s nonperformance risk in fair value measurements. In adjusting the fair value of our derivative contracts for the effect of nonperformance risk, we have considered the impact of any applicable credit enhancements, such as collateral postings, set-off rights and guarantees.
CHENIERE ENERGY, INC. AND SUBSIDIARIES
NOTES TO CONSOLIDATED FINANCIAL STATEMENTS—CONTINUED
Interest Rate Derivatives
CCH has entered into interest rate swaps to protect against volatility of future cash flows and hedge a portion of the variable interest payments on the CCH Credit Facility. CCH previously also had interest rate swaps to hedge against changes in interest rates that could impact the anticipated future issuance of debt. In August 2020, we settled the outstanding CCH Interest Rate Forward Start Derivatives.
As of December 31, 2021, we had the following Interest Rate Derivatives outstanding:
| | | | | | | | | | | | | | | | | | | | | | | | | | | | | | | | |
| | Notional Amounts | | | | | | |
| | December 31, 2021 | | December 31, 2020 | | Latest Maturity Date | | Weighted Average Fixed Interest Rate Paid | | Variable Interest Rate Received |
| | | | | | | | | | |
| | | | | | | | | | |
| CCH Interest Rate Derivatives | | $4.5 billion | | $4.6 billion | | May 31, 2022 | | 2.30% | | One-month LIBOR |
| | | | | | | | | | |
| | | | | | | | | | |
The following table shows the effect and location of our Interest Rate Derivatives on our Consolidated Statements of Operations during the years ended December 31, 2021, 2020 and 2019 (in millions):
| | | | | | | | | | | | | | | | | | | | | | | | | | | | | | |
| | | | | | | Gain (Loss) Recognized in Consolidated Statements of Operations |
| | Consolidated Statements of Operations Location | | | | Year Ended December 31, |
| | | | | | | 2021 | | 2020 | | 2019 |
| CCH Interest Rate Derivatives | | Interest rate derivative loss, net | | | | | | $ | (1) | | | $ | (138) | | | $ | (101) | |
| CCH Interest Rate Forward Start Derivatives | | Interest rate derivative loss, net | | | | | | — | | | (95) | | | (33) | |
| | | | | | | | | | | | |
| | | | | | | | | | | | |
Commodity Derivatives
SPL, CCL and CCL Stage III have entered into physical natural gas supply contracts and associated economic hedges, including those associated with transactions under our IPM agreements, to purchase natural gas for the commissioning and operation of the Liquefaction Projects and potential future development of Corpus Christi Stage 3, respectively, which are primarily indexed to the natural gas market and international LNG indices. The remaining terms of the index-based physical natural gas supply contracts range up to approximately 15 years, some of which commence upon the satisfaction of certain events or states of affairs. The terms of the Financial Liquefaction Supply Derivatives range up to approximately three years.
Commencing in first quarter of 2021, we have entered into physical LNG transactions that provide for contractual net settlement. Such transactions are accounted for as LNG Trading Derivatives, and are designed to economically hedge exposure to the commodity markets in which we sell LNG. We have entered into, and may from time to time enter into, financial LNG Trading Derivatives in the form of swaps, forwards, options or futures. The terms of LNG Trading Derivatives range up to approximately one year.
The following table shows the notional amounts of our Liquefaction Supply Derivatives and LNG Trading Derivatives (collectively, “Commodity Derivatives”):
| | | | | | | | | | | | | | | | | | | | | | | |
| December 31, 2021 | | December 31, 2020 |
| Liquefaction Supply Derivatives | | LNG Trading Derivatives | | Liquefaction Supply Derivatives | | LNG Trading Derivatives |
| Notional amount, net (in TBtu) (1) | 11,238 | | | 33 | | | 10,483 | | | 20 | |
| | | | | | | |
(1)The balances as of December 31, 2020 include notional amounts for natural gas supply contracts that SPL and CCL have with related parties. These agreements are not considered related party as of December 31, 2021 as discussed in Note 14—Related Party Transactions.
CHENIERE ENERGY, INC. AND SUBSIDIARIES
NOTES TO CONSOLIDATED FINANCIAL STATEMENTS—CONTINUED
The following table shows the effect and location of our Commodity Derivatives recorded on our Consolidated Statements of Operations during the years ended December 31, 2021, 2020 and 2019 (in millions):
| | | | | | | | | | | | | | | | | | | | | | | | | | | |
| | | | | | | Gain (Loss) Recognized in Consolidated Statements of Operations |
| Consolidated Statements of Operations Location (1) | | | | Year Ended December 31, |
| | | | | | 2021 | | 2020 | | 2019 |
| | | | | | | | | | | |
| LNG Trading Derivatives | LNG revenues | | | | | | $ | (1,812) | | | $ | (26) | | | $ | 402 | |
| LNG Trading Derivatives | Cost of sales | | | | | | 91 | | | (42) | | | (89) | |
| Liquefaction Supply Derivatives (2) | LNG revenues | | | | | | 3 | | | (1) | | | 2 | |
| Liquefaction Supply Derivatives (2) | Cost of sales | | | | | | (4,303) | | | 94 | | | 194 | |
| | | | | | | | | | | |
| | | | | | | | | | | |
(1)Fair value fluctuations associated with commodity derivative activities are classified and presented consistently with the item economically hedged and the nature and intent of the derivative instrument.
(2)Does not include the realized value associated with derivative instruments that settle through physical delivery.
FX Derivatives
Cheniere Marketing has entered into FX Derivatives to protect against the volatility in future cash flows attributable to changes in international currency exchange rates. The FX Derivatives economically hedge the foreign currency exposure arising from cash flows expended for both physical and financial LNG transactions that are denominated in a currency other than the United States dollar. The terms of FX Derivatives range up to approximately one year.
The total notional amount of our FX Derivatives was $762 million and $786 million as of December 31, 2021 and 2020, respectively.
The following table shows the effect and location of our FX Derivatives recorded on our Consolidated Statements of Operations during the years ended December 31, 2021, 2020 and 2019 (in millions):
| | | | | | | | | | | | | | | | | | | | | | | | | | | |
| | | | | | Gain (Loss) Recognized in Consolidated Statements of Operations |
| Consolidated Statements of Operations Location | | | | Year Ended December 31, |
| | | | | | 2021 | | 2020 | | 2019 |
| FX Derivatives | LNG revenues | | | | | | $ | 33 | | | $ | (3) | | | $ | 25 | |
| | | | | | | | | | | |
CHENIERE ENERGY, INC. AND SUBSIDIARIES
NOTES TO CONSOLIDATED FINANCIAL STATEMENTS—CONTINUED
Fair Value and Location of Derivative Assets and Liabilities on the Consolidated Balance Sheets
The following table shows the fair value and location of our derivative instruments on our Consolidated Balance Sheets (in millions):
| | | | | | | | | | | | | | | | | | | | | | | | | | | | | | | |
| December 31, 2021 |
| CCH Interest Rate Derivatives | | | | Liquefaction Supply Derivatives (1) | | LNG Trading Derivatives (2) | | FX Derivatives | | Total |
| Consolidated Balance Sheets Location | | | | | | | | | | | |
| Current derivative assets | $ | — | | | | | $ | 38 | | | $ | 2 | | | $ | 15 | | | $ | 55 | |
| Derivative assets | — | | | | | 69 | | | — | | | — | | | 69 | |
| Total derivative assets | — | | | | | 107 | | | 2 | | | 15 | | | 124 | |
| | | | | | | | | | | |
| Current derivative liabilities | (40) | | | | | (644) | | | (402) | | | (3) | | | (1,089) | |
| Derivative liabilities | — | | | | | (3,501) | | | — | | | — | | | (3,501) | |
| Total derivative liabilities | (40) | | | | | (4,145) | | | (402) | | | (3) | | | (4,590) | |
| | | | | | | | | | | |
| Derivative asset (liability), net | $ | (40) | | | | | $ | (4,038) | | | $ | (400) | | | $ | 12 | | | $ | (4,466) | |
| | | | | | | | | | | |
| December 31, 2020 |
| CCH Interest Rate Derivatives | | | | Liquefaction Supply Derivatives (1) | | LNG Trading Derivatives (2) | | FX Derivatives | | Total |
| Consolidated Balance Sheets Location | | | | | | | | | | | |
| Current derivative assets | $ | — | | | | | $ | 27 | | | $ | — | | | $ | 5 | | | $ | 32 | |
| Derivative assets | — | | | | | 376 | | | — | | | — | | | 376 | |
| Total derivative assets | — | | | | | 403 | | | — | | | 5 | | | 408 | |
| | | | | | | | | | | |
| Current derivative liabilities | (100) | | | | | (54) | | | (134) | | | (25) | | | (313) | |
| Derivative liabilities | (40) | | | | | (109) | | | — | | | (2) | | | (151) | |
| Total derivative liabilities | (140) | | | | | (163) | | | (134) | | | (27) | | | (464) | |
| | | | | | | | | | | |
| Derivative asset (liability), net | $ | (140) | | | | | $ | 240 | | | $ | (134) | | | $ | (22) | | | $ | (56) | |
(1)Does not include collateral posted with counterparties by us of $20 million and $9 million as of December 31, 2021 and 2020, respectively, which are included in margin deposits in our Consolidated Balance Sheets. Includes derivative assets for natural gas supply contracts that SPL and CCL had with related parties as of December 31, 2020. These agreements are not considered related party as of December 31, 2021 as discussed in Note 14—Related Party Transactions. (2)Does not include collateral posted with counterparties by us of $745 million and $16 million, as of December 31, 2021 and 2020, respectively, which are included in margin deposits in our Consolidated Balance Sheets.
CHENIERE ENERGY, INC. AND SUBSIDIARIES
NOTES TO CONSOLIDATED FINANCIAL STATEMENTS—CONTINUED
Consolidated Balance Sheets Presentation
Our derivative instruments are presented on a net basis on our Consolidated Balance Sheets as described above. The following table shows the fair value of our derivatives outstanding on a gross and net basis (in millions):
| | | | | | | | | | | | | | | | | | | | | | | | | | | | |
| | CCH Interest Rate Derivatives | | | | Liquefaction Supply Derivatives | | LNG Trading Derivatives | | FX Derivatives |
| | | | | |
| As of December 31, 2021 | | | | | | | | | | |
| Gross assets | | $ | — | | | | | $ | 155 | | | $ | 10 | | | $ | 48 | |
| Offsetting amounts | | — | | | | | (48) | | | (8) | | | (33) | |
| Net assets | | $ | — | | | | | $ | 107 | | | $ | 2 | | | $ | 15 | |
| | | | | | | | | | |
| Gross liabilities | | $ | (40) | | | | | $ | (4,382) | | | $ | (551) | | | $ | (10) | |
| Offsetting amounts | | — | | | | | 237 | | | 149 | | | 7 | |
| Net liabilities | | $ | (40) | | | | | $ | (4,145) | | | $ | (402) | | | $ | (3) | |
| | | | | | | | | | |
| As of December 31, 2020 | | | | | | | | | | |
| Gross assets | | $ | — | | | | | $ | 452 | | | $ | — | | | $ | 6 | |
| Offsetting amounts | | — | | | | | (49) | | | — | | | (1) | |
| Net assets | | $ | — | | | | | $ | 403 | | | $ | — | | | $ | 5 | |
| | | | | | | | | | |
| Gross liabilities | | $ | (140) | | | | | $ | (184) | | | $ | (163) | | | $ | (62) | |
| Offsetting amounts | | — | | | | | 21 | | | 29 | | | 35 | |
| Net liabilities | | $ | (140) | | | | | $ | (163) | | | $ | (134) | | | $ | (27) | |
| | | | | | | | | | |
| | | | | | | | | | |
| | | | | | | | | | |
| | | | | | | | | | |
| | | | | | | | | | |
| | | | | | | | | | |
| | | | | | | | | | |
| | | | | | | | | | |
| | | | | | | | | | |
| | | | | | | | | | |
| | | | | | | | | | |
| | | | | | | | | | |
| | | | | | | | | | |
| | | | | | | | | | |
| | | | | | | | | | |
| | | | | | | | | | |
| | | | | | | | | | |
| | | | | | | | | | |
| | | | | | | | | | |
| | | | | | | | | | |
| | | | | | | | | | |
| | | | | | | | | | |
| | | | | | | | | | |
| | | | | | | | | | |
NOTE 8—OTHER NON-CURRENT ASSETS, NET
As of December 31, 2021 and 2020, other non-current assets, net consisted of the following (in millions):
| | | | | | | | | | | | | | |
| | December 31, |
| | | | |
| | 2021 | | 2020 |
| Contract assets, net of current expected credit losses | | $ | 135 | | | $ | 80 | |
| Advances made to municipalities for water system enhancements | | 81 | | | 84 | |
| Equity method investments | | 56 | | | 81 | |
| Advances and other asset conveyances to third parties to support LNG terminals | | 80 | | | 60 | |
| Debt issuance costs and debt discount, net of accumulated amortization | | 34 | | | 42 | |
| Advances made under EPC and non-EPC contracts | | 5 | | | 9 | |
| Advance tax-related payments and receivables | | 17 | | | 20 | |
| Other | | 54 | | | 30 | |
| Total other non-current assets, net | | $ | 462 | | | $ | 406 | |
Equity Method Investments
As of December 31, 2021, our equity method investment consists of our interest in Midship Holdings, LLC (“Midship Holdings”), which manages the business and affairs of Midship Pipeline Company, LLC (“Midship Pipeline”). Midship Pipeline is currently operating an approximately 200-mile natural gas pipeline project (the “Midship Project”) that connects production in the Anadarko Basin to Gulf Coast markets. The Midship Project commenced operations in April 2020.
During the years ended December 31, 2021 and 2020, we recognized other-than-temporary impairment losses of $37 million and $129 million, respectively, related to our investment in Midship Holdings. Impairment during the years ended December 31, 2021 and 2020 was precipitated primarily due to declining market conditions in the energy industry and customer credit risk, resulting in a reduction in the fair value of our equity interests. During the year ended December 31, 2019, we recognized losses of $87 million related to our investments in certain equity method investees, including Midship Holdings. Impairments during the year ended December 31, 2019 were primarily the result of cost overruns and extended construction timelines for operating infrastructure of our investees’ projects, resulting in a reduction of the fair value of our equity interests.
CHENIERE ENERGY, INC. AND SUBSIDIARIES
NOTES TO CONSOLIDATED FINANCIAL STATEMENTS—CONTINUED
The fair values of our equity interests were measured using an income approach, which utilized level 3 fair value inputs such as projected earnings and discount rates, and/or market approach. Impairment losses associated with our equity method investments are presented in other expense, net.
Our investment in Midship Holdings, net of impairment losses, was $56 million and $80 million as of December 31, 2021 and 2020, respectively.
NOTE 9—NON-CONTROLLING INTEREST AND VARIABLE INTEREST ENTITY
We own a 48.6% limited partner interest in CQP in the form of 239.9 million common units, with the remaining non-controlling limited partner interest held by Blackstone Inc., Brookfield Asset Management Inc. and the public. In July 2020, the board of directors of CQP’s general partner confirmed and approved that, following the distribution with respect to the three months ended June 30, 2020, the financial tests required for conversion of CQP’s subordinated units, all of which were held by us, were met under the terms of CQP’s partnership agreement. Accordingly, effective August 17, 2020, the first business day following the payment of the distribution, all of CQP’s subordinated units were automatically converted into common units on a one-for-one basis and the subordination period was terminated. We also own 100% of the general partner interest and the incentive distribution rights in CQP. CQP is accounted for as a consolidated VIE.
CQP is a limited partnership formed by us in 2006 to own and operate the Sabine Pass LNG Terminal and related assets. Our subsidiary, Cheniere Partners GP, is the general partner of CQP. In 2012, CQP, Cheniere and Blackstone CQP Holdco LP (“Blackstone CQP Holdco”) entered into a unit purchase agreement whereby CQP sold 100.0 million Class B units to Blackstone CQP Holdco in a private placement. The board of directors of Cheniere Partners GP was modified to include three directors appointed by Blackstone CQP Holdco, four directors appointed by us and four independent directors mutually agreed upon by Blackstone CQP Holdco and us and appointed by us. In addition, we provided Blackstone CQP Holdco with a right to maintain one board seat on our Board of Directors (our “Board”). A quorum of Cheniere Partners GP directors consists of a majority of all directors, including at least two directors appointed by Blackstone CQP Holdco, two directors appointed by us and two independent directors. Blackstone CQP Holdco will no longer be entitled to appoint Cheniere Partners GP directors in the event that Blackstone CQP Holdco’s ownership in CQP is less than 20% of outstanding common units and subordinated units.
As a holder of common units of CQP, we are not obligated to fund losses of CQP. However, our capital account, which would be considered in allocating the net assets of CQP were it to be liquidated, continues to share in losses of CQP. We have determined that Cheniere Partners GP is a VIE and that we, as the holder of the equity at risk, do not have a controlling financial interest due to the rights held by Blackstone CQP Holdco. However, we continue to consolidate CQP as a result of Blackstone CQP Holdco’s right to maintain one board seat on our Board which creates a de facto agency relationship between Blackstone CQP Holdco and us. GAAP requires that when a de facto agency relationship exists, one of the members of the de facto agency relationship must consolidate the VIE based on certain criteria. As a result, we consolidate CQP in our Consolidated Financial Statements.
CHENIERE ENERGY, INC. AND SUBSIDIARIES
NOTES TO CONSOLIDATED FINANCIAL STATEMENTS—CONTINUED
The following table presents the summarized assets and liabilities (in millions) of CQP, our consolidated VIE, which are included in our Consolidated Balance Sheets as of December 31, 2021 and 2020. The assets in the table below may only be used to settle obligations of CQP. In addition, there is no recourse to us for the consolidated VIE’s liabilities. The assets and liabilities in the table below include third party assets and liabilities of CQP only and exclude intercompany balances that eliminate in consolidation.
| | | | | | | | | | | | | | |
| | December 31, |
| | | | |
| | 2021 | | 2020 |
| ASSETS | | | | |
| Current assets | | | | |
| Cash and cash equivalents | | $ | 876 | | | $ | 1,210 | |
| Restricted cash and cash equivalents | | 98 | | | 97 | |
| Accounts and other receivables, net of current expected credit losses | | 580 | | | 318 | |
| Other current assets | | 285 | | | 182 | |
| Total current assets | | 1,839 | | | 1,807 | |
| | | | |
| | | | |
| Property, plant and equipment, net of accumulated depreciation | | 16,830 | | | 16,723 | |
| Other non-current assets, net | | 316 | | | 287 | |
| | | | |
| Total assets | | $ | 18,985 | | | $ | 18,817 | |
| | | | |
| LIABILITIES | | | | |
| Current liabilities | | | | |
| | | | |
| Accrued liabilities | | $ | 1,077 | | | $ | 662 | |
| | | | |
| Other current liabilities | | 200 | | | 167 | |
| | | | |
| Total current liabilities | | 1,277 | | | 829 | |
| | | | |
| Long-term debt, net of premium, discount and debt issuance costs | | 17,177 | | | 17,580 | |
| | | | |
| Other non-current liabilities | | 100 | | | 126 | |
| Total liabilities | | $ | 18,554 | | | $ | 18,535 | |
| | | | |
| | | | |
| | | | |
| | | | |
| | | | |
NOTE 10—ACCRUED LIABILITIES
As of December 31, 2021 and 2020, accrued liabilities consisted of the following (in millions):
| | | | | | | | | | | | | | |
| | December 31, |
| | | | |
| | 2021 | | 2020 |
| Accrued natural gas purchases | | $ | 1,323 | | | $ | 576 | |
| Accrued derivative settlements | | 329 | | | — | |
| Interest costs and related debt fees | | 214 | | | 245 | |
| LNG terminals and related pipeline costs | | 144 | | | 147 | |
| Compensation and benefits | | 180 | | | 123 | |
| Accrued LNG inventory | | 34 | | | 4 | |
| | | | |
| Other accrued liabilities | | 75 | | | 80 | |
| Total accrued liabilities | | $ | 2,299 | | | $ | 1,175 | |
CHENIERE ENERGY, INC. AND SUBSIDIARIES
NOTES TO CONSOLIDATED FINANCIAL STATEMENTS—CONTINUED
NOTE 11—DEBT
As of December 31, 2021 and 2020, our debt consisted of the following (in millions):
| | | | | | | | | | | | | | |
| | December 31, |
| | | | |
| | 2021 | | 2020 |
| SPL: | | | | |
| Senior Secured Notes: | | | | |
6.25% due 2022 | | $ | — | | | $ | 1,000 | |
5.625% due 2023 | | 1,500 | | | 1,500 | |
5.75% due 2024 | | 2,000 | | | 2,000 | |
5.625% due 2025 | | 2,000 | | | 2,000 | |
5.875% due 2026 | | 1,500 | | | 1,500 | |
5.00% due 2027 | | 1,500 | | | 1,500 | |
4.200% due 2028 | | 1,350 | | | 1,350 | |
4.500% due 2030 | | 2,000 | | | 2,000 | |
4.27% weighted average rate due 2037 | | 1,282 | | | 800 | |
| Total SPL Senior Secured Notes | | 13,132 | | | 13,650 | |
$1.2 billion Working Capital Revolving Credit and Letter of Credit Reimbursement Agreement (the “2020 SPL Working Capital Facility”) | | — | | | — | |
| Total debt - SPL | | 13,132 | | | 13,650 | |
| | | | |
| CQP: | | | | |
| Senior Notes: | | | | |
5.250% due 2025 | | — | | | 1,500 | |
5.625% due 2026 | | — | | | 1,100 | |
4.500% due 2029 | | 1,500 | | | 1,500 | |
4.000% due 2031 | | 1,500 | | | — | |
3.25% due 2032 | | 1,200 | | | — | |
| Total CQP Senior Notes | | 4,200 | | | 4,100 | |
| CQP Credit Facilities executed in 2019 (“2019 CQP Credit Facilities”) | | — | | | — | |
| Total debt - CQP | | 4,200 | | | 4,100 | |
| | | | |
| CCH: | | | | |
| Senior Secured Notes: | | | | |
7.000% due 2024 | | 1,250 | | | 1,250 | |
5.875% due 2025 | | 1,500 | | | 1,500 | |
5.125% due 2027 | | 1,500 | | | 1,500 | |
3.700% due 2029 | | 1,500 | | | 1,500 | |
3.72% weighted average rate due 2039 | | 2,721 | | | 1,971 | |
| Total CCH Senior Secured Notes | | 8,471 | | | 7,721 | |
| CCH Credit Facility (1) | | 1,728 | | | 2,627 | |
$1.2 billion CCH Working Capital Facility (“CCH Working Capital Facility”) (2) | | 250 | | | 140 | |
| Total debt - CCH | | 10,449 | | | 10,488 | |
| | | | |
| Cheniere: | | | | |
4.625% Senior Secured Notes due 2028 (“Cheniere Senior Secured Notes”) | | 2,000 | | | 2,000 | |
4.875% Convertible Unsecured Notes due 2021 (“2021 Cheniere Convertible Unsecured Notes”) (1) | | — | | | 476 | |
2045 Cheniere Convertible Senior Notes (3) | | 625 | | | 625 | |
$1.25 billion Cheniere Revolving Credit Facility (“Cheniere Revolving Credit Facility”) | | — | | | — | |
| Cheniere’s term loan facility (“Cheniere Term Loan Facility”) | | — | | | 148 | |
| Total debt - Cheniere | | 2,625 | | | 3,249 | |
| | | | |
Cheniere Marketing: trade finance facilities and letter of credit facility (2) | | — | | | — | |
| Total debt | | 30,406 | | | 31,487 | |
| | | | |
| Current portion of long-term debt | | (117) | | | (232) | |
| Short-term debt | | (250) | | | (140) | |
| Unamortized premium, discount and debt issuance costs, net | | (590) | | | (644) | |
| Total long-term debt, net of premium, discount and debt issuance costs | | $ | 29,449 | | | $ | 30,471 | |
(1)A portion of the outstanding balance that is due within one year is classified as current portion of long-term debt.
(2)These debt instruments are classified as short-term debt.
CHENIERE ENERGY, INC. AND SUBSIDIARIES
NOTES TO CONSOLIDATED FINANCIAL STATEMENTS—CONTINUED
(3)The redemption of these notes was financed with borrowings under the Cheniere Revolving Credit Facility, which is a long-term debt instrument. Therefore, the 2045 Cheniere Convertible Senior Notes were classified as long-term debt as of December 31, 2021. See Convertible Notes section below for further discussion of the redemption.
Senior Notes
SPL Senior Secured Notes
The SPL Senior Secured Notes are senior secured obligations of SPL, ranking equally in right of payment with SPL’s other existing and future senior debt and secured by the same collateral and senior in right of payment to any of its future subordinated debt. Subject to permitted liens, the SPL Senior Secured Notes are secured on a pari passu first-priority basis by a security interest in all of the membership interests in SPL and substantially all of SPL’s assets. SPL may, at any time, redeem all or part of the SPL Senior Secured Notes at specified prices set forth in the respective indentures governing the SPL Senior Secured Notes, plus accrued and unpaid interest, if any, to the date of redemption. The series of SPL Senior Secured Notes due in 2037 are fully amortizing according to a fixed sculpted amortization schedule, as set forth in the respective indentures.
CQP Senior Notes
The CQP Senior Notes are jointly and severally guaranteed by each of CQP’s subsidiaries other than SPL and, subject to certain conditions governing its guarantee, Sabine Pass LP (each a “Guarantor” and collectively, the “CQP Guarantors”). The CQP Senior Notes are senior obligations of CQP, ranking equally in right of payment with CQP’s other existing and future unsubordinated debt and senior to any of its future subordinated debt. In the event that the aggregate amount of CQP’s secured indebtedness and the secured indebtedness of the CQP Guarantors (other than the CQP Senior Notes or any other series of notes issued under the CQP Base Indenture) outstanding at any one time exceeds the greater of (1) $1.5 billion and (2) 10% of net tangible assets, the CQP Senior Notes will be secured to the same extent as such obligations under the 2019 CQP Credit Facilities. The obligations under the 2019 CQP Credit Facilities are unconditionally guaranteed and secured by a first-priority lien (subject to permitted encumbrances) on substantially all the existing and future tangible and intangible assets and rights of CQP and the CQP Guarantors and equity interests in the CQP Guarantors (except, in each case, for certain excluded properties set forth in the 2019 CQP Credit Facilities). The liens securing the CQP Senior Notes, if applicable, will be shared equally and ratably (subject to permitted liens) with the holders of other senior secured obligations, which include the 2019 CQP Credit Facilities obligations and any future additional senior secured debt obligations. CQP may, at any time, redeem all or part of the CQP Senior Notes at specified prices set forth in the respective indentures governing the CQP Senior Notes, plus accrued and unpaid interest, if any, to the date of redemption.
CCH Senior Secured Notes
The CCH Senior Secured Notes are jointly and severally guaranteed by CCH’s subsidiaries, CCL, CCP and Corpus Christi Pipeline GP, LLC (each a “CCH Guarantor” and collectively, the “CCH Guarantors”). The CCH Senior Secured Notes are senior secured obligations of CCH, ranking senior in right of payment to any and all of CCH’s future indebtedness that is subordinated to the CCH Senior Secured Notes and equal in right of payment with CCH’s other existing and future indebtedness that is senior and secured by the same collateral securing the CCH Senior Secured Notes. The CCH Senior Secured Notes are secured by a first-priority security interest in substantially all of CCH’s and the CCH Guarantors’ assets. CCH may, at any time, redeem all or part of the CCH Senior Secured Notes at specified prices set forth in the respective indentures governing the CCH Senior Secured Notes, plus accrued and unpaid interest, if any, to the date of redemption.
Cheniere Senior Secured Notes
The Cheniere Senior Secured Notes are our general senior obligations and rank senior in right of payment to all of our future obligations that are, by their terms, expressly subordinated in right of payment to the Cheniere Senior Secured Notes and equally in right of payment with all of our other existing and future unsubordinated indebtedness. The Cheniere Senior Secured Notes became unsecured in June 2021 concurrent with the repayment of all outstanding obligations under the Cheniere Term Loan Facility and may, in certain instances become secured in the future in connection with the incurrence of additional secured indebtedness by us. When required, the Cheniere Senior Secured Notes will be secured on a first-priority basis by a lien on substantially all of our assets and equity interests in our direct subsidiaries (other than certain excluded subsidiaries), which liens rank pari passu with the liens securing the Cheniere Revolving Credit Facility. As of December 31, 2021, the Cheniere Senior Secured Notes are not guaranteed by any of our subsidiaries. In the future, the Cheniere Senior Secured Notes will be
CHENIERE ENERGY, INC. AND SUBSIDIARIES
NOTES TO CONSOLIDATED FINANCIAL STATEMENTS—CONTINUED
guaranteed by our subsidiaries who guarantee our other material indebtedness. We may, at any time, redeem all or part of the Cheniere Senior Secured Notes at specified prices set forth in the indenture governing the Cheniere Senior Secured Notes, plus accrued and unpaid interest, if any, to the date of redemption.
Below is a schedule of future principal payments that we are obligated to make on our outstanding debt at December 31, 2021 (in millions):
| | | | | | | | |
| Years Ending December 31, | | Principal Payments |
| 2022 (1) | | $ | 992 | |
| 2023 | | 1,567 | |
| 2024 | | 4,794 | |
| 2025 | | 3,537 | |
| 2026 | | 1,579 | |
| Thereafter | | 17,937 | |
| Total | | $ | 30,406 | |
(1)Includes $625 million aggregate principal amount outstanding of the 2045 Cheniere Convertible Senior Notes as we issued a notice of redemption on December 6, 2021 for all amounts outstanding. As discussed above, the balance is classified as long-term debt in our Consolidated Balance Sheets as the redemption was financed with long-term borrowings subsequent to the balance sheet date. See Convertible Notes section below for further discussion of the redemption.
Credit Facilities
Below is a summary of our committed credit facilities outstanding as of December 31, 2021 (in millions):
| | | | | | | | | | | | | | | | | | | | | | | | | | | | | | | | | | | | | | | | |
| | | | | | | | 2020 SPL Working Capital Facility (1) | | 2019 CQP Credit Facilities (2) | | CCH Credit Facility (3) | | CCH Working Capital Facility (4) | | Cheniere Revolving Credit Facility (5) | | |
| Original facility size | | | | | | | | $ | 1,200 | | | $ | 1,500 | | | $ | 8,404 | | | $ | 350 | | | $ | 750 | | | |
| Incremental commitments | | | | | | | | — | | | — | | | 1,566 | | | 850 | | | 500 | | | |
| Less: | | | | | | | | | | | | | | | | | | |
| Outstanding balance | | | | | | | | — | | | — | | | 1,729 | | | 250 | | | — | | | |
| Commitments prepaid or terminated | | | | | | | | — | | | 750 | | | 8,241 | | | — | | | — | | | |
| Letters of credit issued | | | | | | | | 395 | | | — | | | — | | | 361 | | | — | | | |
| Available commitment | | | | | | | | $ | 805 | | | $ | 750 | | | $ | — | | | $ | 589 | | | $ | 1,250 | | | |
| | | | | | | | | | | | | | | | | | |
| Priority ranking | | | | | | | | Senior secured | | Senior secured | | Senior secured | | Senior secured | | Senior secured | | |
| Interest rate on available balance | | | | | | | | LIBOR plus 1.125% - 1.750% or base rate plus 0.125% - 0.750% | | LIBOR plus 1.25% - 2.125% or base rate plus 0.25% - 1.125% | | LIBOR plus 1.75% or base rate plus 0.75% (6) | | LIBOR plus 1.25% - 1.75% or base rate plus 0.25% - 0.75% (6) | | LIBOR plus 1.250% - 2.375% or base rate plus 0.250% - 1.375% (6) | | |
| Weighted average interest rate of outstanding balance | | | | | | | | n/a | | n/a | | 1.85% | | 3.50% | | n/a | | |
| Commitment fees on undrawn balance | | | | | | | | 0.20% | | 0.49% | | n/a | | 0.50% | | 0.25% | | |
| Maturity date | | | | | | | | March 19, 2025 | | May 29, 2024 | | June 30, 2024 | | June 29, 2023 | | October 28, 2026 | | |
(1)The obligations of SPL under the 2020 SPL Working Capital Facility are secured by substantially all of the assets of SPL as well as a pledge of all of the membership interests in SPL and certain future subsidiaries of SPL on a pari passu basis by a first priority lien with the SPL Senior Secured Notes. The 2020 SPL Working Capital Facility contains customary conditions precedent for extensions
(2)See CQP Senior Notes section above for discussion of the rights and privileges of the 2019 CQP Credit Facilities.
(3)The obligations of CCH under the CCH Credit Facility are secured by a first priority lien on substantially all of the assets of CCH and its subsidiaries and by a pledge by Cheniere CCH Holdco I of its limited liability company interests in CCH.
CHENIERE ENERGY, INC. AND SUBSIDIARIES
NOTES TO CONSOLIDATED FINANCIAL STATEMENTS—CONTINUED
(4)The obligations of CCH under the CCH Working Capital Facility are secured by substantially all of the assets of CCH and the CCH Guarantors as well as all of the membership interests in CCH and each of the CCH Guarantors on a pari passu basis with the CCH Senior Secured Notes and the CCH Credit Facility.
(5)The Cheniere Revolving Credit Facility is secured by a first priority security interest (subject to permitted liens and other customary exceptions) in substantially all of our assets, including our interests in our direct subsidiaries (other than certain excluded subsidiaries). The Cheniere Revolving Credit Facility contains a financial covenant requiring us to maintain a non-consolidated leverage ratio not to exceed 5.50:1.00 as of the end of any fiscal quarter if (i) as of the last day of such fiscal quarter the aggregate principal amount of outstanding loans plus drawn and unreimbursed letters of credit is greater than 35% of the aggregate commitments under the Cheniere Revolving Credit Facility (a “Covenant Trigger Event”) or (ii) a Covenant Trigger Event had occurred and been continuing as of the last day of the immediately preceding fiscal quarter and as of the last day of such ending fiscal quarter such Covenant Trigger Event had not ceased for a period of at least thirty consecutive days.
(6)These facilities were amended in 2021 to establish a SOFR-indexed replacement rate for LIBOR.
Convertible Notes
As of December 31, 2021, we had $625 million aggregate principal amount of the 2045 Cheniere Convertible Senior Notes outstanding, of which $321 million was recorded as debt, net of discount and debt issuance costs of $304 million, and $194 million was recorded as equity. The effective interest rate as of December 31, 2021 was 9.4%, which was the rate to accrete the discounted carrying value of the notes to the face value over the remaining contractual amortization period. Subject to various limitations and conditions under the indenture, the notes were convertible by us or by the holders to 7.2265 shares of our common stock per $1,000 principal amount. Additionally, we had the right, at our option, to redeem all or any part of the 2045 Cheniere Convertible Senior Notes at a redemption price equal to the accreted amount of the notes to be redeemed, plus accrued and unpaid interest, if any, to such redemption date. On December 6, 2021, we issued a notice of redemption for all $625 million aggregate principal amount outstanding of the 2045 Cheniere Convertible Senior Notes. The notice of redemption allowed holders to elect to convert their notes at any time prior to a specified deadline on December 31, 2021, with settlement of such converted notes in cash, as elected by the Company, on January 5, 2022. The impact of holders electing conversion was immaterial to the financial statements. The 2045 Cheniere Convertible Senior Notes not converted were redeemed on January 5, 2022 with borrowings under the Cheniere Revolving Credit Facility.
Restrictive Debt Covenants
The indentures governing our senior notes and other agreements underlying our debt contain customary terms and events of default and certain covenants that, among other things, may limit us, our subsidiaries’ and its restricted subsidiaries’ ability to make certain investments or pay dividends or distributions. SPL, CQP and CCH are restricted from making distributions under agreements governing their respective indebtedness generally until, among other requirements, deposits are made into any required debt service reserve accounts and a historical debt service coverage ratio and projected debt service coverage ratio of at least 1.25:1.00 is satisfied. At December 31, 2021, our restricted net assets of consolidated subsidiaries were approximately $1.5 billion.
As of December 31, 2021, each of our issuers was in compliance with all covenants related to their respective debt agreements.
CHENIERE ENERGY, INC. AND SUBSIDIARIES
NOTES TO CONSOLIDATED FINANCIAL STATEMENTS—CONTINUED
Interest Expense
Total interest expense, net of capitalized interest, including interest expense related to our convertible notes, consisted of the following (in millions):
| | | | | | | | | | | | | | | | | | | | | | | | |
| | | | | Year Ended December 31, |
| | | | | | 2021 | | 2020 | | 2019 |
| Interest cost on convertible notes: | | | | | | | | | | |
| Interest per contractual rate | | | | | | $ | 36 | | | $ | 152 | | | $ | 256 | |
| Amortization of debt discount | | | | | | 10 | | | 45 | | | 40 | |
| Amortization of debt issuance costs | | | | | | — | | | 8 | | | 12 | |
| Total interest cost related to convertible notes | | | | | | 46 | | | 205 | | | 308 | |
| Interest cost on debt and finance leases excluding convertible notes | | | | | | 1,558 | | | 1,568 | | | 1,538 | |
| Total interest cost | | | | | | 1,604 | | | 1,773 | | | 1,846 | |
| Capitalized interest | | | | | | (166) | | | (248) | | | (414) | |
| Total interest expense, net of capitalized interest | | | | | | $ | 1,438 | | | $ | 1,525 | | | $ | 1,432 | |
Fair Value Disclosures
The following table shows the carrying amount and estimated fair value of our debt (in millions):
| | | | | | | | | | | | | | | | | | | | | | | | | | |
| | | December 31, 2021 | | December 31, 2020 |
| | | Carrying
Amount | | Estimated
Fair Value | | Carrying
Amount | | Estimated
Fair Value |
Senior notes — Level 2 (1) | | $ | 24,550 | | | $ | 26,725 | | | $ | 24,700 | | | $ | 27,897 | |
Senior notes — Level 3 (2) | | 3,253 | | | 3,693 | | | 2,771 | | | 3,423 | |
| Credit facilities — Level 3 (3) | | 1,978 | | | 1,978 | | | 2,915 | | | 2,915 | |
| 2021 Cheniere Convertible Unsecured Notes — Level 3 (2) | | — | | | — | | | 476 | | | 480 | |
| | | | | | | | |
| 2045 Cheniere Convertible Senior Notes — Level 1 (4) | | 625 | | | 526 | | | 625 | | | 496 | |
(1)The Level 2 estimated fair value was based on quotes obtained from broker-dealers or market makers of these senior notes and other similar instruments.
(2)The Level 3 estimated fair value was calculated based on inputs that are observable in the market or that could be derived from, or corroborated with, observable market data, including our stock price and interest rates based on debt issued by parties with comparable credit ratings to us and inputs that are not observable in the market.
(3)The Level 3 estimated fair value approximates the principal amount because the interest rates are variable and reflective of market rates and the debt may be repaid, in full or in part, at any time without penalty.
(4)The Level 1 estimated fair value was based on unadjusted quoted prices in active markets for identical liabilities that we had the ability to access at the measurement date.
CHENIERE ENERGY, INC. AND SUBSIDIARIES
NOTES TO CONSOLIDATED FINANCIAL STATEMENTS—CONTINUED
NOTE 12—LEASES
Our leased assets consist primarily of LNG vessel time charters (“vessel charters”) and additionally include tug vessels, office space and facilities and land sites. All of our leases are classified as operating leases except for our tug vessels supporting the Corpus Christi LNG Terminal, which are classified as finance leases.
The following table shows the classification and location of our right-of-use assets and lease liabilities on our Consolidated Balance Sheets (in millions):
| | | | | | | | | | | | | | | | | |
| | | December 31, |
| | | | | |
| Consolidated Balance Sheets Location | | 2021 | | 2020 |
| Right-of-use assets—Operating | Operating lease assets | | $ | 2,102 | | | $ | 759 | |
| Right-of-use assets—Financing | Property, plant and equipment, net of accumulated depreciation | | 50 | | | 53 | |
| Total right-of-use assets | | | $ | 2,152 | | | $ | 812 | |
| | | | | |
| Current operating lease liabilities | Current operating lease liabilities | | $ | 535 | | | $ | 161 | |
| Current finance lease liabilities | Other current liabilities | | 2 | | | 2 | |
| Non-current operating lease liabilities | Operating lease liabilities | | 1,541 | | | 597 | |
| Non-current finance lease liabilities | Finance lease liabilities | | 57 | | | 57 | |
| Total lease liabilities | | | $ | 2,135 | | | $ | 817 | |
The following table shows the classification and location of our lease costs on our Consolidated Statements of Operations (in millions):
| | | | | | | | | | | | | | | | | | | | | | | | | | | |
| Consolidated Statements of Operations Location | | | | Year Ended December 31, |
| | | | | | 2021 | | 2020 | | 2019 |
| Operating lease cost (a) | Operating costs and expenses (1) | | | | | | $ | 621 | | | $ | 432 | | | $ | 612 | |
| Finance lease cost: | | | | | | | | | | | |
| Amortization of right-of-use assets | Depreciation and amortization expense | | | | | | 3 | | | 2 | | | 3 | |
| Interest on lease liabilities | Interest expense, net of capitalized interest | | | | | | 9 | | | 7 | | | 10 | |
| | | | | | | | | | | |
| Total lease cost | | | | | | | $ | 633 | | | $ | 441 | | | $ | 625 | |
| | | | | | | | | | | |
| (a) Included in operating lease cost: | | | | | | | | | | | |
| Short-term lease costs | | | | | | | $ | 139 | | | $ | 93 | | | $ | 230 | |
| Variable lease costs | | | | | | | 21 | | | 16 | | | 7 | |
(1)Presented in cost of sales, operating and maintenance expense or selling, general and administrative expense consistent with the nature of the asset under lease.
Future annual minimum lease payments for operating and finance leases as of December 31, 2021 are as follows (in millions):
| | | | | | | | | | | |
| Years Ending December 31, | Operating Leases (1) | | Finance Leases |
| 2022 | $ | 600 | | | $ | 11 | |
| 2023 | 514 | | | 10 | |
| 2024 | 456 | | | 10 | |
| 2025 | 244 | | | 10 | |
| 2026 | 218 | | | 10 | |
| Thereafter | 294 | | | 117 | |
| Total lease payments | 2,326 | | | 168 | |
| Less: Interest | (250) | | | (109) | |
| Present value of lease liabilities | $ | 2,076 | | | $ | 59 | |
(1)Does not include approximately $1.2 billion of legally binding minimum lease payments primarily for vessel charters which were executed as of December 31, 2021 but will commence in future periods primarily in the next year and have fixed minimum lease terms of up to 10 years.
CHENIERE ENERGY, INC. AND SUBSIDIARIES
NOTES TO CONSOLIDATED FINANCIAL STATEMENTS—CONTINUED
The following table shows the weighted-average remaining lease term and the weighted-average discount rate for our operating leases and finance leases:
| | | | | | | | | | | | | | | | | | | | | | | |
| December 31, 2021 | | December 31, 2020 |
| Operating Leases | | Finance Leases | | Operating Leases | | Finance Leases |
| Weighted-average remaining lease term (in years) | 5.6 | | 16.7 | | 8.2 | | 17.7 |
| Weighted-average discount rate (1) | 3.6% | | 16.2% | | 5.4% | | 16.2% |
(1)The finance leases commenced prior to the adoption of the current leasing standard under GAAP. In accordance with previous accounting guidance, the implied rate is based on the fair value of the underlying assets.
The following table includes other quantitative information for our operating and finance leases (in millions):
| | | | | | | | | | | | | | | | | |
| Year Ended December 31, |
| 2021 | | 2020 | | 2019 |
| Cash paid for amounts included in the measurement of lease liabilities: | | | | | |
| Operating cash flows from operating leases | $ | 483 | | | $ | 309 | | | $ | 389 | |
| Operating cash flows from finance leases | 10 | | | 10 | | | 9 | |
| | | | | |
| Right-of-use assets obtained in exchange for operating lease liabilities | 1,736 | | | 615 | | | 235 | |
LNG Vessel Subcharters
From time to time, we sublease certain LNG vessels under charter to third parties while retaining our existing obligation to the original lessor. As of December 31, 2021 and 2020, we had $15 million and zero future minimum sublease payments to be received from LNG vessel subcharters. The following table shows the sublease income recognized in other revenues on our Consolidated Statements of Operations (in millions):
| | | | | | | | | | | | | | | | | | | | | | | | |
| | | | Year Ended December 31, |
| | | | | | 2021 | | 2020 | | 2019 |
| Fixed income | | | | | | $ | 72 | | | $ | 68 | | | $ | 122 | |
| Variable income | | | | | | 37 | | | 27 | | | 22 | |
| Total sublease income | | | | | | $ | 109 | | | $ | 95 | | | $ | 144 | |
NOTE 13—REVENUES FROM CONTRACTS WITH CUSTOMERS
The following table represents a disaggregation of revenue earned from contracts with customers during the years ended December 31, 2021, 2020 and 2019 (in millions):
| | | | | | | | | | | | | | | | | | | | | | | | |
| | | | Year Ended December 31, |
| | | | | | 2021 | | 2020 | | 2019 |
| LNG revenues (1) | | | | | | $ | 17,171 | | | $ | 8,954 | | | $ | 8,817 | |
| Regasification revenues | | | | | | 269 | | | 269 | | | 266 | |
| Other revenues | | | | | | 91 | | | 70 | | | 74 | |
| | | | | | | | | | |
| Total revenues from customers | | | | | | 17,531 | | | 9,293 | | | 9,157 | |
| Net derivative gain (loss) (2) | | | | | | (1,776) | | | (30) | | | 429 | |
| Other (3) | | | | | | 109 | | | 95 | | | 144 | |
| Total revenues | | | | | | $ | 15,864 | | | $ | 9,358 | | | $ | 9,730 | |
(1)LNG revenues include revenues for LNG cargoes in which our customers exercised their contractual right to not take delivery but remained obligated to pay fixed fees irrespective of such election. During the year ended December 31, 2020, we recognized $969 million in LNG revenues associated with LNG cargoes for which customers notified us that they would not take delivery, of which $38 million would have been recognized during the year ended December 31, 2021 had the cargoes been lifted pursuant to the delivery schedules with the customers. We did not have revenues associated with LNG cargoes for which customers notified us that they would not take delivery during the years ended December 31, 2021 and 2019. Revenue is generally recognized upon receipt of irrevocable notice that a customer will not take delivery because our customers have no contractual right to take delivery of such LNG cargo in future periods and our performance obligations with respect to such LNG cargo have been satisfied.
CHENIERE ENERGY, INC. AND SUBSIDIARIES
NOTES TO CONSOLIDATED FINANCIAL STATEMENTS—CONTINUED
(3)Includes revenues from LNG vessel subcharters. See Note 12—Leases for additional information about our subleases.
LNG Revenues
We have entered into numerous SPAs with third party customers for the sale of LNG on a free on board (“FOB”) (delivered to the customer at either the Sabine Pass or Corpus Christi LNG terminal) or delivered at terminal (“DAT”) (delivered to the customer at their LNG receiving terminal) basis. Our customers generally purchase LNG for a price consisting of a fixed fee per MMBtu of LNG (a portion of which is subject to annual adjustment for inflation) plus a variable fee per MMBtu of LNG generally equal to 115% of Henry Hub. The fixed fee component is the amount payable to us regardless of a cancellation or suspension of LNG cargo deliveries by the customers. The variable fee component is the amount generally payable to us only upon delivery of LNG plus all future adjustments to the fixed fee for inflation. The SPAs and contracted volumes to be made available under the SPAs are not tied to a specific Train; however, the term of each SPA generally commences upon the date of first commercial delivery of a specified Train.
We intend to primarily use LNG sourced from our Sabine Pass or Corpus Christi LNG terminals to provide contracted volumes to our customers. However, we supplement this LNG with volumes procured from third parties. LNG revenues recognized from LNG that was procured from third parties was $499 million, $414 million and $268 million for the years ended December 31, 2021, 2020 and 2019, respectively.
Revenues from the sale of LNG are recognized at a point in time when the LNG is delivered to the customer, either at the Sabine Pass or Corpus Christi LNG terminal or at the customer’s LNG receiving terminal, based on the terms of the contract, which is the point legal title, physical possession and the risks and rewards of ownership transfer to the customer. Each individual molecule of LNG is viewed as a separate performance obligation. The stated contract price (including both fixed and variable fees) per MMBtu in each LNG sales arrangement is representative of the stand-alone selling price for LNG at the time the contract was negotiated. We have concluded that the variable fees meet the exception for allocating variable consideration to specific parts of the contract. As such, the variable consideration for these contracts is allocated to each distinct molecule of LNG and recognized when that distinct molecule of LNG is delivered to the customer. Because of the use of the exception, variable consideration related to the sale of LNG is also not included in the transaction price.
When we sell LNG on a DAT basis, we consider all transportation costs, including vessel chartering, loading/unloading and canal fees, as fulfillment costs and not as separate services provided to the customer within the arrangement, regardless of whether or not such activities occur prior to or after the customer obtains control of the LNG. We expense fulfillment costs as incurred unless otherwise dictated by GAAP.
Fees received pursuant to SPAs are recognized as LNG revenues only after substantial completion of the respective Train. Prior to substantial completion, sales generated during the commissioning phase are offset against the cost of construction for the respective Train, as the production and removal of LNG from storage is necessary to test the facility and bring the asset to the condition necessary for its intended use.
Regasification Revenues
The Sabine Pass LNG Terminal has operational regasification capacity of approximately 4 Bcf/d. Approximately 2 Bcf/d of the regasification capacity at the Sabine Pass LNG Terminal has been reserved under two long-term TUAs with unaffiliated third party customers, under which they are required to pay fixed monthly fees regardless of their use of the LNG terminal. Each of the customers has reserved approximately 1 Bcf/d of regasification capacity. The customers are each obligated to make monthly capacity payments to SPLNG aggregating approximately $125 million annually for 20 years that commenced in 2009, which is representative of fixed consideration in the contract. A portion of this fee is adjusted annually for inflation which is considered variable consideration. The remaining capacity of the Sabine Pass LNG Terminal has been reserved by SPL, for which the associated revenues are eliminated in consolidation.
Because SPLNG is continuously available to provide regasification service on a daily basis with the same pattern of transfer, we have concluded that SPLNG provides a single performance obligation to its customers on a continuous basis over time. We have determined that an output method of recognition based on elapsed time best reflects the benefits of this service
CHENIERE ENERGY, INC. AND SUBSIDIARIES
NOTES TO CONSOLIDATED FINANCIAL STATEMENTS—CONTINUED
to the customer and accordingly, LNG regasification capacity reservation fees are recognized as regasification revenues on a straight-line basis over the term of the respective TUAs.
In 2012, SPL entered into a partial TUA assignment agreement with TotalEnergies Gas & Power North America, Inc. (“Total”), whereby upon substantial completion of Train 5 of the SPL Project, SPL gained access to substantially all of Total’s capacity and other services provided under Total’s TUA with SPLNG. This agreement provides SPL with additional berthing and storage capacity at the Sabine Pass LNG Terminal that may be used to provide increased flexibility in managing LNG cargo loading and unloading activity and permit SPL to more flexibly manage its LNG storage capacity. Notwithstanding any arrangements between Total and SPL, payments required to be made by Total to SPLNG will continue to be made by Total to SPLNG in accordance with its TUA and we continue to recognize the payments received from Total as revenue. During the years ended December 31, 2021, 2020 and 2019, SPL recorded $129 million, $129 million and $104 million, respectively, as operating and maintenance expense under this partial TUA assignment agreement.
Contract Assets and Liabilities
The following table shows our contract assets, net of current expected credit losses, which are classified as other current assets and other non-current assets, net on our Consolidated Balance Sheets (in millions):
| | | | | | | | | | | | | | |
| | December 31, |
| | | | |
| | 2021 | | 2020 |
| Contract assets, net of current expected credit losses | | $ | 140 | | | $ | 80 | |
Contract assets represent our right to consideration for transferring goods or services to the customer under the terms of a sales contract when the associated consideration is not yet due. Changes in contract assets during the year ended December 31, 2021 were primarily attributable to revenue recognized due to the delivery of LNG under certain SPAs for which the associated consideration was not yet due.
The following table reflects the changes in our contract liabilities, which we classify as deferred revenue and other non-current liabilities on our Consolidated Balance Sheets (in millions):
| | | | | | | | | | |
| | |
| | Year Ended December 31, 2021 | | |
| Deferred revenue, beginning of period | | $ | 138 | | | |
| Cash received but not yet recognized in revenue | | 194 | | | |
| Revenue recognized from prior period deferral | | (138) | | | |
| Deferred revenue, end of period | | $ | 194 | | | |
We record deferred revenue when we receive consideration, or such consideration is unconditionally due from a customer, prior to transferring goods or services to the customer under the terms of a sales contract. Changes in deferred revenue during the years ended December 31, 2021 and 2020 are primarily attributable to differences between the timing of revenue recognition and the receipt of advance payments related to delivery of LNG under certain SPAs.
Transaction Price Allocated to Future Performance Obligations
Because many of our sales contracts have long-term durations, we are contractually entitled to significant future consideration which we have not yet recognized as revenue. The following table discloses the aggregate amount of the transaction price that is allocated to performance obligations that have not yet been satisfied as of December 31, 2021 and 2020:
| | | | | | | | | | | | | | | | | | | | | | | | | | |
| | December 31, 2021 | | December 31, 2020 |
| | Unsatisfied Transaction Price (in billions) | | Weighted Average Recognition Timing (years) (1) | | Unsatisfied Transaction Price (in billions) | | Weighted Average Recognition Timing (years) (1) |
| LNG revenues | | $ | 107.1 | | | 9 | | $ | 102.3 | | | 10 |
| Regasification revenues | | 1.9 | | | 4 | | 2.1 | | | 5 |
| Total revenues | | $ | 109.0 | | | | | $ | 104.4 | | | |
(1)The weighted average recognition timing represents an estimate of the number of years during which we shall have recognized half of the unsatisfied transaction price.
CHENIERE ENERGY, INC. AND SUBSIDIARIES
NOTES TO CONSOLIDATED FINANCIAL STATEMENTS—CONTINUED
We have elected the following exemptions which omit certain potential future sources of revenue from the table above:
(1)We omit from the table above all performance obligations that are part of a contract that has an original expected duration of one year or less.
(2)The table above excludes substantially all variable consideration under our SPAs and TUAs. We omit from the table above all variable consideration that is allocated entirely to a wholly unsatisfied performance obligation or to a wholly unsatisfied promise to transfer a distinct good or service that forms part of a single performance obligation when that performance obligation qualifies as a series. The amount of revenue from variable fees that is not included in the transaction price will vary based on the future prices of Henry Hub throughout the contract terms, to the extent customers elect to take delivery of their LNG, and adjustments to the consumer price index. Certain of our contracts contain additional variable consideration based on the outcome of contingent events and the movement of various indexes. We have not included such variable consideration in the transaction price to the extent the consideration is considered constrained due to the uncertainty of ultimate pricing and receipt. Approximately 60% and 40% of our LNG revenues from contracts included in the table above during the years ended December 31, 2021 and 2020, respectively, were related to variable consideration received from customers. During each of the years ended December 31, 2021 and 2020, approximately 5% of our regasification revenues were related to variable consideration received from customers.
We may enter into contracts to sell LNG that are conditioned upon one or both of the parties achieving certain milestones such as reaching FID on a certain liquefaction Train, obtaining financing or achieving substantial completion of a Train and any related facilities. These contracts are considered completed contracts for revenue recognition purposes and are included in the transaction price above when the conditions are considered probable of being met.
NOTE 14—RELATED PARTY TRANSACTIONS
Natural Gas Supply Agreements
SPL Natural Gas Supply Agreement
SPL was party to a natural gas supply agreement with a related party in the ordinary course of business, to obtain a fixed minimum daily volume of feed gas for the operation of the SPL Project. This related party was partially owned by Blackstone Inc., who also partially owns CQP’s limited partner interests. This entity was acquired by a non-related party on December 31, 2021; therefore, as of such date, this agreement ceased to be considered a related party agreement.
CCL Natural Gas Supply Agreement
CCL was party to a natural gas supply agreement with a related party in the ordinary course of business, to obtain a fixed minimum daily volume of feed gas for the operation of the CCL Project. However, this entity was acquired by a non-related party on November 1, 2021; therefore, as of such date, this agreement ceased to be considered a related party and the related party transactions disclosed herein were recognized prior to this date.
The Liquefaction Supply Derivatives related to this agreement were recorded on our Consolidated Balance Sheets as follows (in millions, except notional amount):
| | | | | | | | | | | |
| December 31, |
| | | |
| 2021 | | 2020 |
| Current derivative assets | $ | — | | | $ | 3 | |
| Derivative assets | — | | | 1 | |
| | | |
| Notional amount (in TBtu) | — | | | 60 | |
CHENIERE ENERGY, INC. AND SUBSIDIARIES
NOTES TO CONSOLIDATED FINANCIAL STATEMENTS—CONTINUED
We recorded the following amounts on our Consolidated Statements of Operations during the years ended December 31, 2021, 2020 and 2019 related to these agreements (in millions):
| | | | | | | | | | | | | | | | | | | | | | | |
| | | Year Ended December 31, |
| | | | | 2021 | | 2020 | | 2019 |
| Cost of sales (a) (1) | | | | | $ | 162 | | | $ | 114 | | | $ | 85 | |
| | | | | | | | | |
| (a) Included in costs of sales: | | | | | | | | | |
Liquefaction Supply Derivative gain (1) | | | | | $ | 13 | | | $ | (1) | | | $ | (1) | |
(1)Includes amounts recorded related to natural gas supply contracts that SPL and CCL had with related parties. These agreements ceased to be considered related party agreements during 2021, as discussed above.
Natural Gas Transportation and Storage Agreements
SPL is party to various natural gas transportation and storage agreements and CTPL is party to an operational balancing agreement with a related party in the ordinary course of business for the operation of the SPL Project, with initial primary terms of up to 10 years with extension rights. This related party is partially owned by Brookfield Asset Management, Inc., who indirectly acquired a portion of CQP’s limited partner interests in September 2020. We recorded LNG revenue of $1 million and zero, operating and maintenance expense of $46 million and $13 million and cost of sales of $1 million and zero during the years ended December 31, 2021 and 2020, respectively. Additionally, we recorded accrued liabilities of $4 million as of both December 31, 2021 and 2020 with this related party.
CCL is party to natural gas transportation agreements with Midship Pipeline in the ordinary course of business for the operation of the CCL Project, for a period of 10 years which began in May 2020. We account for our investment in Midship Holdings, which manages the business and affairs of Midship Pipeline, as an equity method investment. We recorded operating and maintenance expense of $9 million and $6 million during the years ended December 31, 2021 and 2020, respectively. Additionally, we recorded accrued liabilities of $1 million as of both December 31, 2021 and 2020 with this related party.
Operation and Maintenance Service Agreements
Cheniere LNG O&M Services, LLC (“O&M Services”), our wholly owned subsidiary, provides the development, construction, operation and maintenance services to Midship Pipeline pursuant to agreements in which O&M Services receives an agreed upon fee and reimbursement of costs incurred. O&M Services recorded $7 million, $9 million and $12 million in the years ended December 31, 2021, 2020 and 2019, respectively, of other revenues and $2 million of accounts receivable as of both December 31, 2021 and 2020 for services provided to Midship Pipeline under these agreements.
NOTE 15—INCOME TAXES
The jurisdictional components of income before income taxes and non-controlling interest on our Consolidated Statements of Operations for the years ended December 31, 2021, 2020 and 2019 are as follows (in millions):
| | | | | | | | | | | | | | | | | | | | |
| | | Year Ended December 31, |
| | | 2021 | | 2020 | | 2019 |
| U.S. | | $ | (2,317) | | | $ | 720 | | | $ | 289 | |
| International | | 39 | | | (176) | | | 426 | |
| Total income (loss) before income taxes and non-controlling interest | | $ | (2,278) | | | $ | 544 | | | $ | 715 | |
CHENIERE ENERGY, INC. AND SUBSIDIARIES
NOTES TO CONSOLIDATED FINANCIAL STATEMENTS—CONTINUED
Income tax provision (benefit) included in our reported net income consisted of the following (in millions):
| | | | | | | | | | | | | | | | | | | | |
| | Year Ended December 31, |
| | 2021 | | 2020 | | 2019 |
| Current: | | | | | | |
| Federal | | $ | — | | | $ | — | | | $ | — | |
| State | | 3 | | | — | | | — | |
| Foreign | | 5 | | | — | | | 4 | |
| Total current | | 8 | | | — | | | 4 | |
| | | | | | |
| Deferred: | | | | | | |
| Federal | | (633) | | | 41 | | | (475) | |
| State | | (89) | | | 2 | | | (46) | |
| Foreign | | 1 | | | — | | | — | |
| Total deferred | | (721) | | | 43 | | | (521) | |
| Total income tax provision (benefit) | | $ | (713) | | | $ | 43 | | | $ | (517) | |
Our income tax rates do not bear a customary relationship to statutory income tax rates. A reconciliation of the federal statutory income tax rate of 21% to our effective income tax rate is as follows:
| | | | | | | | | | | | | | | | | | | | |
| | Year Ended December 31, |
| | 2021 | | 2020 | | 2019 |
| U.S. federal statutory tax rate | | 21.0 | % | | 21.0 | % | | 21.0 | % |
| Non-controlling interest | | 7.2 | | | (22.6) | | | (17.2) | |
| State tax, net of federal benefit | | (2.5) | | | — | | | (5.4) | |
| | | | | | |
| Executive compensation | | (0.5) | | | 1.4 | | | 1.3 | |
| | | | | | |
| Nondeductible interest expense | | — | | | 8.0 | | | 5.0 | |
| Foreign earnings taxed in the U.S. | | — | | | 1.2 | | | 6.7 | |
| Foreign rate differential | | (0.1) | | | (3.7) | | | (11.4) | |
| Tax credits | | 0.6 | | | (4.5) | | | (5.2) | |
| Internal restructuring | | — | | | 7.0 | | | — | |
| Other | | — | | | 1.0 | | | 1.4 | |
| Valuation allowance | | 5.6 | | | (0.9) | | | (68.5) | |
| Effective tax rate as reported | | 31.3 | % | | 7.9 | % | | (72.3) | % |
Significant components of our deferred tax assets and liabilities at December 31, 2021 and 2020 are as follows (in millions):
| | | | | | | | | | | | | | |
| | December 31, |
| | 2021 | | 2020 |
| Deferred tax assets | | | | |
| Net operating loss carryforwards and credits | | | | |
| Federal | | $ | 3,231 | | | $ | 3,084 | |
| Foreign | | 2 | | | 3 | |
| State | | 244 | | | 257 | |
| Federal and state tax credits | | 108 | | | 95 | |
| Derivative instruments | | 951 | | | 7 | |
| | | | |
| Other | | 584 | | | 283 | |
| Less: valuation allowance | | (63) | | | (190) | |
| Total deferred tax assets | | 5,057 | | | 3,539 | |
| | | | |
| Deferred tax liabilities | | | | |
| Investment in partnerships | | (716) | | | (765) | |
| | | | |
| Property, plant and equipment | | (2,638) | | | (2,089) | |
| Other | | (499) | | | (196) | |
| Total deferred tax liabilities | | (3,853) | | | (3,050) | |
| | | | |
| Net deferred tax assets | | $ | 1,204 | | | $ | 489 | |
CHENIERE ENERGY, INC. AND SUBSIDIARIES
NOTES TO CONSOLIDATED FINANCIAL STATEMENTS—CONTINUED
Valuation Allowance
We recognize deferred tax assets and liabilities for future tax consequences arising from differences between the carrying amounts of existing assets and liabilities under GAAP and their respective tax bases, and for net operating loss (“NOL”) carryforwards and tax credit carryforwards. We evaluate the realizability of our deferred tax assets as of each reporting date, weighing all positive and negative evidence, and establish a valuation allowance if we determine that it is more likely than not that some or all of our deferred tax assets will not be realized. The assessment requires significant judgment and is performed in each of our applicable jurisdictions. In making such determination, we consider various factors such as historical profitability, future projections of sustained profitability underpinned by fixed-price long-term SPAs, reversal of existing deferred tax liabilities, construction and operational milestones reached on our Liquefaction Projects and our long-term SPAs achieving date of first commercial delivery. We recorded a valuation allowance of $190 million in 2020 against our deferred tax assets. Our valuation allowance decreased by $127 million for the year ended December 31, 2021, which was primarily attributable to a portion of our Louisiana NOLs no longer requiring a valuation allowance. Positive evidence supporting such conclusion included a change in Louisiana tax law allowing for indefinite carryover of NOLs, coupled with successful completion and subsequent operations of Train 3 of the CCL Project, and forecasts of sustained future profitability underpinned by fixed-price long-term SPAs. We maintained a valuation allowance of $63 million at December 31, 2021 primarily against state NOL carryforward deferred tax assets, for which we continue to believe the more likely than not recognition threshold was not met.
NOL and tax credit carryforwards
As of December 31, 2021, we had federal, state and foreign NOL carryforwards of approximately $15.7 billion, $2.4 billion and $10.0 million, respectively. Approximately $13.8 billion of our NOLs have an indefinite carryforward period. All other NOLs will expire between 2028 and 2037.
As of December 31, 2021, we had federal and state tax credit carryforwards of $107 million and $1 million, respectively. The federal tax credit carryforwards include investment tax credit carryforwards of $60 million related to capital equipment placed in service at our Liquefaction Projects. We account for our federal investment tax credits under the flow-through method. The federal tax credit carryforwards also include $44 million of foreign tax credits related to tax years 2014 through 2021. The federal and state tax credit carryforwards will expire between 2024 and 2041.
We experienced an ownership change within the provisions of U.S. Internal Revenue Code (“IRC”) Section 382 in 2008, 2010 and 2012. An analysis of the annual limitation on the utilization of our NOLs was performed in accordance with IRC Section 382. It was determined that IRC Section 382 will not limit the use of our NOLs over the carryover period. We continue to monitor trading activity in our shares which may cause an additional ownership change which could ultimately affect our ability to fully utilize our existing NOL carryforwards.
Unrecognized Tax Benefits
As of December 31, 2021, we had unrecognized tax benefits of $65 million. If recognized, $56 million of unrecognized tax benefits would affect our effective tax rate in future periods. Currently, we do not recognize interest and penalties associated with the unrecognized tax benefits provided in our Consolidated Statements of Operations or our Consolidated Balance Sheets because settlement of uncertain tax positions would result in an adjustment to our NOL carryforward. Interest and penalties related to income tax matters would be recognized as part of income tax expense.
We are subject to tax in the U.S. and various state and foreign jurisdictions and we remain subject to periodic audits and reviews by taxing authorities. Federal and state tax returns for the years after 2017 remain open for examination. Tax authorities may have the ability to review and adjust carryover attributes that were generated prior to these periods if utilized in an open tax year.
CHENIERE ENERGY, INC. AND SUBSIDIARIES
NOTES TO CONSOLIDATED FINANCIAL STATEMENTS—CONTINUED
A reconciliation of the beginning and ending amounts of our unrecognized tax benefits for the years ended December 31, 2021 and 2020, is as follows (in millions):
| | | | | | | | | | | |
| Year Ended December 31, |
| 2021 | | 2020 |
| Balance at beginning of the year | $ | 62 | | | $ | 61 | |
| Additions based on tax positions related to current year | 3 | | | 1 | |
| Additions for tax positions of prior years | — | | | — | |
| Reductions for tax positions of prior years | — | | | — | |
| Settlements | — | | | — | |
| U.S. tax reform rate change | — | | | — | |
| Balance at end of the year | $ | 65 | | | $ | 62 | |
NOTE 16—SHARE-BASED COMPENSATION
We have granted restricted stock shares, restricted stock units, performance stock units and phantom units to employees and non-employee directors under the 2011 Incentive Plan, as amended (the “2011 Plan”) and the 2020 Incentive Plan (the “2020 Plan”). The 2011 Plan and the 2020 Incentive Plan provide for the issuance of 35.0 million shares and 8.0 million shares, respectively, of our common stock that may be in the form of various share-based performance awards deemed by the Compensation Committee of our Board (the “Compensation Committee”).
We recognize share-based compensation based upon the estimated fair value of awards. The recognition period for these costs begins at either the applicable service inception date or grant date and continues throughout the requisite service period.
For equity-classified share-based compensation awards (which include restricted stock shares, restricted stock units and performance stock units granted to employees and non-employee directors), compensation cost is recognized based on the grant-date fair value and not subsequently remeasured unless modified. The fair value is recognized as expense (net of any capitalization) using the straight-line basis for awards that vest based solely on service conditions and using the accelerated recognition method for awards that vest based on performance conditions. For awards with both time and performance-based conditions, we recognize compensation cost based on the probable outcome of the performance condition at each reporting period. For liability-classified share-based compensation awards that cash settle (which include phantom units and a portion of performance stock units), compensation costs are remeasured at fair value through settlement or maturity.
We account for forfeitures as they occur.
Total share-based compensation consisted of the following (in millions):
| | | | | | | | | | | | | | | | | | | | | | | | |
| | | | Year Ended December 31, |
| | | | | | 2021 | | 2020 | | 2019 |
| Share-based compensation costs, pre-tax: | | | | | | | | | | |
| Equity awards | | | | | | $ | 105 | | | $ | 114 | | | $ | 131 | |
| Liability awards (1) | | | | | | 40 | | | 2 | | | 9 | |
| Total share-based compensation | | | | | | 145 | | | 116 | | | 140 | |
| Capitalized share-based compensation | | | | | | (5) | | | (6) | | | (9) | |
| Total share-based compensation expense | | | | | | $ | 140 | | | $ | 110 | | | $ | 131 | |
| Tax benefit associated with share-based compensation expense | | | | | | $ | 33 | | | $ | 23 | | | $ | 14 | |
(1)The amount of share-based compensation recognized in 2021 associated with liability awards includes 0.2 million of performance share units held by five employees that are scheduled to vest in 2022 that were reclassified from equity awards to liability awards during 2021 as a result of a modification to settle the awards in cash in lieu of shares. We recognized approximately $18 million in incremental expense as a result of the modification.
CHENIERE ENERGY, INC. AND SUBSIDIARIES
NOTES TO CONSOLIDATED FINANCIAL STATEMENTS—CONTINUED
The total unrecognized compensation cost at December 31, 2021 relating to non-vested share-based compensation arrangements consisted of the following:
| | | | | | | | | | | |
| Unrecognized Compensation Cost
(in millions) | | Recognized over a weighted average period
(years) |
| Restricted Stock Share Awards | $ | 1 | | | 0.3 |
| Restricted Stock Unit and Performance Stock Unit Awards | $ | 140 | | | 1.5 |
| | | |
Restricted Stock Share Awards
Restricted stock share awards are awards of common stock that are subject to restrictions on transfer and to a risk of forfeiture if the recipient terminates employment with us prior to the lapse of the restrictions. These awards vest based on service conditions (one, two, three or four-year service periods) and performance conditions. All performance conditions of the awards have been achieved as of December 31, 2021.
The table below provides a summary of our restricted stock outstanding (in millions, except for per share information):
| | | | | | | | | | | | | | |
| | |
Shares | | Weighted Average Grant Date Fair Value Per Share |
Non-vested at January 1, 2021 | | 0.1 | | | $ | 41.78 | |
| Granted | | 0.0 | | | 0.00 | |
| Vested | | (0.1) | | | 45.10 | |
| Forfeited | | 0.0 | | | 0.00 | |
Non-vested at December 31, 2021 | | 0.0 | | | $ | 0.00 | |
The fair value of restricted stock share awards vested for the years ended December 31, 2021, 2020 and 2019 were $2 million, $3 million and $3 million, respectively.
Restricted Stock Unit and Performance Stock Unit Awards
Restricted stock units are stock awards that vest over a service period of three years and entitle the holder to receive shares of our common stock upon vesting, subject to restrictions on transfer and to a risk of forfeiture if the recipient terminates employment with us prior to the lapse of the restrictions. Performance stock units provide for cliff vesting after a period of three years with payouts based on metrics dependent upon market and performance achieved over the defined performance period compared to pre-established performance targets. The settlement amounts of the awards are based on a performance condition consisting of cumulative distributable cash flow per share, and in certain circumstances, a market condition consisting of absolute total shareholder return (“ATSR”) of our common stock. All performance stock units will settle entirely in stock, with the exception of awards granted in 2021 and 2022 to certain officers which will settle in cash up to a cap of $3 million and certain awards vesting in 2022 that settled in cash in lieu of shares. In addition, in December 2021 the Board authorized the Compensation Committee, in its discretion, to permit certain officers to make an election to cash settle their performance stock units that are earned and vest in 2023 and 2024.
Where applicable, the compensation for performance stock units containing a market condition of ATSR is based on a fair value assigned to the market metric using a Monte Carlo model as of the grant date, which utilizes level 3 inputs such as projected stock volatility and projected risk free rates, and remains constant through the vesting period for the equity-settled component and is remeasured each reporting period for the cash-settled component. Compensation cost attributed to the performance metric will vary due to changing estimates regarding the expected achievement of the performance metric of cumulative distributable cash flow per share. The number of shares that may be earned at the end of the vesting period ranges from 0% up to 300% of the target award amount. Both restricted stock units and performance stock units will be settled in Cheniere common stock (on a one-for-one basis) and are classified as equity awards, however, a portion of the performance stock units granted in 2021 and 2022 will partially settle in cash, subject to individual limits. In addition, in December 2021 the Board authorized the Compensation Committee, in its discretion, to permit certain officers to make an election to cash settle their performance stock units that are earned and vest in 2023 and 2024. The portion of performance stock units expected to settle in Cheniere common stock (on a one-for-one basis) are classified as equity awards and the portion of performance stock units expected to settle in cash are classified as liability awards.
CHENIERE ENERGY, INC. AND SUBSIDIARIES
NOTES TO CONSOLIDATED FINANCIAL STATEMENTS—CONTINUED
The table below provides a summary of our restricted share unit and performance stock unit awards outstanding assuming payout at target for awards containing performance conditions (in millions, except for per unit information):
| | | | | | | | | | | | | | |
| | | Units | | Weighted Average Grant Date Fair Value Per Unit |
Non-vested at January 1, 2021 | | 3.7 | | | $ | 60.00 | |
| Granted (1) | | 2.2 | | | 70.99 | |
| Vested | | (2.1) | | | 59.57 | |
| Forfeited | | (0.1) | | | 64.31 | |
Non-vested at December 31, 2021 (2) | | 3.7 | | | $ | 66.71 | |
(1)This number includes 0.2 million incremental shares of our common stock that were issued based on performance results from previously-granted performance stock unit awards.
(2)This number excludes 1.3 million performance stock units, which represent the incremental number of common units that would be issued if the maximum level of performance under the target awards amount is achieved.
The table below provides a summary of restricted share unit and performance stock unit awards issued and fair value of units vested:
| | | | | | | | | | | | | | | | | | | | |
| | Year Ended December 31, |
| | 2021 | | 2020 | | 2019 |
| Units issued (in millions) | | 2.2 | | | 1.8 | | | 1.9 | |
| Weighted average grant date fair value per unit | | $ | 70.99 | | | $ | 53.88 | | | $ | 67.47 | |
| Fair value of units vested (in millions) | | $ | 123 | | | $ | 137 | | | $ | 45 | |
Phantom Units Awards
Phantom units are share-based awards granted to employees over a vesting period that entitle the grantee to receive the cash equivalent to the value of a share of our common stock upon each vesting. Phantom units are not eligible to receive quarterly distributions. These awards vest based on service conditions (two, three or four-year service periods). We did not issue any phantom units to our employees and non-employee directors during the years ended December 31, 2021, 2020 and 2019. The remaining outstanding phantom units vested during the year ended December 31, 2021. The value of phantom units vested during the years ended December 31, 2021, 2020 and 2019 was $1 million, $4 million and $11 million, respectively.
NOTE 17—EMPLOYEE BENEFIT PLAN
We have a defined contribution plan (“401(k) Plan”) which allows eligible employees to contribute up to 75% of their compensation up to the Internal Revenue Service maximum. We match each employee’s deferrals (contributions) up to 6% of compensation and may make additional contributions at our discretion. Employees are immediately vested in the contributions made by us. Our contributions to the 401(k) Plan were $15 million for each of the years ended December 31, 2021, 2020 and 2019. We have made no discretionary contributions to the 401(k) Plan to date.
CHENIERE ENERGY, INC. AND SUBSIDIARIES
NOTES TO CONSOLIDATED FINANCIAL STATEMENTS—CONTINUED
NOTE 18—NET INCOME (LOSS) PER SHARE ATTRIBUTABLE TO COMMON STOCKHOLDERS
The following table reconciles basic and diluted weighted average common shares outstanding for the years ended December 31, 2021, 2020 and 2019 (in millions, except per share data):
| | | | | | | | | | | | | | | | | | | | | | | | |
| | | | Year Ended December 31, |
| | | | | | 2021 | | 2020 | | 2019 |
| Net income (loss) attributable to common stockholders | | | | | | $ | (2,343) | | | $ | (85) | | | 648 |
| | | | | | | | | | |
| Weighted average common shares outstanding: | | | | | | | | | | |
| Basic | | | | | | 253.4 | | | 252.4 | | | 256.2 | |
| Dilutive unvested stock | | | | | | — | | | — | | | 1.9 | |
| | | | | | | | | | |
| Diluted | | | | | | 253.4 | | | 252.4 | | | 258.1 | |
| | | | | | | | | | |
| Net income (loss) per share attributable to common stockholders—basic | | | | | | $ | (9.25) | | | $ | (0.34) | | | $ | 2.53 | |
| Net income (loss) per share attributable to common stockholders—diluted | | | | | | $ | (9.25) | | | $ | (0.34) | | | $ | 2.51 | |
Potentially dilutive securities that were not included in the diluted net income (loss) per share computations because their effects would have been anti-dilutive were as follows (in millions):
| | | | | | | | | | | | | | | | | | | | | | |
| | | | Year Ended December 31, |
| | | | | | 2021 | | 2020 | | 2019 |
| Unvested stock (1) | | | | | | 1.8 | | | 3.4 | | | 2.3 | |
| Convertible notes | | | | | | | | | | |
| 2021 Cheniere Convertible Unsecured Notes (2) | | | | | | — | | | — | | | 13.7 | |
| 11% Convertible Senior Secured Notes due 2025 (“2025 CCH HoldCo II Convertible Senior Notes”) (3) | | | | | | — | | | — | | | 25.5 | |
| 2045 Cheniere Convertible Senior Notes (4) | | | | | | — | | | 4.5 | | | 4.5 | |
| Total potentially dilutive common shares | | | | | | 1.8 | | | 7.9 | | | 46.0 | |
(1)Includes the impact of unvested shares containing performance conditions to the extent that the underlying performance conditions are satisfied based on actual results as of the respective dates.
(2)In the second quarter of 2021, we repaid the remaining principal amount of the 2021 Cheniere Convertible Unsecured Notes in cash; therefore, the 2021 Cheniere Convertible Unsecured Notes were not included in the computation of net income per share for the year ended December 31, 2021. Additionally, since we had the intent and ability to settle the remaining outstanding principal amount of the 2021 Cheniere Convertible Unsecured Notes in cash and the excess conversion premium (the “conversion spread”) in either cash or shares, the treasury stock method was applied for calculating any potential dilutive effect of the conversion spread on net income per share for the year ended December 31, 2020. However, since the average market price of our common stock did not exceed the conversion price of our 2021 Cheniere Convertible Unsecured Notes, the conversion spread was excluded from the computation of diluted net income per share for the year ended December 31, 2020.
(3)In the third quarter of 2020, we redeemed the remaining principal amount of the 2025 CCH HoldCo II Convertible Senior Notes and the related premium in cash; therefore, the 2025 CCH HoldCo II Convertible Senior Notes were not included in the computation of net income per share for the year ended December 31, 2021 and 2020.
(4)Since we had the intent and ability to settle the outstanding principal amount of the 2045 Cheniere Convertible Senior Notes in cash and the conversion spread in either cash or shares, the treasury stock method was applied for calculating any potential dilutive effect of the conversion spread on net income per share for the year ended December 31, 2021. However, since the average market price of our common stock did not exceed the conversion price for our 2045 Cheniere Convertible Senior Notes, the conversion spread was excluded from the computation of diluted net income per share for the year ended December 31, 2021.
CHENIERE ENERGY, INC. AND SUBSIDIARIES
NOTES TO CONSOLIDATED FINANCIAL STATEMENTS—CONTINUED
NOTE 19—STOCKHOLDERS’ EQUITY
Share Repurchase Programs
On June 3, 2019, we announced that our Board authorized a three-year, $1.0 billion share repurchase program of our common stock. On September 7, 2021, the Board authorized a reset in the share repurchase program to $1.0 billion, inclusive of any amounts remaining under the previous authorization as of September 30, 2021, for an additional three years beginning on October 1, 2021. The following table presents information with respect to repurchases of common stock during the years ended December 31, 2021, 2020 and 2019 (in millions, except per share data):
| | | | | | | | | | | | | | | | | | | | | |
| | | Year Ended December 31, |
| | | | | 2021 | | 2020 | | 2019 |
| Aggregate common stock repurchased | | | | | 0.1 | | | 2.9 | | | 4.0 | |
| Weighted average price paid per share | | | | | $ | 87.32 | | | $ | 53.88 | | | $ | 62.27 | |
| Total amount paid | | | | | $ | 9 | | | $ | 155 | | | $ | 249 | |
As of December 31, 2021, we had up to $998 million of the share repurchase program available.
Dividends
During the year ended December 31, 2021, we declared and paid an inaugural quarterly dividend of $0.33 per common share. On January 25, 2022, we declared a quarterly dividend of $0.33 per common share that is payable on February 28, 2022 to shareholders of record as of February 7, 2022.
NOTE 20—COMMITMENTS AND CONTINGENCIES
We have various contractual obligations which are recorded as liabilities in our Consolidated Financial Statements. Other items, such as certain unconditional purchase commitments and other executed contracts which do not meet the definition of a liability as of December 31, 2021, are not recognized as liabilities but require disclosures in our Consolidated Financial Statements.
LNG Terminal Commitments and Contingencies
EPC Contract
SPL has a lump sum turnkey contract with Bechtel Oil, Gas and Chemicals, Inc. (“Bechtel”) for the engineering, procurement and construction of Train 6 of the SPL Project. The total contract price of the EPC contract for Train 6 of the SPL Project, which achieved substantial completion on February 4, 2022, and the third marine berth that is currently under construction is approximately $2.5 billion, reflecting amounts incurred under change orders through December 31, 2021. As of December 31, 2021, we had approximately $0.2 billion remaining under this contract.
Natural Gas Supply, Transportation and Storage Service Agreements
SPL, CCL and CCL Stage III have physical natural gas supply contracts to secure natural gas feedstock for the SPL Project, the CCL Project and potential future development of Corpus Christi Stage 3, respectively. The remaining terms of these contracts range up to 15 years.
Additionally, SPL and CCL have natural gas transportation and storage service agreements for the SPL Project and the CCL Project, respectively. The initial terms of the natural gas transportation agreements range up to 20 years for the SPL Project and the CCL Project, with renewal options for certain contracts, and commence upon the occurrence of conditions precedent. The initial term of the natural gas storage service agreements for the SPL Project ranges up to 10 years and the initial term of the natural gas storage service agreements for the CCL Project ranges up to five years.
CHENIERE ENERGY, INC. AND SUBSIDIARIES
NOTES TO CONSOLIDATED FINANCIAL STATEMENTS—CONTINUED
As of December 31, 2021, the obligations of SPL, CCL and CCL Stage III under natural gas supply, transportation and storage service agreements for contracts in which conditions precedent were met were as follows (in billions):
| | | | | | | | |
| Years Ending December 31, | | Payments Due (1) |
| 2022 | | $ | 8.8 | |
| 2023 | | 6.3 | |
| 2024 | | 4.6 | |
| 2025 | | 3.3 | |
| 2026 | | 2.7 | |
| Thereafter | | 16.5 | |
| Total | | $ | 42.2 | |
(1)Pricing of natural gas supply contracts is variable based on market commodity basis prices adjusted for basis spread, and pricing of IPM agreements is variable based on global gas market prices less fixed liquefaction fees and certain costs by us. Amounts included are based on estimated forward prices and basis spreads as of December 31, 2021. Some of our contracts may not have been negotiated as part of arranging financing for the underlying assets providing the natural gas supply, transportation and storage services. Does not include incremental volumes of approximately 1,790 TBtu and 548 TBtu, respectively, pursuant to an amended IPM agreement and gas supply agreement with EOG Resources, Inc. that was executed subsequent to December 31, 2021, a portion of which is conditional on the in-service date of certain asset infrastructure and substantially all of which will be delivered after 2026.
Environmental and Regulatory Matters
Our LNG terminals and pipelines are subject to extensive regulation under federal, state and local statutes, rules, regulations and laws. These laws require that we engage in consultations with appropriate federal and state agencies and that we obtain and maintain applicable permits and other authorizations. Failure to comply with such laws could result in legal proceedings, which may include substantial penalties. We believe that, based on currently known information, compliance with these laws and regulations will not have a material adverse effect on our results of operations, financial condition or cash flows.
Legal Proceedings
We are, and may in the future be, involved as a party to various legal proceedings, which are incidental to the ordinary course of business. We regularly analyze current information and, as necessary, provide accruals for probable liabilities on the eventual disposition of these matters. We recognize legal costs in connection with legal and regulatory matters as they are incurred. While the results of these litigation matters and claims cannot be predicted with certainty, we believe the reasonably possible losses from such matters, individually and in the aggregate, are not material. Additionally, we believe the probable final outcome of such matters will not have a material impact on our operating results, financial position or cash flows.
NOTE 21—CUSTOMER CONCENTRATION
The following table shows external customers with revenues of 10% or greater of total revenues from external customers and external customers with accounts receivable, net of current expected credit losses and contract assets, net of current expected credit losses balances of 10% or greater of total accounts receivable, net of current expected credit losses from external customers and contract assets, net of current expected credit losses from external customers, respectively:
| | | | | | | | | | | | | | | | | | | | | | | | | | | | | | | | | | | | |
| | | | | | Percentage of Total Revenues from External Customers | | Percentage of Accounts Receivable, Net and Contract Assets, Net from External Customers |
| | | | | | | | |
| | | | Year Ended December 31, | | December 31, |
| | | | | | 2021 | | 2020 | | 2019 | | 2021 | | 2020 |
| Customer A | | | | | | 12% | | 14% | | 16% | | 10% | | 14% |
| Customer B | | | | | | 12% | | 12% | | 10% | | * | | 12% |
| Customer C | | | | | | 10% | | 10% | | 11% | | * | | * |
| Customer D | | | | | | * | | 10% | | 11% | | * | | * |
| | | | | | | | | | | | | | |
| | | | | | | | | | | | | | |
| | | | | | | | | | | | | | |
| | | | | | | | | | | | | | |
* Less than 10%
CHENIERE ENERGY, INC. AND SUBSIDIARIES
NOTES TO CONSOLIDATED FINANCIAL STATEMENTS—CONTINUED
The following table shows revenues from external customers attributable to the country in which the revenues were derived (in millions). We attribute revenues from external customers to the country in which the party to the applicable agreement has its principal place of business.
| | | | | | | | | | | | | | | | | |
| Revenues from External Customers |
| Year Ended December 31, |
| 2021 | | 2020 | | 2019 |
| Ireland | $ | 1,838 | | | $ | 1,130 | | | $ | 989 | |
| Singapore | 1,740 | | | 646 | | | 533 | |
| South Korea | 1,680 | | | 942 | | | 1,207 | |
| Spain | 1,577 | | | 1,034 | | | 598 | |
| India | 1,375 | | | 1,021 | | | 1,160 | |
| United States | 1,340 | | | 2,466 | | | 2,807 | |
| United Kingdom | 1,246 | | | 678 | | | 559 | |
| Other countries | 5,068 | | | 1,441 | | | 1,877 | |
| Total | $ | 15,864 | | | $ | 9,358 | | | $ | 9,730 | |
NOTE 22—SUPPLEMENTAL CASH FLOW INFORMATION
The following table provides supplemental disclosure of cash flow information (in millions):
| | | | | | | | | | | | | | | | | | | | |
| | Year Ended December 31, |
| | 2021 | | 2020 | | 2019 |
| Cash paid during the period for interest on debt, net of amounts capitalized | | $ | 1,365 | | | $ | 1,395 | | | $ | 1,126 | |
| Cash paid for income taxes, net of refunds | | 4 | | | 2 | | | 24 | |
| Non-cash investing and financing activities: | | | | | | |
| Property, plant and equipment, net of accumulated depreciation funded with accounts payable and accrued liabilities | | 339 | | | 282 | | | 473 | |
| | | | | | |
| | | | | | |
ITEM 9. CHANGES IN AND DISAGREEMENTS WITH ACCOUNTANTS ON ACCOUNTING AND FINANCIAL DISCLOSURE
None.
ITEM 9A. CONTROLS AND PROCEDURES
Evaluation of Disclosure Controls and Procedures
Disclosure controls and procedures include, without limitation, controls and procedures designed to ensure that information required to be disclosed by us in reports we file or submit under the Exchange Act is recorded, processed, summarized and reported within the time periods specified in the SEC’s rules and forms, and that such information is accumulated and communicated to our management, including our principal executive officer and principal financial officer, as appropriate, to allow timely decisions regarding required disclosure.
Based on their evaluation as of the end of the fiscal year ended December 31, 2021, our principal executive officer and principal financial officer have concluded that our disclosure controls and procedures (as defined in Rules 13a-15(e) and 15d-15(e) under the Exchange Act) are effective to ensure that information required to be disclosed in reports that we file or submit under the Exchange Act are (1) accumulated and communicated to our management, including our principal executive officer and principal financial officer, as appropriate, to allow timely decisions regarding required disclosure and (2) recorded, processed, summarized and reported within the time periods specified in the SEC’s rules and forms.
During the most recent fiscal quarter, there have been no changes in our internal control over financial reporting that have materially affected, or are reasonably likely to materially affect, our internal control over financial reporting.
Management’s Report on Internal Control Over Financial Reporting
ITEM 9B. OTHER INFORMATION
None.
ITEM 9C. DISCLOSURE REGARDING FOREIGN JURISDICTIONS THAT PREVENT INSPECTIONS
Not applicable.
PART III
Pursuant to paragraph 3 of General Instruction G to Form 10-K, the information required by Items 10 through 13 of Part III of this Report is incorporated by reference from Cheniere’s definitive proxy statement, which is to be filed pursuant to Regulation 14A within 120 days after the end of Cheniere’s fiscal year ended December 31, 2021.
ITEM 14. PRINCIPAL ACCOUNTANT FEES AND SERVICES
Our independent registered public accounting firm is KPMG LLP, Houston, Texas, Auditor Firm ID 185.
The remaining information required by this Item is incorporated by reference from Cheniere’s definitive proxy statement, which is to be filed pursuant to Regulation 14A within 120 days after the end of Cheniere’s fiscal year ended December 31, 2021.
PART IV
ITEM 15. EXHIBITS AND FINANCIAL STATEMENT SCHEDULES
(a) Financial Statements, Schedules and Exhibits
(1) Financial Statements—Cheniere Energy, Inc. and Subsidiaries:
(2) Financial Statement Schedules:
(3) Exhibits:
Certain of the agreements filed as exhibits to this Form 10-K contain representations, warranties, covenants and conditions by the parties to the agreements that have been made solely for the benefit of the parties to the agreement. These representations, warranties, covenants and conditions:
•should not in all instances be treated as categorical statements of fact, but rather as a way of allocating the risk to one of the parties if those statements prove to be inaccurate;
•may have been qualified by disclosures that were made to the other parties in connection with the negotiation of the agreements, which disclosures are not necessarily reflected in the agreements;
•may apply standards of materiality that differ from those of a reasonable investor; and
•were made only as of specified dates contained in the agreements and are subject to subsequent developments and changed circumstances.
Accordingly, these representations and warranties may not describe the actual state of affairs as of the date they were made or at any other time. These agreements are included to provide you with information regarding their terms and are not intended to provide any other factual or disclosure information about the Company or the other parties to the agreements. Investors should not rely on them as statements of fact.
| | | | | | | | | | | | | | | | | | | | | | | | | | | | | | | | | |
| Exhibit No. | | | | Incorporated by Reference (1) | |
| Description | | Entity | | Form | | Exhibit | | Filing Date | |
| 2.1 | | | | CQP | | 8-K | | 10.2 | | 8/9/2012 | |
| 3.1 | | | | Cheniere | | 10-Q | | 3.1 | | 8/10/2004 | |
| 3.2 | | | | Cheniere | | 8-K | | 3.1 | | 2/8/2005 | |
| | | | | | | | | | | | | | | | | | | | | | | | | | | | | | | | | |
| Exhibit No. | | | | Incorporated by Reference (1) | |
| Description | | Entity | | Form | | Exhibit | | Filing Date | |
| 3.3 | | | | Cheniere (SEC File No. 333-160017) | | S-8 | | 4.3 | | 6/16/2009 | |
| 3.4 | | | | Cheniere | | 8-K | | 3.1 | | 6/7/2012 | |
| 3.5 | | | | Cheniere | | 8-K | | 3.1 | | 2/5/2013 | |
| 3.6 | | | | Cheniere | | 8-K | | 3.1 | | 12/15/2015 | |
| 3.7 | | | | Cheniere | | 8-K | | 3.1 | | 9/19/2016 | |
| 4.1 | | | | Cheniere (SEC File No. 333-10905) | | S-1 | | 4.1 | | 8/27/1996 | |
| 4.2 | | | | CQP | | 8-K | | 4.1 | | 2/4/2013 | |
| 4.3 | | | | CQP | | 8-K | | 4.1.1 | | 4/16/2013 | |
| 4.4 | | | | CQP | | 8-K | | 4.1.2 | | 4/16/2013 | |
| 4.5 | | | | CQP | | 8-K | | 4.1.2 | | 4/16/2013 | |
| 4.6 | | | | CQP | | 8-K | | 4.1 | | 11/25/2013 | |
| 4.7 | | | | CQP | | 8-K | | 4.1 | | 5/22/2014 | |
| 4.8 | | | | CQP | | 8-K | | 4.1 | | 5/22/2014 | |
| 4.9 | | | | CQP | | 8-K | | 4.2 | | 5/22/2014 | |
| 4.10 | | | | CQP | | 8-K | | 4.2 | | 5/22/2014 | |
| 4.11 | | | | CQP | | 8-K | | 4.1 | | 3/3/2015 | |
| 4.12 | | | | CQP | | 8-K | | 4.1 | | 3/3/2015 | |
| 4.13 | | | | CQP | | 8-K | | 4.1 | | 6/14/2016 | |
| 4.14 | | | | CQP | | 8-K | | 4.1 | | 6/14/2016 | |
| 4.15 | | | | CQP | | 8-K | | 4.1 | | 9/23/2016 | |
| 4.16 | | | | CQP | | 8-K | | 4.2 | | 9/23/2016 | |
| 4.17 | | | | CQP | | 8-K | | 4.2 | | 9/23/2016 | |
| 4.18 | | | | CQP | | 8-K | | 4.1 | | 3/6/2017 | |
| 4.19 | | | | CQP | | 8-K | | 4.1 | | 3/6/2017 | |
| | | | | | | | | | | | | | | | | | | | | | | | | | | | | | | | | |
| Exhibit No. | | | | Incorporated by Reference (1) | |
| Description | | Entity | | Form | | Exhibit | | Filing Date | |
| 4.20 | | | | SPL | | 8-K | | 4.1 | | 5/8/2020 | |
| 4.21 | | | | SPL | | 8-K | | 4.1 | | 5/8/2020 | |
| 4.22 | | | | CQP | | 8-K | | 4.1 | | 2/27/2017 | |
| 4.23 | | | | CQP | | 8-K | | 4.1 | | 2/27/2017 | |
| 4.24* | | | | | | | | | | | |
| 4.25* | | | | | | | | | | | |
| 4.26* | | | | | | | | | | | |
| 4.27* | | | | | | | | | | | |
| 4.28* | | | | | | | | | | | |
| 4.29* | | | | | | | | | | | |
| 4.30* | | | | | | | | | | | |
| 4.31* | | | | | | | | | | | |
| 4.32* | | | | | | | | | | | |
| 4.33* | | | | | | | | | | | |
| 4.34 | | | | Cheniere | | 8-K | | 4.1 | | 3/13/2015 | |
| 4.35 | | | | Cheniere | | 8-K | | 4.2 | | 3/13/2015 | |
| 4.36 | | | | Cheniere | | 8-K | | 4.2 | | 3/13/2015 | |
| 4.37 | | | | Cheniere | | 8-K | | 4.1 | | 9/22/2020 | |
| 4.38 | | | | Cheniere | | 8-K | | 4.2 | | 9/22/2020 | |
| 4.39 | | | | Cheniere | | 8-K | | 4.2 | | 9/22/2020 | |
| 4.40 | | Indenture, dated as of May 18, 2016, among CCH, as Issuer, CCL, CCP and Corpus Christi Pipeline GP, LLC, as Guarantors, and The Bank of New York Mellon, as Trustee | | Cheniere | | 8-K | | 4.1 | | 5/18/2016 | |
| 4.41 | | | | Cheniere | | 8-K | | 4.1 | | 5/18/2016 | |
| 4.42 | | First Supplemental Indenture, dated as of December 9, 2016, among CCH, as Issuer, CCL, CCP and Corpus Christi Pipeline GP, LLC, as Guarantors, and The Bank of New York Mellon, as Trustee | | Cheniere | | 8-K | | 4.1 | | 12/9/2016 | |
| 4.43 | | | | Cheniere | | 8-K | | 4.1 | | 12/9/2016 | |
| | | | | | | | | | | | | | | | | | | | | | | | | | | | | | | | | |
| Exhibit No. | | | | Incorporated by Reference (1) | |
| Description | | Entity | | Form | | Exhibit | | Filing Date | |
| 4.44 | | Second Supplemental Indenture, dated as of May 19, 2017, among CCH, as issuer, CCL, CCP and Corpus Christi Pipeline GP, LLC, as Guarantors, and The Bank of New York Mellon, as trustee | | CCH | | 8-K | | 4.1 | | 5/19/2017 | |
| 4.45 | | | | CCH | | 8-K | | 4.1 | | 5/19/2017 | |
| 4.46 | | Third Supplemental Indenture, dated as of September 6, 2019, among CCH, as issuer, CCL, CCP and Corpus Christi Pipeline GP, LLC, as Guarantors, and The Bank of New York Mellon, as Trustee | | CCH | | 8-K | | 4.1 | | 9/12/2019 | |
| 4.47 | | Fourth Supplemental Indenture, dated as of November 13, 2019, among CCH, as issuer, CCL, CCP and Corpus Christi Pipeline GP, LLC, as guarantors, and The Bank of New York Mellon, as trustee | | CCH | | 8-K | | 4.1 | | 11/13/2019 | |
| 4.48 | | | | CCH | | 8-K | | 4.1 | | 11/13/2019 | |
| 4.49 | | Fifth Supplemental Indenture, dated as of August 24, 2021, among CCH, as issuer, CCL, CCP, and Corpus Christi Pipeline GP, LLC, as guarantors, and The Bank of New York Mellon, as trustee | | CCH | | 8-K | | 4.1 | | 8/24/2021 | |
| 4.50 | | | | CCH | | 8-K | | 4.1 | | 8/24/2021 | |
| 4.51 | | Indenture, dated as of August 20, 2020, among CCH, as issuer, and CCL, CCP and Corpus Christi Pipeline GP, LLC, as guarantors, and The Bank of New York Mellon, as trustee | | CCH | | 8-K | | 4.1 | | 8/21/2020 | |
| 4.52 | | | | CCH | | 8-K | | 4.1 | | 8/21/2020 | |
| 4.53 | | Indenture, dated as of September 27, 2019, among CCH, as issuer, and CCL, CCP and Corpus Christi Pipeline GP, LLC, as guarantors, and The Bank of New York Mellon, as trustee | | CCH | | 8-K | | 4.1 | | 9/30/2019 | |
| 4.54 | | | | CCH | | 8-K | | 4.1 | | 9/30/2019 | |
| 4.55 | | Indenture, dated as of October 17, 2019, among CCH, as issuer, and CCL, CCP and Corpus Christi Pipeline GP, LLC, as guarantors, and The Bank of New York Mellon, as trustee | | CCH | | 8-K | | 4.1 | | 10/18/2019 | |
| 4.56 | | | | CCH | | 8-K | | 4.1 | | 10/18/2019 | |
| 4.57 | | | | CQP | | 8-K | | 4.1 | | 9/18/2017 | |
| 4.58 | | | | CQP | | 8-K | | 4.2 | | 9/18/2017 | |
| 4.59 | | | | CQP | | 8-K | | 4.1 | | 9/12/2018 | |
| 4.60 | | | | CQP | | 8-K | | 4.1 | | 9/12/2019 | |
| 4.61 | | | | CQP | | 8-K | | 4.1 | | 9/12/2019 | |
| 4.62 | | | | Cheniere | | 10-Q | | 4.4 | | 11/6/2020 | |
| 4.63 | | | | CQP | | 8-K | | 4.1 | | 3/11/2021 | |
| | | | | | | | | | | | | | | | | | | | | | | | | | | | | | | | | |
| Exhibit No. | | | | Incorporated by Reference (1) | |
| Description | | Entity | | Form | | Exhibit | | Filing Date | |
| 4.64 | | | | CQP | | 8-K | | 4.1 | | 3/11/2021 | |
| 4.65 | | | | CQP | | 8-K | | 4.1 | | 9/27/2021 | |
| 4.66 | | | | CQP | | 8-K | | 4.1 | | 9/27/2021 | |
| 4.67 | | | | CQP | | 8-K | | 4.1 | | 10/1/2021 | |
| 4.68 | | | | Cheniere | | 10-K | | 4.45 | | 2/25/2020 | |
| 10.1 | | | | Cheniere | | 10-Q | | 10.1 | | 11/15/2004 | |
| 10.2 | | | | Cheniere | | 10-K | | 10.40 | | 3/10/2005 | |
| 10.3 | | | | Cheniere | | 10-Q | | 10.2 | | 8/6/2010 | |
| 10.4 | | | | Cheniere | | 10-Q | | 10.2 | | 11/15/2004 | |
| 10.5 | | | | Cheniere | | 10-Q | | 10.3 | | 11/15/2004 | |
| 10.6 | | | | CQP | | 10-Q | | 10.1 | | 11/2/2012 | |
| 10.7 | | | | Cheniere | | 10-Q | | 10.4 | | 11/15/2004 | |
| 10.8 | | | | SPLNG | | S-4 | | 10.28 | | 11/22/2006 | |
| 10.9 | | | | Cheniere | | 10-Q | | 10.3 | | 8/6/2010 | |
| 10.10 | | | | Cheniere | | 10-Q | | 10.5 | | 11/15/2004 | |
| 10.11 | | | | SPLNG | | S-4 | | 10.12 | | 11/22/2006 | |
| 10.12 | | | | SPLNG | | 8-K | | 10.1 | | 8/6/2012 | |
| 10.13 | | | | SPLNG | | 10-Q | | 10.1 | | 8/2/2013 | |
| 10.14 | | | | SPLNG | | 8-K | | 10.2 | | 8/6/2012 | |
| 10.15† | | | | Cheniere | | 10-Q | | 10.1 | | 8/8/2017 | |
| 10.16† | | | | Cheniere | | 8-K | | 10.13 | | 8/10/2012 | |
| 10.17† | | | | Cheniere | | 10-K | | 10.37 | | 2/24/2017 | |
| 10.18† | | | | Cheniere | | 10-Q | | 10.2 | | 5/4/2017 | |
| 10.19† | | | | Cheniere | | 10-K | | 10.38 | | 2/24/2017 | |
10.20† | | | | Cheniere | | 10-K | | 10.39 | | 2/24/2017 | |
| | | | | | | | | | | | | | | | | | | | | | | | | | | | | | | | | |
| Exhibit No. | | | | Incorporated by Reference (1) | |
| Description | | Entity | | Form | | Exhibit | | Filing Date | |
| 10.21† | | | | Cheniere | | 10-K | | 10.40 | | 2/24/2017 | |
| 10.22† | | | | Cheniere | | 10-Q | | 10.4 | | 5/4/2017 | |
| 10.23† | | | | Cheniere | | 10-Q | | 10.5 | | 5/4/2017 | |
| 10.24† | | | | Cheniere | | 10-K | | 10.41 | | 2/24/2017 | |
| 10.25† | | | | Cheniere | | 10-Q | | 10.7 | | 5/4/2017 | |
| 10.26† | | | | Cheniere | | 10-K | | 10.42 | | 2/24/2017 | |
| 10.27† | | | | Cheniere | | 10-Q | | 10.8 | | 5/4/2017 | |
| 10.28† | | | | Cheniere | | 10-K | | 10.43 | | 2/24/2017 | |
| 10.29† | | | | Cheniere | | 10-Q | | 10.9 | | 5/4/2017 | |
| 10.30† | | | | Cheniere | | 10-K | | 10.35 | | 2/26/2019 | |
| 10.31† | | | | Cheniere | | 10-Q | | 10.9 | | 4/30/2015 | |
| 10.32† | | | | Cheniere | | 10-Q | | 10.10 | | 4/30/2015 | |
| 10.33† | | | | Cheniere | | 10-Q | | 10.11 | | 4/30/2015 | |
| 10.34† | | | | Cheniere | | 10-Q | | 10.12 | | 4/30/2015 | |
| 10.35† | | | | Cheniere | | 10-Q | | 10.13 | | 4/30/2015 | |
| 10.36† | | | | Cheniere | | 10-Q | | 10.14 | | 4/30/2015 | |
| 10.37† | | | | Cheniere | | 10-Q | | 10.15 | | 4/30/2015 | |
| 10.38† | | | | Cheniere (SEC No. 333-238261) | | S-8 | | 4.9 | | 5/14/2020 | |
| 10.39† | | | | Cheniere | | 8-K | | 10.4 | | 5/20/2020 | |
| 10.40† | | | | Cheniere | | 10-Q | | 10.1 | | 8/5/2021 | |
| 10.41† | | | | Cheniere | | 8-K | | 10.5 | | 5/20/2020 | |
| 10.42† | | | | Cheniere | | 8-K | | 10.6 | | 5/20/2020 | |
| | | | | | | | | | | | | | | | | | | | | | | | | | | | | | | | | |
| Exhibit No. | | | | Incorporated by Reference (1) | |
| Description | | Entity | | Form | | Exhibit | | Filing Date | |
| 10.43† | | | | Cheniere | | 10-K | | 10.45 | | 2/24/2021 | |
| 10.44†* | | | | | | | | | | | |
| 10.45†* | | | | | | | | | | | |
| 10.46†* | | | | | | | | | | | |
| 10.47†* | | | | | | | | | | | |
| 10.48† | | | | Cheniere | | 8-K | | 10.1 | | 5/12/2016 | |
| 10.49† | | | | Cheniere | | 8-K | | 10.1 | | 8/15/2019 | |
| 10.50† | | | | Cheniere | | 8-K | | 10.1 | | 8/13/2021 | |
| 10.51† | | | | Cheniere | | 10-K | | 10.49 | | 2/25/2020 | |
| 10.52† | | | | Cheniere | | 8-K | | 10.2 | | 5/20/2020 | |
| 10.53† | | | | Cheniere | | 8-K | | 10.1 | | 5/20/2020 | |
| 10.54† | | | | Cheniere | | 8-K | | 10.1 | | 11/1/2019 | |
| 10.55† | | | | Cheniere | | 8-K | | 10.1 | | 8/6/2020 | |
| 10.56 | | | | Cheniere | | 8-K | | 10.2 | | 3/23/2020 | |
| 10.57 | | | | SPL | | 8-K | | 10.1 | | 3/23/2020 | |
| 10.58 | | | | SPL | | 8-K | | 10.3 | | 3/23/2020 | |
| 10.59 | | | | Cheniere | | 10-Q | | 10.2 | | 11/4/2021 | |
| 10.60 | | | | Cheniere | | 8-K | | 10.1 | | 5/24/2018 | |
| | | | | | | | | | | | | | | | | | | | | | | | | | | | | | | | | |
| Exhibit No. | | | | Incorporated by Reference (1) | |
| Description | | Entity | | Form | | Exhibit | | Filing Date | |
| 10.61 | | Amended and Restated Common Terms Agreement, dated May 22, 2018, among CCH, CCP, Corpus Christi Pipeline GP, LLC, CCL, Société Générale, as Term Loan Facility Agent, The Bank of Nova Scotia as Working Capital Facility Agent, and Société Générale as Intercreditor Agent, and any other facility lenders party thereto from time to time | | Cheniere | | 8-K | | 10.2 | | 5/24/2018 | |
| 10.62 | | First Amendment to the Amended and Restated Common Terms Agreement, dated as of November 28, 2018, by and among CCH, CCL, CCP and Corpus Christi Pipeline GP, LLC, Société Générale as Term Loan Facility Agent, The Bank of Nova Scotia as Working Capital Facility Agent, each other Facility Agent on behalf of its respective Facility Lenders, and Société Générale as Intercreditor Agent | | Cheniere | | 10-K | | 10.6 | | 2/26/2019 | |
| 10.63 | | | | Cheniere | | 10-Q | | 10.4 | | 11/1/2019 | |
| 10.64 | | Third Amendment to the Amended and Restated Common Terms Agreement, dated as of November 8, 2019, by and among CCH, CCL, CCP and Corpus Christi Pipeline GP, LLC, Société Générale as Term Loan Facility Agent, The Bank of Nova Scotia as Working Capital Facility Agent, each other Facility Agent on behalf of its respective Facility Lenders, and Société Générale as the Intercreditor Agent | | Cheniere | | 10-K | | 10.62 | | 2/24/2021 | |
| 10.65 | | Fourth Amendment to the Amended and Restated Common Terms Agreement, dated as of November 26, 2019, by and among CCH, CCL, CCP and Corpus Christi Pipeline GP, LLC, Société Générale as Term Loan Facility Agent, The Bank of Nova Scotia as Working Capital Facility Agent, each other Facility Agent on behalf of its respective Facility Lenders, and Société Générale as the Intercreditor Agent | | Cheniere | | 10-K | | 10.63 | | 2/24/2021 | |
| 10.66 | | Fifth Amendment to the Amended and Restated Common Terms Agreement, dated as of November 16, 2020, by and among CCH, CCL, CCP and Corpus Christi Pipeline GP, LLC, Société Générale as Term Loan Facility Agent, The Bank of Nova Scotia as Working Capital Facility Agent, each other Facility Agent on behalf of its respective Facility Lenders, and Société Générale as the Intercreditor Agent | | Cheniere | | 10-K | | 10.64 | | 2/24/2021 | |
| 10.67 | | Sixth Amendment to the Amended and Restated Common Terms Agreement, dated as of April 1, 2021, by and among CCH, CCL, CCP and Corpus Christi Pipeline GP, LLC, Société Générale as the Term Loan Facility Agent, The Bank of Nova Scotia as the Working Capital Facility Agent, each other Facility Agent on behalf of its respective Facility Lenders, and Société Générale as the Intercreditor Agent | | Cheniere | | 10-Q | | 10.3 | | 8/5/2021 | |
| 10.68* | | Seventh Amendment to the Amended and Restated Common Terms Agreement, dated as of October 8, 2021, by and among CCH, CCL, CCP and Corpus Christi Pipeline GP, LLC, Société Générale as the Term Loan Facility Agent, The Bank of Nova Scotia as the Working Capital Facility Agent, each other Facility Agent on behalf of its respective Facility Lenders, and Société Générale as the Intercreditor Agent | | | | | | | | | |
| | | | | | | | | | | | | | | | | | | | | | | | | | | | | | | | | |
| Exhibit No. | | | | Incorporated by Reference (1) | |
| Description | | Entity | | Form | | Exhibit | | Filing Date | |
| 10.69* | | Eighth Amendment to the Amended and Restated Common Terms Agreement, dated as of November 16, 2021, by and among CCH, CCL, CCP and Corpus Christi Pipeline GP, LLC, Société Générale as the Term Loan Facility Agent, The Bank of Nova Scotia as the Working Capital Facility Agent, each other Facility Agent on behalf of its respective Facility Lenders, and Société Générale as the Intercreditor Agent | | | | | | | | | |
| 10.70 | | Amended and Restated Common Security and Account Agreement, dated May 22, 2018, among CCH, CCP, Corpus Christi Pipeline GP, LLC, CCL, the Senior Creditor Group Representatives, Société Générale as the Intercreditor Agent, Société Générale as Security Trustee and Mizuho Bank, Ltd as the Account Bank | | Cheniere | | 8-K | | 10.3 | | 5/24/2018 | |
| 10.71 | | First Amendment to the Amended and Restated Common Security and Account Agreement, dated as of November 28, 2018, by and among CCH, CCL, CCP and Corpus Christi Pipeline GP, LLC, the Senior Creditor Group Representatives, Société Générale as Intercreditor Agent for the Facility Lenders and any Hedging Banks, Société Générale as Security Trustee, and Mizuho Bank, Ltd. as Account Bank | | Cheniere | | 10-K | | 10.62 | | 2/26/2019 | |
| 10.72 | | Second Amendment to Common Security and Account Agreement, dated as of August 30, 2019, by and among CCH, CCL, CCP, Corpus Christi Pipeline GP, LLC, the Senior Creditor Group Representatives, Société Générale as Intercreditor Agent for the Facility Lenders and any Hedging Banks, Société Générale as Security Trustee, and Mizuho Bank, Ltd; as Account Bank | | Cheniere | | 10-Q | | 10.5 | | 11/1/2019 | |
| 10.73 | | Third Amendment to Common Security and Account Agreement, dated as of November 16, 2020, by and among CCH, CCL, CCP, Corpus Christi Pipeline GP, LLC, the Senior Creditor Group Representatives, Société Générale as Intercreditor Agent for the Facility Lenders and any Hedging Banks, Société Générale as Security Trustee, and Mizuho Bank, Ltd; as Account Bank | | Cheniere | | 10-K | | 10.68 | | 2/24/2021 | |
| 10.74 | | Fourth Amendment to Common Security and Account Agreement, dated as of April 1, 2021, among CCH, CCL, CCP and Corpus Christi Pipeline GP, LLC, the Senior Creditor Group Representatives, Société Générale as Intercreditor Agent for the Facility Lenders and any Hedging Banks, Société Générale as Security Trustee, and Mizuho Bank, Ltd. as Account Bank | | Cheniere | | 10-Q | | 10.2 | | 8/5/2021 | |
| 10.75* | | Fifth Amendment to Common Security and Account Agreement, dated as of October 8, 2021, among CCH, CCL, CCP and Corpus Christi Pipeline GP, LLC, the Senior Creditor Group Representatives, Société Générale as Intercreditor Agent for the Facility Lenders and any Hedging Banks, Société Générale as Security Trustee, and Mizuho Bank, Ltd. as Account Bank | | | | | | | | | |
| 10.76* | | Sixth Amendment to Common Security and Account Agreement, dated as of November 16, 2021, among CCH, CCL, CCP and Corpus Christi Pipeline GP, LLC, the Senior Creditor Group Representatives, Société Générale as Intercreditor Agent for the Facility Lenders and any Hedging Banks, Société Générale as Security Trustee, and Mizuho Bank, Ltd. as Account Bank | | | | | | | | | |
| 10.77 | | | | Cheniere | | 8-K | | 10.4 | | 5/24/2018 | |
| 10.78 | | | | Cheniere | | 8-K | | 10.5 | | 5/24/2018 | |
| | | | | | | | | | | | | | | | | | | | | | | | | | | | | | | | | |
| Exhibit No. | | | | Incorporated by Reference (1) | |
| Description | | Entity | | Form | | Exhibit | | Filing Date | |
| 10.79 | | Amended and Restated Working Capital Facility Agreement, dated June 29, 2018, among CCH, CCP, Corpus Christi Pipeline GP, LLC, CCL, the lenders party thereto from time to time, the issuing banks party thereto from time to time, the Bank of Nova Scotia as Working Capital Facility Agent, and Société Générale as Security Trustee | | Cheniere | | 8-K | | 10.1 | | 7/2/2018 | |
| 10.80 | | | | Cheniere | | 8-K | | 10.1 | | 11/1/2021 | |
| 10.81 | | | | Cheniere | | 10-Q | | 10.7 | | 11/1/2019 | |
| 10.82 | | | | Cheniere | | 8-K | | 10.1 | | 6/19/2020 | |
| 10.83 | | | | Cheniere | | 10-Q | | 10.11 | | 8/6/2020 | |
| 10.84 | | Credit and Guaranty Agreement, dated as of May 29, 2019, among the CQP, as Borrower, certain subsidiaries of the CQP, as Subsidiary Guarantors, the lenders from time to time party thereto, MUFG Bank, Ltd., as Administrative Agent and Sole Coordinating Lead Arranger, and certain arrangers and other participants | | Cheniere | | 8-K | | 10.1 | | 6/3/2019 | |
| 10.85 | | Amended and Restated Senior Working Capital Revolving Credit and Letter of Credit Reimbursement Agreement, dated September 4, 2015, as amended by (a) Third Omnibus Amendment, dated as of May 23, 2018; (b) Fourth Omnibus Amendment, dated as of September 17, 2018; and (c) Fifth Omnibus Amendment, Consent and Waiver, dated as of May 29, 2019, among SPL, as Borrower, The Bank of Nova Scotia, as Senior Issuing Bank and Senior Facility Agent, ABN Amro Capital USA LLC, HSBC Bank USA, National Association and ING Capital LLC, as Senior Issuing Banks, Société Générale, as Swing Line Lender and Common Security Trustee, and the senior lenders party thereto from time to time | | Cheniere | | 10-Q | | 10.2 | | 8/8/2019 | |
| 10.86 | | | | CQP | | 8-K | | 10.1 | | 9/27/2021 | |
| 10.87 | | | | CCH | | 8-K | | 10.1 | | 8/24/2021 | |
| 10.88 | | | | Cheniere | | 8-K | | 10.1 | | 11/9/2018 | |
| | | | | | | | | | | | | | | | | | | | | | | | | | | | | | | | | |
| Exhibit No. | | | | Incorporated by Reference (1) | |
| Description | | Entity | | Form | | Exhibit | | Filing Date | |
| 10.89 | | | | Cheniere | | 10-Q | | 10.6 | | 8/8/2019 | |
| 10.90 | | Change order to the Lump Sum Turnkey Agreement for the Engineering, Procurement and Construction of the Sabine Pass LNG Stage 4 Liquefaction Facility, dated November 7, 2018, by and between SPL and Bechtel Oil Gas and Chemicals, Inc.: (i) the Change Order CO-00002 Fuel Provisional Sum Closure, dated July 8, 2019, (ii) the Change Order CO-00003 Currency Provisional Sum Closure, dated July 8, 2019, (iii) the Change Order CO-00004 Foreign Trade Zone, dated July 2, 2019, (iv) the Change Order CO-00005 NGPL Gate Access Security Coordination Provisional Sum, dated July 17, 2019, (v) the Change Order CO-00006 Alternate to Adams Valves, dated August 14, 2019, (vi) the Change Order CO-00007 E-1503 to HRU Permanent Drain Piping, dated August 14, 2019, (vii) the Change Order CO-00008 Differing Subsurface Soil Conditions - Train 6 ISBL, dated August 27, 2019, (viii) the Change Order CO-00009 LNG Berth 3, dated September 25, 2019 and (iv) the Change Order CO-00010 Cold Box Redesign and Addition of Inspection Boxes on Methane Cold Box, dated September 16, 2019 | | Cheniere | | 10-Q | | 10.10 | | 11/1/2019 | |
| 10.91 | | | | Cheniere | | 10-K | | 10.88 | | 2/25/2020 | |
| 10.92 | | Change order to the Lump Sum Turnkey Agreement for the Engineering, Procurement and Construction of the Sabine Pass LNG Stage 4 Liquefaction Facility, dated November 7, 2018, by and between SPL and Bechtel Oil Gas and Chemicals, Inc.: (i) the Change Order CO-00013 Cost to Comply with SPL FTZ (FTZ entries, bonded transports and receipts for AG Pipe Spools Only), dated February 10, 2020, (ii) the Change Order CO-00014 Permanent Access Road to Third Berth, dated February 10, 2020, (iii) the Change Order CO-00015 Modifications to Schedule Bonus Language, dated February 10, 2020, (iv) the Change Order CO-00016 LNG Berth 3 LNTP No 3, dated January 31, 2020 and (v) the Change Order CO-00017 Construction Doc Fender Guards and LP Fuel Gas Overpressure Interlock, dated March 18, 2020 | | Cheniere | | 10-Q | | 10.6 | | 4/30/2020 | |
| 10.93 | | Change order to the Lump Sum Turnkey Agreement for the Engineering, Procurement and Construction of the Sabine Pass LNG Stage 4 Liquefaction Facility, dated November 7, 2018, by and between SPL and Bechtel Oil Gas and Chemicals, Inc.: (i) the Change Order CO-00018 Electrical Studies for GTG Grid Modification, dated April 2, 2020, (ii) the Change Order CO-00019 Third Berth - Change in 5kV Electrical Tie-In, dated April 30, 2020, (iii) the Change Order CO-00020 LNG Berth 3 LNTP No. 4, dated May 4, 2020, (iv) the Change Order CO-00021 Train 6 P1601 A/B/ Flange Changes, dated May 27, 2020 and (v) the Change Order CO-00022 Train 6 H2S Skid Modifications to Level Transmitters & GTG Pressure Range Change on PT-573 A/B, dated June 4, 2020 | | Cheniere | | 10-Q | | 10.9 | | 8/6/2020 | |
| | | | | | | | | | | | | | | | | | | | | | | | | | | | | | | | | |
| Exhibit No. | | | | Incorporated by Reference (1) | |
| Description | | Entity | | Form | | Exhibit | | Filing Date | |
| 10.94 | | Change orders to the Lump Sum Turnkey Agreement for the Engineering, Procurement and Construction of the Sabine Pass LNG Stage 4 Liquefaction Facility, dated November 7, 2018, by and between SPL and Bechtel Oil Gas and Chemicals, Inc.: (i) the Change Order CO-00023 Third Berth Vapor Fence Provisional Sum Scope Removal and Closeout, dated June 22, 2020, (ii) the Change Order CO-00024 Train 6 Thermowell Upgrades, dated June 22, 2020, (iii) the Change Order CO-00025 Third Berth Bubble Curtain, dated June 22, 2020, (iv) the Change Order CO-00026 Third Berth Fuel Provisional Sum Closure Change Order, dated July 14, 2020, (v) the Change Order CO-00027 Third Berth Currency Provisional Sum Closure Change Order, dated July 20, 2020, (vi) the Change Order CO-00028 Train 6 Hot Oil WHRU PSV Bypass, dated August 11, 2020 and (vii) the Change Order CO-00029 Change in Law IMO 2020 Regulatory Change – Low Sulphur Emissions on Marine Vessels, dated August 25, 2020 | | Cheniere | | 10-Q | | 10.2 | | 11/6/2020 | |
| 10.95 | | Change order to the Lump Sum Turnkey Agreement for the Engineering, Procurement and Construction of the Sabine Pass LNG Stage 4 Liquefaction Facility, dated November 7, 2018, by and between the SPL and Bechtel Oil Gas and Chemicals, Inc.: (i) the Change Order CO-00030 Third Berth Soil Preparation Provisional Sum Interim Adjustment Change Order, dated September 16, 2020, (ii) the Change Order CO-00031 Provisional Sum Consolidation (PAB, Taxes & Insurance), dated October 2, 2020, (iii) the Change Order CO-00032 COVID-19 Impacts, dated October 2, 2020, (iv) the Change Order CO-00033 Third Berth - Jetty Building (00A-4041) - Clean Agent System, dated November 2, 2020 and (v) the Change Order CO-00034 Vanessa Spare Valves, dated November 18, 2020 | | Cheniere | | 10-K | | 10.88 | | 2/24/2021 | |
| 10.96 | | Change orders to the Lump Sum Turnkey Agreement for the Engineering, Procurement and Construction of the Sabine Pass LNG Stage 4 Liquefaction Facility, dated November 7, 2018, by and between SPL and Bechtel Oil Gas and Chemicals, Inc.: (i) the Change Order CO-00035 Impacts from Hurricanes Laura and Delta, dated December 22, 2020, (ii) the Change Order CO-00036 Third Berth - Add N2 Connection on Liquid & Hybrid SVT Loading Arm Apex, dated December 22, 2020, (iii) the Change Order CO-00037 Third Berth Design Vessels Update, dated December 22, 2020, (iv) the Change Order CO-00038 Train 6 PV-16002 & FV-15104 Valve Trim Upgrades, dated January 21, 2021, (v) the Change Order CO-00039 Third Berth Design Update to Supply Bunkering Fuel, dated February 11, 2021, (vi) the Change Order CO-00040 LNG Benchmark 7 Elevation Change, dated February 11, 2021, (vii) the Change Order CO-00041 Costs to Comply with SPL FTZ (Excluding Pipe Spools), dated February 12, 2021 and (viii) the Change Order CO-00042 COVID-19 Impacts 1Q2021, dated March 12, 2021 | | Cheniere | | 10-Q | | 10.2 | | 5/4/2021 | |
| | | | | | | | | | | | | | | | | | | | | | | | | | | | | | | | | |
| Exhibit No. | | | | Incorporated by Reference (1) | |
| Description | | Entity | | Form | | Exhibit | | Filing Date | |
| 10.97 | | Change orders to the Lump Sum Turnkey Agreement for the Engineering, Procurement and Construction of the Sabine Pass LNG Stage 4 Liquefaction Facility, dated November 7, 2018, by and between SPL and Bechtel Oil Gas and Chemicals, Inc.: (i) the Change Order CO-00043 Third Berth SVT Loading Arm Spares, dated April 9, 2021, (ii) the Change Order CO-00044 Third Berth U/G Directional Drilling & Cathodic Protection Provisional Sum Closures, dated April 9, 2021, (iii) the Change Order CO-00045 Winter Storm Impacts, dated April 9, 2021, (iv) the Change Order CO-00046 NGPL Security Provisional Sum Interim Adjustment, dated June 15, 2021, (v) the Change Order CO-00047 80 Acres Bridge, dated June 15, 2021 and (vi) the Change Order CO-00048 AGRU Additions for Lean Solvent Overpressure, dated June 15, 2021 | | Cheniere | | 10-Q | | 10.4 | | 8/5/2021 | |
| 10.98 | | Change orders to the Lump Sum Turnkey Agreement for the Engineering, Procurement and Construction of the Sabine Pass LNG Stage 4 Liquefaction Facility, dated November 7, 2018, by and between SPL and Bechtel Oil Gas and Chemicals, Inc.: (i) the Change Order CO-00049 COVID-19 Impacts 2Q2021, dated July 6, 2021, (ii) CO-00050 Third Berth Bunkering Ship Modifications — Pre-Investment for Foundations, dated July 6, 2021, (iii) CO-00051 Thermal Oxidizer Controls Change, dated September 8, 2021, (iv) CO-00052 Third Berth Spare Beacon and Additional Cable Tray, dated September 8, 2021 and (v) CO-00053 Train 6 Gearbox Assembly Replacement for Unit 1411, dated September 24, 2021 | | Cheniere | | 10-Q | | 10.1 | | 11/4/2021 | |
| 10.99* | | Change orders to the Lump Sum Turnkey Agreement for the Engineering, Procurement and Construction of the Sabine Pass LNG Stage 4 Liquefaction Facility, dated November 7, 2018, by and between SPL and Bechtel Oil Gas and Chemicals, Inc.: (i) the Change Order CO-00054 80 Acres Bridge Credit, dated November 30, 2021, (ii) CO-00055 Change in Law LPDES Permit - Water Treatment Filter Washing, dated December15, 2021, (iii) CO-00056 Impacts from Hurricane Ida, dated December 15, 2021 and (iv) CO-00057 Impacts from Hurricane Nicholas, dated December 15, 2021 | | | | | | | | | |
| 10.100 | | | | Cheniere | | 10-K/A | | 10.23 | | 4/27/2018 | |
| 10.101 | | Change orders to the Amended and Restated Fixed Price Separated Turnkey Agreement for the Engineering, Procurement and Construction of the Corpus Christi Stage 2 Liquefaction Facility, dated as of December 12, 2017, between CCL and Bechtel Oil, Gas and Chemicals, Inc.: (i) the Change Order CO-00001 Stage 2 EPC Agreement Revised Table A-2, dated May 18, 2018, (ii) the Change Order CO-00002 Stage 2 EPC Agreement Amended and Restated Attachment C, dated May 18, 2018, (iii) the Change Order CO-00003 Fuel Provisional Sum Adjustment, dated May 24, 2018, (iv) the Change Order CO-00004 Currency Provisional Sum Adjustment, dated May 29, 2018, (v) the Change Order CO-00005 JT Valve Modifications, dated July 10, 2018 and (vi) the Change Order CO-00006 Tank B Soil Conditions, International Building Code, and East Jetty Marine Facility Schedule Acceleration, dated September 5, 2018 (Portions of this exhibit have been omitted and filed separately with the SEC pursuant to a request for confidential treatment.) | | Cheniere | | 10-Q | | 10.3 | | 11/8/2018 | |
| | | | | | | | | | | | | | | | | | | | | | | | | | | | | | | | | |
| Exhibit No. | | | | Incorporated by Reference (1) | |
| Description | | Entity | | Form | | Exhibit | | Filing Date | |
| 10.102 | | Change orders to the Amended and Restated Fixed Price Separated Turnkey Agreement for the Engineering, Procurement and Construction of the Corpus Christi Stage 2 Liquefaction Facility, dated as of December 12, 2017, between CCL and Bechtel Oil, Gas and Chemicals, Inc.: (i) the Change Order CO-00007 Tell-Tale Signs, Additional Tie-Ins, and System Inspection Isometrics, dated October 15, 2018, (ii) the Change Order CO-00008 Insurance Provisional Sum Interim Adjustment, dated November 19, 2018 and (iii) the Change Order CO-00009 Traffic and Logistics Impacts Due to Enforcement of Electronic Logging Devices, dated November 28, 2018 (Portions of this exhibit have been omitted and filed separately with the SEC pursuant to a request for confidential treatment.) | | Cheniere | | 10-K | | 10.117 | | 2/26/2019 | |
| 10.103 | | Change orders to the Amended and Restated Fixed Price Separated Turnkey Agreement for the Engineering, Procurement and Construction of the Corpus Christi Stage 2 Liquefaction Facility, dated as of December 12, 2017, between CCL and Bechtel Oil, Gas and Chemicals, Inc.: (i) the Change Order CO-000010 OSHA Handrail Requirement Changes Impact, dated January 25, 2019, (ii) the Change Order CO-00011 Differing Soil Conditions - Train 3, dated March 7, 2019 and (iii) the Change Order CO-00012 Tank B Logo Deletion, dated March 25, 2019 (Portions of this exhibit have been omitted.) | | Cheniere | | 10-Q | | 10.2 | | 5/9/2019 | |
| 10.104 | | Change orders to the Amended and Restated Fixed Price Separated Turnkey Agreement for the Engineering, Procurement and Construction of the Corpus Christi Stage 2 Liquefaction Facility, dated as of December 12, 2017, between CCL and Bechtel Oil, Gas and Chemicals, Inc.: (i) the Change Order CO-000013 Section 232 Steel and Aluminum Tariffs & Anti-dumping (ADA) and Countervailing Duties (CVD), dated May 2, 2019, (ii) the Change Order CO-00014 Tank B Jump-over Tie-In Interface - Long Lead Items, dated May 2, 2019 and (iii) the Change Order CO-00015 Section 232 Steel and Aluminum Tariffs & Anti-dumping (ADA) and Countervailing Duties (CVD) Q1_2019, dated June 4, 2019 (Portions of this exhibit have been omitted.) | | Cheniere | | 10-Q | | 10.4 | | 8/8/2019 | |
| 10.105 | | Change orders to the Amended and Restated Fixed Price Separated Turnkey Agreement for the Engineering, Procurement and Construction of the Corpus Christi Stage 2 Liquefaction Facility, dated as of December 12, 2017, between CCL and Bechtel Oil, Gas and Chemicals, Inc.: (i) the Change Order CO-000016 Tank B Jump-over Tie-In (Part 1) and Deletion of East Jetty Shroud, dated August 5, 2019, (ii) the Change Order CO-00017 H2S Removal Skid PSVs Modifications and Revision to Chemical Cleaning Milestones, dated August 5, 2019 and (iii) the Change Order CO-00018 Cold Box Redesign Major Permanent Plant Materials and Ethylene Cold Box’s E-1504 Partial Mockup, dated September 6, 2019 (Portions of this exhibit have been omitted.) | | Cheniere | | 10-Q | | 10.9 | | 11/1/2019 | |
| | | | | | | | | | | | | | | | | | | | | | | | | | | | | | | | | |
| Exhibit No. | | | | Incorporated by Reference (1) | |
| Description | | Entity | | Form | | Exhibit | | Filing Date | |
| 10.106 | | Change orders to the Amended and Restated Fixed Price Separated Turnkey Agreement for the Engineering, Procurement and Construction of the Corpus Christi Stage 2 Liquefaction Facility, dated as of December 12, 2017, between CCL and Bechtel Oil, Gas and Chemicals, Inc.: (i) the Change Order CO-00019 Aircraft Warning Lights, dated September 23, 2019, (ii) the Change Order CO-00020 Section 232 Steel and Aluminum Tariffs & Anti-dumping (ADA) and Countervailing Duties (CVD) Q2_2019, dated October 8, 2019, (iii) the Change Order CO-00021 Spare Transition Joints for Potential Future Cold Box Modifications, dated October 8, 2019, (iv) the Change Order CO-00022 Modification of the Train 3 Methane Cold Box, dated December 6, 2019 and (v) the Change Order Co-00023 Section 232 Steel & Aluminum Tariffs & Anti-dumping (ADA) and Countervailing Duties (CVD) Q3_2019, dated December 10, 2019 (Portions of this exhibit have been omitted.) | | Cheniere | | 10-K | | 10.95 | | 2/25/2020 | |
| 10.107 | | Change orders to the Amended and Restated Fixed Price Separated Turnkey Agreement for the Engineering, Procurement and Construction of the Corpus Christi Stage 2 Liquefaction Facility, dated as of December 12, 2017, between CCL and Bechtel Oil, Gas and Chemicals, Inc.: (i) the Change Order CO-00024 East Jetty Cooldown Line & Simultaneous Ship Loading, dated January 6, 2020, (ii) the Change Order CO-00025 East Jetty Manual Gas Sampler, dated January 7, 2020, (iii) the Change Order CO-00026 Study for Adding Valve Actuator for E-W Jetty Flow Segregation, dated January 8, 2020, (iv) the Change Order CO-00027 Tank B Isolation of Proposed Fourth In-Tank LNG Pump - Long Lead Items, dated January 8, 2020, (v) the Change Order CO-00028 Tank B Rundown Line (Part I), dated January 31, 2020, (vi) the Change Order CO-00029 9% Nickel and Cryogenic Rebar Provisional Sum Closeout, dated February 18, 2020 and (vii) the Change Order CO-00030 Additional Valve for Isolation in CCL Stage 2 to CCL Stage 3 from Tank B, dated February 18, 2020 (Portions of this exhibit have been omitted) | | Cheniere | | 10-Q | | 10.7 | | 4/30/2020 | |
| 10.108 | | Change orders to the Amended and Restated Fixed Price Separated Turnkey Agreement for the Engineering, Procurement and Construction of the Corpus Christi Stage 2 Liquefaction Facility, dated as of December 12, 2017, between CCL and Bechtel Oil, Gas and Chemicals, Inc.: (i) the Change Order CO-00031 Tank B Isolation of Proposed 4th In-Tank LNG Pump (Post Start-Up of Tank B) - EPC, dated April 1, 2020, (ii) the Change Order CO-00032 Train 3 Thermowell Upgrades, dated April 3, 2020, (iii) the Change Order CO-00033 Tank B Rundown Line (Part 2) Development Costs, dated April 29, 2020 and (iv) the Change Order CO-00034 Train 3 UPS Modification of MV Motors, dated May 21, 2020 (Portions of this exhibit have been omitted) | | Cheniere | | 10-Q | | 10.10 | | 8/6/2020 | |
| | | | | | | | | | | | | | | | | | | | | | | | | | | | | | | | | |
| Exhibit No. | | | | Incorporated by Reference (1) | |
| Description | | Entity | | Form | | Exhibit | | Filing Date | |
| 10.109 | | Change orders to the Amended and Restated Fixed Price Separated Turnkey Agreement for the Engineering, Procurement and Construction of the Corpus Christi Stage 2 Liquefaction Facility, dated as of December 12, 2017, between CCL and Bechtel Oil, Gas and Chemicals, Inc.: (i) the Change Order CO-00035 Spill Conveyance from Flare KO Drum Area, dated July 6, 2020, (ii) the Change Order CO-00036 Tie-Ins for Heavy Hydrocarbon Removal Modifications (E&P) Rev 1, dated August 5, 2020, (iii) the Change Order CO-00037 Train 3 PV-16002 Valve Trim Change - Rev 1, dated August 14, 2020, (iv) the Change Order CO-00038 Hot Oil Overpressure Relief, dated August 14, 2020, (v) the Change Order CO-00039 Supply of Nitrogen for Commissioning Units 16, 17 and Feed Gas, dated August 20, 2020 and (vi) the Change Order CO-00040 COVID-19 Impacts, dated September 15, 2020 (Portions of this exhibit have been omitted) | | Cheniere | | 10-Q | | 10.3 | | 11/6/2020 | |
| 10.110 | | Change orders to the Amended and Restated Fixed Price Separated Turnkey Agreement for the Engineering, Procurement and Construction of the Corpus Christi Stage 2 Liquefaction Facility, dated as of December 12, 2017, between CCL and Bechtel Oil, Gas and Chemicals, Inc.: (i) the Change Order CO-00041 Additional O&M Support (COVID-19), dated October 2, 2020 and (ii) the Change Order CO-00042 Replacement of Owner Spare Parts, dated December 31, 2020 (Portions of this exhibit have been omitted) | | Cheniere | | 10-K | | 10.99 | | 2/24/2021 | |
| 10.111 | | | | Cheniere | | 10-Q | | 10.3 | | 5/4/2021 | |
| 10.112 | | | | CQP | | 8-K | | 10.1 | | 11/21/2011 | |
| 10.113 | | | | CQP | | 10-Q | | 10.1 | | 5/3/2013 | |
| 10.114 | | | | SPL (SEC File No. 333-215882) | | S-4 | | 10.3 | | 2/3/2017 | |
| 10.115 | | | | CQP | | 8-K | | 10.1 | | 12/12/2011 | |
| 10.116 | | | | CQP | | 10-K | | 10.18 | | 2/22/2013 | |
| 10.117 | | | | CQP | | 8-K | | 10.1 | | 1/26/2012 | |
| 10.118 | | | | CQP | | 8-K | | 10.1 | | 1/30/2012 | |
| 10.119 | | | | CQP | | 10-K | | 10.19 | | 2/22/2013 | |
| 10.120 | | | | SPL | | 8-K | | 10.1 | | 8/11/2014 | |
| | | | | | | | | | | | | | | | | | | | | | | | | | | | | | | | | |
| Exhibit No. | | | | Incorporated by Reference (1) | |
| Description | | Entity | | Form | | Exhibit | | Filing Date | |
| 10.121 | | | | SPL | | 10-K | | 10.14 | | 2/24/2017 | |
| 10.122 | | | | Cheniere | | 8-K | | 10.1 | | 6/2/2014 | |
| 10.123 | | | | Cheniere | | 10-Q | | 10.6 | | 5/4/2018 | |
| 10.124 | | | | CCH | | S-4 | | 10.32 | | 1/5/2017 | |
| 10.125 | | | | CCH | | S-4 | | 10.33 | | 1/5/2017 | |
| 10.126 | | | | CCH | | S-4 | | 10.34 | | 1/5/2017 | |
| 10.127 | | | | Cheniere | | 10-Q | | 10.7 | | 11/6/2007 | |
| 10.128 | | | | CQP | | 8-K | | 10.1 | | 8/6/2012 | |
| 10.129 | | | | CQP | | 8-K | | 3.1 | | 2/21/2017 | |
| 10.130 | | | | Cheniere Holdings | | 8-K | | 10.3 | | 12/18/2013 | |
| 10.131 | | Nomination and Standstill Agreement, dated August 21, 2015, by and between the Company, Icahn Partners Master Fund LP, Icahn Partners LP, Icahn Onshore LP, Icahn Offshore LP, Icahn Capital LP, IPH GP LLC, Icahn Enterprises Holdings LP, Icahn Enterprises G.P. Inc., Beckton Corp., High River Limited Partnership, Hopper Investments LLC, Barberry Corp., Carl C. Icahn, Jonathan Christodoro and Samuel Merksamer | | Cheniere | | 8-K | | 99.1 | | 8/24/2015 | |
| 21.1* | | | | | | | | | | | |
| 23.1* | | | | | | | | | | | |
| 31.1* | | | | | | | | | | | |
| 31.2* | | | | | | | | | | | |
| 32.1** | | | | | | | | | | | |
| 32.2** | | | | | | | | | | | |
| 101.INS* | | XBRL Instance Document | | | | | | | | | |
| | | | | | | | | | | | | | | | | | | | | | | | | | | | | | | | | |
| Exhibit No. | | | | Incorporated by Reference (1) | |
| Description | | Entity | | Form | | Exhibit | | Filing Date | |
| 101.SCH* | | XBRL Taxonomy Extension Schema Document | | | | | | | | | |
| 101.CAL* | | XBRL Taxonomy Extension Calculation Linkbase Document | | | | | | | | | |
| 101.DEF* | | XBRL Taxonomy Extension Definition Linkbase Document | | | | | | | | | |
| 101.LAB* | | XBRL Taxonomy Extension Labels Linkbase Document | | | | | | | | | |
| 101.PRE* | | XBRL Taxonomy Extension Presentation Linkbase Document | | | | | | | | | |
| 104* | | Cover Page Interactive Data File (formatted as Inline XBRL and contained in Exhibit 101) | | | | | | | | | |
| | | | | |
| (1) | Exhibits are incorporated by reference to reports of Cheniere (SEC File No. 001-16383), CQP (SEC File No. 001-33366), Cheniere Energy Partners LP Holdings, LLC (“Cheniere Holdings”) (SEC File No. 001-36234), SPL (SEC File No. 333-192373), CCH (SEC File No. 333-215435) and SPLNG (SEC File No. 333-138916), as applicable, unless otherwise indicated. |
| * | Filed herewith. |
| ** | Furnished herewith. |
| † | Management contract or compensatory plan or arrangement. |
SCHEDULE I—CONDENSED FINANCIAL INFORMATION OF REGISTRANT
CHENIERE ENERGY, INC.
CONDENSED STATEMENTS OF OPERATIONS
(in millions)
| | | | | | | | | | | | | | | | | |
| | Year Ended December 31, |
| | 2021 | | 2020 | | 2019 |
| | | | | |
| General and administrative expense | $ | 17 | | | $ | 20 | | | $ | 17 | |
| Depreciation expense | 1 | | | — | | | — | |
| Total operating costs and expenses | 18 | | | 20 | | | 17 | |
| | | | | |
| Other income (expense) | | | | | |
| Interest expense, net of capitalized interest | (151) | | | (155) | | | (141) | |
| Interest income | — | | | — | | | 1 | |
| Loss on modification or extinguishment of debt | (6) | | | (50) | | | — | |
| Equity in income (loss) of subsidiaries | (2,584) | | | 77 | | | 490 | |
| Total other income (expense) | (2,741) | | | (128) | | | 350 | |
| | | | | |
| Income (loss) before income taxes | (2,759) | | | (148) | | | 333 | |
| Less: income tax benefit | (416) | | | (63) | | | (315) | |
| | | | | |
| Net income (loss) attributable to common stockholders | $ | (2,343) | | | $ | (85) | | | $ | 648 | |
The accompanying notes are an integral part of these condensed financial statements.
SCHEDULE I—CONDENSED FINANCIAL INFORMATION OF REGISTRANT
CHENIERE ENERGY, INC.
CONDENSED BALANCE SHEETS
(in millions)
| | | | | | | | | | | |
| | December 31, |
| | 2021 | | 2020 |
| ASSETS | | | |
| Current assets | | | |
| Cash and cash equivalents | $ | 17 | | | $ | — | |
| Restricted cash and cash equivalents | — | | | 1 | |
| Other current assets | 1 | | | 1 | |
| Total current assets | 18 | | | 2 | |
| | | |
| Property, plant and equipment, net of accumulated depreciation | 35 | | | 30 | |
| Operating lease assets | 19 | | | 22 | |
| Debt issuance and deferred financing costs, net of accumulated amortization | 16 | | | 15 | |
| Investments in subsidiaries | — | | | 2,324 | |
| Deferred tax assets | 797 | | | 381 | |
| Total assets | $ | 885 | | | $ | 2,774 | |
| | | |
| LIABILITIES AND STOCKHOLDERS’ DEFICIT | | | |
| Current liabilities | | | |
| Current operating lease liabilities | $ | 6 | | | $ | 5 | |
| Current debt | — | | | 103 | |
| Other current liabilities | 30 | | | 37 | |
| Total current liabilities | 36 | | | 145 | |
| | | |
| Long-term debt, net of discount and debt issuance costs | 2,285 | | | 2,790 | |
| Investments in subsidiaries | 1,110 | | | — | |
| Operating lease liabilities | 24 | | | 30 | |
| Other non-current liabilities | 1 | | | — | |
| | | |
| Stockholders’ deficit | (2,571) | | | (191) | |
| Total liabilities and stockholders’ deficit | $ | 885 | | | $ | 2,774 | |
The accompanying notes are an integral part of these condensed financial statements.
SCHEDULE I—CONDENSED FINANCIAL INFORMATION OF REGISTRANT
CHENIERE ENERGY, INC.
CONDENSED STATEMENTS OF CASH FLOWS
(in millions)
| | | | | | | | | | | | | | | | | |
| | Year Ended December 31, |
| | 2021 | | 2020 | | 2019 |
| Net cash provided by (used in) operating activities | $ | (232) | | | $ | (285) | | | $ | 74 | |
| | | | | |
| Cash flows from investing activities | | | | | |
| Property, plant and equipment | (6) | | | (13) | | | (2) | |
| Distribution from (investment in) subsidiaries | 1,498 | | | (481) | | | 842 | |
| Net cash provided by (used in) investing activities | 1,492 | | | (494) | | | 840 | |
| | | | | |
| Cash flows from financing activities | | | | | |
| Proceeds from issuance of debt | 1,579 | | | 4,778 | | | — | |
| Redemptions and repayments of debt | (2,022) | | | (3,143) | | | — | |
| Debt issuance and other financing costs | (9) | | | (57) | | | — | |
| Debt modification or extinguishment costs | (1) | | | (29) | | | — | |
| Cash dividends to shareholders | (85) | | | — | | | — | |
| Distributions to non-controlling interest | (649) | | | (626) | | | (591) | |
| | | | | |
| Payments related to tax withholdings for share-based compensation | (48) | | | (43) | | | (19) | |
| Repurchase of common stock | (9) | | | (155) | | | (249) | |
| | | | | |
| Net cash provided by (used in) financing activities | (1,244) | | | 725 | | | (859) | |
| | | | | |
| Net increase (decrease) in cash, cash equivalents and restricted cash and cash equivalents | 16 | | | (54) | | | 55 | |
| Cash, cash equivalents and restricted cash and cash equivalents—beginning of period | 1 | | | 55 | | | — | |
| Cash, cash equivalents and restricted cash and cash equivalents—end of period | $ | 17 | | | $ | 1 | | | $ | 55 | |
Balances per Condensed Balance Sheets:
| | | | | | | | | | | |
| December 31, |
| 2021 | | 2020 |
| Cash and cash equivalents | $ | 17 | | | $ | — | |
| Restricted cash and cash equivalents | — | | | 1 | |
| | | |
| Total cash, cash equivalents and restricted cash and cash equivalents | $ | 17 | | | $ | 1 | |
The accompanying notes are an integral part of these condensed financial statements.
SCHEDULE I—CONDENSED FINANCIAL INFORMATION OF REGISTRANT
CHENIERE ENERGY, INC.
NOTES TO CONDENSED FINANCIAL STATEMENTS
NOTE 1—SUMMARY OF SIGNIFICANT ACCOUNTING POLICIES
The Condensed Financial Statements represent the financial information required by Securities and Exchange Commission Regulation S-X 5-04 for Cheniere.
In the Condensed Financial Statements, Cheniere’s investments in affiliates are presented at the net amount attributable to Cheniere. Under this method, the assets and liabilities of affiliates are not consolidated. The investments in net assets of the affiliates are recorded on the Condensed Balance Sheets. The income from operations of the affiliates is reported on a net basis as investment in affiliates (equity in income of subsidiaries).
A substantial amount of Cheniere’s operating, investing and financing activities are conducted by its affiliates. The Condensed Financial Statements should be read in conjunction with Cheniere’s Consolidated Financial Statements.
Recent Accounting Standards
In March 2020, the FASB issued ASU 2020-04, Reference Rate Reform (Topic 848): Facilitation of the Effects of Reference Rate Reform on Financial Reporting. This guidance primarily provides temporary optional expedients which simplify the accounting for contract modifications to existing contracts expected to arise from the market transition from LIBOR to alternative reference rates. The transition period under this standard is effective March 12, 2020 and will apply through December 31, 2022.
We have a revolving credit facility indexed to LIBOR. To date, we have amended our revolving credit facility to incorporate a fallback replacement rate indexed to SOFR as a result of the expected LIBOR transition. We elected to apply the optional expedients as applicable to certain modified terms, however the impact of applying the optional expedients has not been material thus far. We will continue to elect to apply the optional expedients to qualifying contract modifications in the future.
NOTE 2—DEBT
As of December 31, 2021 and 2020, our debt consisted of the following (in millions):
| | | | | | | | | | | | | | |
| | December 31, |
| | 2021 | | 2020 |
| | | | |
4.625% Senior Secured Notes due 2028 | | 2,000 | | | 2,000 | |
4.875% Convertible Unsecured Notes due 2021 (1) | | — | | | 476 | |
4.25% Convertible Senior Notes due 2045 (2) | | 625 | | | 625 | |
| Cheniere Revolving Credit Facility | | — | | | — | |
| Cheniere Term Loan Facility | | — | | | 148 | |
| Total debt | | 2,625 | | | 3,249 | |
| | | | |
Current portion of long-term debt | | — | | | (104) | |
| | | | |
| Unamortized discount and debt issuance costs, net | | (340) | | | (355) | |
| Total long-term debt, net of discount and debt issuance costs | | $ | 2,285 | | | $ | 2,790 | |
(1)A portion of the outstanding balance that is due within one year is classified as current portion of long-term debt.
(2)The redemption of these notes was financed with borrowings under the Cheniere Revolving Credit Facility, which is a long-term debt instrument. Therefore, the 4.25% Convertible Senior Notes due 2045 were classified as long-term debt as of December 31, 2021.
SCHEDULE I—CONDENSED FINANCIAL INFORMATION OF REGISTRANT
CHENIERE ENERGY, INC.
NOTES TO CONDENSED FINANCIAL STATEMENTS—CONTINUED
Below is a schedule of future principal payments that we are obligated to make on our outstanding debt at December 31, 2021 (in millions):
| | | | | | | | |
| Years Ending December 31, | | Principal Payments |
| 2022 (1) | | $ | 625 | |
| 2023 | | — | |
| 2024 | | — | |
| 2025 | | — | |
| 2026 | | — | |
| Thereafter | | 2,000 | |
| Total | | $ | 2,625 | |
(1)Includes $625 million aggregate principal amount outstanding of the 2045 Cheniere Convertible Senior Notes as we issued a notice of redemption on December 6, 2021 for all amounts outstanding. As discussed above, the balance is classified as long-term debt in our Balance Sheets as the redemption was financed with long-term borrowings subsequent to the balance sheet date.
NOTE 3—GUARANTEES
Cheniere has various financial and performance guarantees and indemnifications which are issued in the normal course of business. These contracts include performance guarantees and stand-by letters of credit. Cheniere enters into these arrangements to facilitate commercial transactions with third parties by enhancing the value of the transaction to the third party. As of December 31, 2021, outstanding guarantees and other assurances aggregated approximately $472 million of varying duration, consisting of parental guarantees. No liabilities were recognized under these guarantee arrangements as of December 31, 2021.
NOTE 4—LEASES
Our leased assets consist primarily of office space and facilities, which are classified as operating leases.
The following table shows the classification and location of our right-of-use assets and lease liabilities on our Condensed Balance Sheets (in millions):
| | | | | | | | | | | | | | | | | | | |
| | | December 31, | | |
| Condensed Balance Sheet Location | | 2021 | | 2020 | | |
| Right-of-use assets—Operating | Operating lease assets | | $ | 19 | | | $ | 22 | | | |
| Total right-of-use assets | | | $ | 19 | | | $ | 22 | | | |
| | | | | | | |
| Current operating lease liabilities | Current operating lease liabilities | | $ | 6 | | | $ | 5 | | | |
| Non-current operating lease liabilities | Operating lease liabilities | | 24 | | | 30 | | | |
| Total lease liabilities | | | $ | 30 | | | $ | 35 | | | |
The following table shows the classification and location of our lease cost on our Condensed Statements of Operations (in millions):
| | | | | | | | | | | | | | | | | |
| | | Year Ended December 31, |
| Condensed Statements of Operations Location | | 2021 | | 2020 |
| Operating lease cost (1) | General and administrative expense | | $ | 9 | | | $ | 10 | |
(1)Includes $4 million of variable lease costs paid to the lessor during each of the years ended December 31, 2021 and 2020.
SCHEDULE I—CONDENSED FINANCIAL INFORMATION OF REGISTRANT
CHENIERE ENERGY, INC.
NOTES TO CONDENSED FINANCIAL STATEMENTS—CONTINUED
Future annual minimum lease payments for operating leases as of December 31, 2021 are as follows (in millions):
| | | | | |
| Years Ending December 31, | Operating Leases (1) |
| 2022 | $ | 8 | |
| 2023 | 8 | |
| 2024 | 7 | |
| 2025 | 6 | |
| 2026 | 6 | |
| Thereafter | 1 | |
| Total lease payments | 36 | |
| Less: Interest | (6) | |
| Present value of lease liabilities | $ | 30 | |
The following table shows the weighted-average remaining lease term (in years) and the weighted-average discount rate for our operating leases:
| | | | | | | | | | | |
| December 31, |
| 2021 | | 2020 |
| Weighted-average remaining lease term (in years) | 4.8 | | 5.7 |
| Weighted-average discount rate | 6.6% | | 6.6% |
The following table includes other quantitative information for our operating leases (in millions):
| | | | | | | | | | | |
| Year Ended December 31, |
| 2021 | | 2020 |
| Cash paid for amounts included in the measurement of lease liabilities: | | | |
| Operating cash flows from operating leases | $ | 7 | | | $ | 7 | |
| Right-of-use assets obtained in exchange for new operating lease liabilities | — | | | 5 | |
NOTE 5—STOCKHOLDERS’ EQUITY
On June 3, 2019, we announced that our Board authorized a three-year, $1.0 billion share repurchase program. On September 7, 2021, the Board authorized an increase in the share repurchase program to $1.0 billion, inclusive of any amounts remaining under the previous authorization as of December 31, 2021, for an additional three years beginning on October 1, 2021. The following table presents information with respect to repurchases of common stock during the years ended December 31, 2021 and 2020 (in millions, except per share data):
| | | | | | | | | | | | | | | | | |
| Year Ended December 31, |
| 2021 | | 2020 | | 2019 |
| Aggregate common stock repurchased | 0.1 | | | 2.9 | | | 4.0 | |
| Weighted average price paid per share | $ | 87.32 | | | $ | 53.88 | | | $ | 62.27 | |
| Total amount paid (in millions) | $ | 9 | | | $ | 155 | | | $ | 249 | |
As of December 31, 2021, we had up to $998 million of the share repurchase program available.
Dividends
During the year ended December 31, 2021, we declared and paid an inaugural quarterly dividend of $0.33 per common share. On January 25, 2022, we declared a quarterly dividend of $0.33 per common share that is payable on February 28, 2022 to shareholders of record as of February 7, 2022.
SCHEDULE I—CONDENSED FINANCIAL INFORMATION OF REGISTRANT
CHENIERE ENERGY, INC.
NOTES TO CONDENSED FINANCIAL STATEMENTS—CONTINUED
NOTE 6 —SUPPLEMENTAL CASH FLOW INFORMATION
The following table provides supplemental disclosure of cash flow information (in millions):
| | | | | | | | | | | | | | | | | | | | |
| | Year Ended December 31, |
| | 2021 | | 2020 | | 2019 |
| Cash paid during the period for interest, net of amounts capitalized | | $ | 130 | | | $ | 45 | | | $ | 36 | |
| Non-cash investing and financing activities: | | | | | | |
| Non-cash capital distributions (1) | | — | | | 79 | | | 490 | |
| | | | | | |
(1)Amounts represent undistributed equity income of affiliates.
SCHEDULE II—VALUATION AND QUALIFYING ACCOUNTS
(in millions)
| | | | | | | | | | | | | | | | | | | | | | | | | | | | | |
| Balance at beginning of period | | Charged to costs and expenses | | Charged to other accounts | | Deductions | | Balance at end of period |
| Year Ended December 31, 2021 | | | | | | | | | |
| Current expected credit losses on receivables and contract assets | $ | 7 | | | $ | 2 | | | $ | — | | | $ | — | | | $ | 9 | |
| Deferred tax asset valuation allowance | 190 | | | (127) | | | — | | | — | | | 63 | |
| | | | | | | | | |
| Year Ended December 31, 2020 | | | | | | | | | |
| Current expected credit losses on receivables and contract assets | $ | — | | | $ | 7 | | | $ | — | | | $ | — | | | $ | 7 | |
| Deferred tax asset valuation allowance | 196 | | | (6) | | | — | | | — | | | 190 | |
| | | | | | | | | |
| Year Ended December 31, 2019 | | | | | | | | | |
| Allowance for credit losses or doubtful accounts on receivables and contract assets | $ | 30 | | | $ | 16 | | | $ | — | | | $ | (46) | | | $ | — | |
| Deferred tax asset valuation allowance | 686 | | | (490) | | | — | | | — | | | 196 | |
ITEM 16. FORM 10-K SUMMARY
None.
Pursuant to the requirements of Section 13 or 15(d) of the Securities Exchange Act of 1934, the registrant has duly caused this report to be signed on its behalf by the undersigned, thereunto duly authorized.
| | | | | | | | | | | |
| | CHENIERE ENERGY, INC. |
| | (Registrant) |
| | | |
| | By: | /s/ Jack A. Fusco |
| | | Jack A. Fusco |
| | | President and Chief Executive Officer
(Principal Executive Officer) |
| | Date: | February 23, 2022 |
| | | |
| | | |
| | | |
| | | |
| | | |
| | | |
| | | |
| | | |
| | | |
| | | |
Pursuant to the requirements of the Securities Exchange Act of 1934, this report has been signed below by the following persons on behalf of the registrant and in the capacities and on the dates indicated.
| | | | | | | | |
| Signature | Title | Date |
| | |
| | |
| /s/ Jack A. Fusco | President and Chief Executive Officer and Director (Principal Executive Officer) | February 23, 2022 |
| Jack A. Fusco | |
| | |
| /s/ Zach Davis | Executive Vice President and Chief Financial Officer (Principal Financial Officer) | February 23, 2022 |
| Zach Davis | |
| | |
| /s/ Leonard E. Travis | Senior Vice President and Chief Accounting Officer
(Principal Accounting Officer) | February 23, 2022 |
| Leonard E. Travis | |
| | |
| /s/ G. Andrea Botta | Chairman of the Board | February 23, 2022 |
| G. Andrea Botta | | |
| | |
| /s/ Vicky A. Bailey | Director | February 23, 2022 |
| Vicky A. Bailey | | |
| | |
| | |
| | |
| | |
| /s/ Patricia K. Collawn | Director | February 23, 2022 |
| Patricia K. Collawn | | |
| | |
| /s/ David B. Kilpatrick | Director | February 23, 2022 |
| David B. Kilpatrick | | |
| | |
| /s/ Sean Klimczak | Director | February 23, 2022 |
| Sean Klimczak | | |
| | |
| /s/ Andrew Langham | Director | February 23, 2022 |
| Andrew Langham | | |
| | |
| /s/ Lorraine Mitchelmore | Director | February 23, 2022 |
| Lorraine Mitchelmore | | |
| | |
| /s/ Donald F. Robillard, Jr. | Director | February 23, 2022 |
| Donald F. Robillard, Jr. | | |
| | |
| /s/ Neal A. Shear | Director | February 23, 2022 |
| Neal A. Shear | | |
| | |
| /s/ Andrew Teno | Director | February 23, 2022 |
| Andrew Teno | | |