false--12-31Q120190000003570YesfalseLarge Accelerated FilerfalseP6M0.0820.70310.0300.0030.0034800000004800000002698000002704000002570000002574000000.01500.02500.00750.01750.00750.01750.00250.01250.00750.01750.01250.02250.00750.0175LIBOR or base rateLIBOR or base rateLIBOR or base rateLIBOR or base rateLIBOR or base rate0.00500.056250.06250.056250.0700000.05750.052500.058750.056250.056250.058750.051250.05000.0420.0550000000.2112500000001200000000.01200000000.05500000000.00010.000150000005000000001280000013000000
0000003570
2019-01-01
2019-03-31
0000003570
us-gaap:CommodityContractMember
2019-01-01
2019-03-31
0000003570
us-gaap:InterestRateContractMember
2019-01-01
2019-03-31
0000003570
us-gaap:ForeignExchangeContractMember
2019-01-01
2019-03-31
0000003570
2019-04-30
0000003570
2018-12-31
0000003570
2019-03-31
0000003570
2018-01-01
2018-03-31
0000003570
lng:LiquefiedNaturalGasMember
2019-01-01
2019-03-31
0000003570
lng:RegasificationServiceMember
2019-01-01
2019-03-31
0000003570
lng:ProductAndServiceOtherRelatedPartyMember
2019-01-01
2019-03-31
0000003570
lng:RegasificationServiceMember
2018-01-01
2018-03-31
0000003570
lng:ProductAndServiceOtherRelatedPartyMember
2018-01-01
2018-03-31
0000003570
us-gaap:ProductAndServiceOtherMember
2018-01-01
2018-03-31
0000003570
us-gaap:ProductAndServiceOtherMember
2019-01-01
2019-03-31
0000003570
lng:LiquefiedNaturalGasMember
2018-01-01
2018-03-31
0000003570
us-gaap:RetainedEarningsMember
2017-12-31
0000003570
us-gaap:TreasuryStockMember
2018-01-01
2018-03-31
0000003570
us-gaap:AdditionalPaidInCapitalMember
2018-01-01
2018-03-31
0000003570
us-gaap:CommonStockMember
2018-01-01
2018-03-31
0000003570
us-gaap:AdditionalPaidInCapitalMember
2017-12-31
0000003570
us-gaap:NoncontrollingInterestMember
2018-01-01
2018-03-31
0000003570
us-gaap:NoncontrollingInterestMember
2017-12-31
0000003570
us-gaap:RetainedEarningsMember
2018-03-31
0000003570
2018-03-31
0000003570
us-gaap:RetainedEarningsMember
2018-01-01
2018-03-31
0000003570
us-gaap:TreasuryStockMember
2018-03-31
0000003570
us-gaap:CommonStockMember
2017-12-31
0000003570
us-gaap:CommonStockMember
2018-03-31
0000003570
us-gaap:NoncontrollingInterestMember
2018-03-31
0000003570
us-gaap:AdditionalPaidInCapitalMember
2018-03-31
0000003570
us-gaap:TreasuryStockMember
2017-12-31
0000003570
2017-12-31
0000003570
us-gaap:NoncontrollingInterestMember
2019-01-01
2019-03-31
0000003570
us-gaap:CommonStockMember
2019-01-01
2019-03-31
0000003570
us-gaap:AdditionalPaidInCapitalMember
2019-01-01
2019-03-31
0000003570
us-gaap:RetainedEarningsMember
2019-03-31
0000003570
us-gaap:RetainedEarningsMember
2019-01-01
2019-03-31
0000003570
us-gaap:CommonStockMember
2018-12-31
0000003570
us-gaap:TreasuryStockMember
2019-01-01
2019-03-31
0000003570
us-gaap:CommonStockMember
2019-03-31
0000003570
us-gaap:NoncontrollingInterestMember
2018-12-31
0000003570
us-gaap:TreasuryStockMember
2019-03-31
0000003570
us-gaap:TreasuryStockMember
2018-12-31
0000003570
us-gaap:AdditionalPaidInCapitalMember
2018-12-31
0000003570
us-gaap:AdditionalPaidInCapitalMember
2019-03-31
0000003570
us-gaap:RetainedEarningsMember
2018-12-31
0000003570
us-gaap:NoncontrollingInterestMember
2019-03-31
0000003570
lng:CorpusChristiLNGTerminalExpansionMember
2019-01-01
2019-03-31
0000003570
lng:CheniereEnergyPartnersLPMember
lng:SabinePassLNGTerminalMember
2019-01-01
2019-03-31
0000003570
2019-01-01
0000003570
lng:Phase1Member
lng:CorpusChristiLNGTerminalMember
2019-01-01
2019-03-31
0000003570
lng:CorpusChristiPipelineMember
2019-01-01
2019-03-31
0000003570
lng:CorpusChristiLNGTerminalMember
2019-01-01
2019-03-31
0000003570
lng:CheniereCreoleTrailPipelineLPMember
2019-01-01
2019-03-31
0000003570
lng:Phase2Member
lng:CorpusChristiLNGTerminalMember
2019-01-01
2019-03-31
0000003570
lng:CQPAndCashHeldByGuarantorSubsidiariesMember
2018-12-31
0000003570
lng:CCLProjectMember
2018-12-31
0000003570
lng:SPLProjectMember
2019-03-31
0000003570
lng:SPLProjectMember
2018-12-31
0000003570
lng:SubsidiaryCashMember
2019-03-31
0000003570
lng:SubsidiaryCashMember
2018-12-31
0000003570
lng:CCLProjectMember
2019-03-31
0000003570
lng:CQPAndCashHeldByGuarantorSubsidiariesMember
2019-03-31
0000003570
lng:SabinePassLiquefactionMember
2018-12-31
0000003570
lng:SabinePassLiquefactionMember
2019-03-31
0000003570
lng:LiquefiedNaturalGasInventoryMember
2019-03-31
0000003570
lng:LiquefiedNaturalGasInTransitInventoryMember
2019-03-31
0000003570
lng:LiquefiedNaturalGasInTransitInventoryMember
2018-12-31
0000003570
lng:LiquefiedNaturalGasInventoryMember
2018-12-31
0000003570
lng:NaturalGasInventoryMember
2019-03-31
0000003570
lng:MaterialsAndOtherInventoryMember
2018-12-31
0000003570
lng:NaturalGasInventoryMember
2018-12-31
0000003570
lng:MaterialsAndOtherInventoryMember
2019-03-31
0000003570
lng:FixedAssetsMember
2018-12-31
0000003570
lng:FixedAssetsMember
2019-03-31
0000003570
us-gaap:FurnitureAndFixturesMember
2019-03-31
0000003570
us-gaap:LandMember
2019-03-31
0000003570
us-gaap:OfficeEquipmentMember
2019-03-31
0000003570
us-gaap:LandMember
2018-12-31
0000003570
us-gaap:LeaseholdImprovementsMember
2018-12-31
0000003570
lng:LngTerminalCostsMember
2018-12-31
0000003570
lng:LngSiteAndRelatedCostsNetMember
2019-03-31
0000003570
us-gaap:AssetsHeldUnderCapitalLeasesMember
2018-12-31
0000003570
us-gaap:ConstructionInProgressMember
2019-03-31
0000003570
us-gaap:ConstructionInProgressMember
2018-12-31
0000003570
lng:LngTerminalMember
2018-12-31
0000003570
us-gaap:AssetsHeldUnderCapitalLeasesMember
2019-03-31
0000003570
us-gaap:SoftwareAndSoftwareDevelopmentCostsMember
2018-12-31
0000003570
us-gaap:OtherCapitalizedPropertyPlantAndEquipmentMember
2019-03-31
0000003570
us-gaap:LeaseholdImprovementsMember
2019-03-31
0000003570
lng:LngTerminalCostsMember
2019-03-31
0000003570
us-gaap:SoftwareAndSoftwareDevelopmentCostsMember
2019-03-31
0000003570
lng:LngSiteAndRelatedCostsNetMember
2018-12-31
0000003570
us-gaap:OtherCapitalizedPropertyPlantAndEquipmentMember
2018-12-31
0000003570
us-gaap:FurnitureAndFixturesMember
2018-12-31
0000003570
lng:LngTerminalMember
2019-03-31
0000003570
us-gaap:OfficeEquipmentMember
2018-12-31
0000003570
lng:CCHInterestRateDerivativesMember
2019-01-01
2019-03-31
0000003570
srt:MaximumMember
lng:CCHInterestRateDerivativesMember
2019-03-31
0000003570
lng:CCHInterestRateDerivativesMember
2019-03-31
0000003570
lng:LNGTradingDerivativeMember
us-gaap:SalesMember
2019-01-01
2019-03-31
0000003570
us-gaap:PriceRiskDerivativeMember
us-gaap:SalesMember
2018-01-01
2018-03-31
0000003570
us-gaap:PriceRiskDerivativeMember
us-gaap:SalesMember
2019-01-01
2019-03-31
0000003570
lng:LNGTradingDerivativeMember
us-gaap:SalesMember
2018-01-01
2018-03-31
0000003570
us-gaap:PriceRiskDerivativeMember
us-gaap:CostOfSalesMember
2019-01-01
2019-03-31
0000003570
us-gaap:PriceRiskDerivativeMember
us-gaap:CostOfSalesMember
2018-01-01
2018-03-31
0000003570
lng:PhysicalLiquefactionSupplyDerivativesMember
us-gaap:FairValueInputsLevel3Member
2019-03-31
0000003570
lng:PhysicalLiquefactionSupplyDerivativesMember
2019-01-01
2019-03-31
0000003570
lng:PhysicalLiquefactionSupplyDerivativesMember
2018-01-01
2018-03-31
0000003570
lng:PhysicalLiquefactionSupplyDerivativesMember
2018-03-31
0000003570
lng:PhysicalLiquefactionSupplyDerivativesMember
2019-03-31
0000003570
lng:PhysicalLiquefactionSupplyDerivativesMember
2018-12-31
0000003570
lng:PhysicalLiquefactionSupplyDerivativesMember
2017-12-31
0000003570
lng:NoncurrentDerivativeLiabilitiesMember
lng:LNGTradingDerivativeMember
2018-12-31
0000003570
us-gaap:PriceRiskDerivativeMember
2019-03-31
0000003570
lng:LNGTradingDerivativeMember
2019-03-31
0000003570
us-gaap:PriceRiskDerivativeMember
2018-12-31
0000003570
lng:NoncurrentDerivativeLiabilitiesMember
us-gaap:PriceRiskDerivativeMember
2019-03-31
0000003570
lng:NoncurrentDerivativeAssetsMember
us-gaap:PriceRiskDerivativeMember
2018-12-31
0000003570
us-gaap:DerivativeFinancialInstrumentsLiabilitiesMember
us-gaap:CommodityContractMember
2018-12-31
0000003570
us-gaap:DerivativeFinancialInstrumentsLiabilitiesMember
lng:LNGTradingDerivativeMember
2019-03-31
0000003570
lng:LNGTradingDerivativeMember
2018-12-31
0000003570
us-gaap:DerivativeFinancialInstrumentsAssetsMember
us-gaap:PriceRiskDerivativeMember
2019-03-31
0000003570
us-gaap:DerivativeFinancialInstrumentsLiabilitiesMember
us-gaap:PriceRiskDerivativeMember
2019-03-31
0000003570
us-gaap:DerivativeFinancialInstrumentsAssetsMember
lng:LNGTradingDerivativeMember
2018-12-31
0000003570
us-gaap:CommodityContractMember
2018-12-31
0000003570
lng:NoncurrentDerivativeAssetsMember
us-gaap:PriceRiskDerivativeMember
2019-03-31
0000003570
us-gaap:DerivativeFinancialInstrumentsLiabilitiesMember
us-gaap:PriceRiskDerivativeMember
2018-12-31
0000003570
us-gaap:CommodityContractMember
2019-03-31
0000003570
lng:NoncurrentDerivativeLiabilitiesMember
us-gaap:CommodityContractMember
2019-03-31
0000003570
lng:NoncurrentDerivativeLiabilitiesMember
us-gaap:PriceRiskDerivativeMember
2018-12-31
0000003570
us-gaap:DerivativeFinancialInstrumentsLiabilitiesMember
lng:LNGTradingDerivativeMember
2018-12-31
0000003570
lng:NoncurrentDerivativeLiabilitiesMember
lng:LNGTradingDerivativeMember
2019-03-31
0000003570
lng:NoncurrentDerivativeAssetsMember
lng:LNGTradingDerivativeMember
2019-03-31
0000003570
us-gaap:DerivativeFinancialInstrumentsAssetsMember
us-gaap:CommodityContractMember
2018-12-31
0000003570
lng:NoncurrentDerivativeAssetsMember
us-gaap:CommodityContractMember
2018-12-31
0000003570
lng:NoncurrentDerivativeLiabilitiesMember
us-gaap:CommodityContractMember
2018-12-31
0000003570
lng:NoncurrentDerivativeAssetsMember
us-gaap:CommodityContractMember
2019-03-31
0000003570
us-gaap:DerivativeFinancialInstrumentsAssetsMember
lng:LNGTradingDerivativeMember
2019-03-31
0000003570
us-gaap:DerivativeFinancialInstrumentsAssetsMember
us-gaap:PriceRiskDerivativeMember
2018-12-31
0000003570
us-gaap:DerivativeFinancialInstrumentsLiabilitiesMember
us-gaap:CommodityContractMember
2019-03-31
0000003570
lng:NoncurrentDerivativeAssetsMember
lng:LNGTradingDerivativeMember
2018-12-31
0000003570
us-gaap:DerivativeFinancialInstrumentsAssetsMember
us-gaap:CommodityContractMember
2019-03-31
0000003570
us-gaap:ForeignExchangeContractMember
2018-12-31
0000003570
lng:CorpusChristiLiquefactionMember
lng:NaturalGasSupplyAgreementMember
2019-01-01
2019-03-31
0000003570
us-gaap:ForeignExchangeContractMember
2019-03-31
0000003570
lng:CorpusChristiLiquefactionMember
srt:MaximumMember
2018-12-31
0000003570
srt:MaximumMember
lng:PhysicalLiquefactionSupplyDerivativesMember
2019-01-01
2019-03-31
0000003570
lng:CorpusChristiLiquefactionMember
lng:NaturalGasSupplyAgreementMember
2018-12-31
0000003570
lng:SabinePassLiquefactionMember
srt:MaximumMember
2018-12-31
0000003570
lng:SabinePassLiquefactionMember
srt:MaximumMember
2019-03-31
0000003570
lng:CorpusChristiLiquefactionMember
srt:MaximumMember
2019-03-31
0000003570
us-gaap:DerivativeFinancialInstrumentsLiabilitiesMember
us-gaap:ForeignExchangeContractMember
2018-12-31
0000003570
us-gaap:DerivativeFinancialInstrumentsLiabilitiesMember
us-gaap:ForeignExchangeContractMember
2019-03-31
0000003570
us-gaap:DerivativeFinancialInstrumentsAssetsMember
us-gaap:ForeignExchangeContractMember
2018-12-31
0000003570
us-gaap:DerivativeFinancialInstrumentsAssetsMember
us-gaap:ForeignExchangeContractMember
2019-03-31
0000003570
us-gaap:PriceRiskDerivativeMember
us-gaap:FairValueInputsLevel1Member
2019-03-31
0000003570
lng:CCHInterestRateDerivativesMember
us-gaap:FairValueInputsLevel3Member
2019-03-31
0000003570
lng:LNGTradingDerivativeMember
us-gaap:FairValueInputsLevel2Member
2019-03-31
0000003570
us-gaap:PriceRiskDerivativeMember
us-gaap:FairValueInputsLevel2Member
2019-03-31
0000003570
us-gaap:PriceRiskDerivativeMember
us-gaap:FairValueInputsLevel3Member
2018-12-31
0000003570
us-gaap:PriceRiskDerivativeMember
us-gaap:FairValueInputsLevel2Member
2018-12-31
0000003570
lng:CCHInterestRateDerivativesMember
us-gaap:FairValueInputsLevel2Member
2019-03-31
0000003570
lng:LNGTradingDerivativeMember
us-gaap:FairValueInputsLevel2Member
2018-12-31
0000003570
lng:LNGTradingDerivativeMember
us-gaap:FairValueInputsLevel3Member
2018-12-31
0000003570
us-gaap:PriceRiskDerivativeMember
us-gaap:FairValueInputsLevel3Member
2019-03-31
0000003570
lng:CCHInterestRateDerivativesMember
2018-12-31
0000003570
lng:CCHInterestRateDerivativesMember
us-gaap:FairValueInputsLevel1Member
2018-12-31
0000003570
us-gaap:ForeignExchangeContractMember
us-gaap:FairValueInputsLevel2Member
2018-12-31
0000003570
us-gaap:PriceRiskDerivativeMember
us-gaap:FairValueInputsLevel1Member
2018-12-31
0000003570
us-gaap:ForeignExchangeContractMember
us-gaap:FairValueInputsLevel3Member
2018-12-31
0000003570
lng:CCHInterestRateDerivativesMember
us-gaap:FairValueInputsLevel2Member
2018-12-31
0000003570
lng:LNGTradingDerivativeMember
us-gaap:FairValueInputsLevel3Member
2019-03-31
0000003570
lng:CCHInterestRateDerivativesMember
us-gaap:FairValueInputsLevel1Member
2019-03-31
0000003570
us-gaap:ForeignExchangeContractMember
us-gaap:FairValueInputsLevel2Member
2019-03-31
0000003570
us-gaap:ForeignExchangeContractMember
us-gaap:FairValueInputsLevel3Member
2019-03-31
0000003570
lng:CCHInterestRateDerivativesMember
us-gaap:FairValueInputsLevel3Member
2018-12-31
0000003570
us-gaap:ForeignExchangeContractMember
us-gaap:FairValueInputsLevel1Member
2018-12-31
0000003570
us-gaap:ForeignExchangeContractMember
us-gaap:FairValueInputsLevel1Member
2019-03-31
0000003570
lng:LNGTradingDerivativeMember
us-gaap:FairValueInputsLevel1Member
2018-12-31
0000003570
lng:LNGTradingDerivativeMember
us-gaap:FairValueInputsLevel1Member
2019-03-31
0000003570
lng:CCHInterestRateDerivativesMember
us-gaap:GainLossOnDerivativeInstrumentsMember
2018-01-01
2018-03-31
0000003570
lng:CCHInterestRateDerivativesMember
us-gaap:GainLossOnDerivativeInstrumentsMember
2019-01-01
2019-03-31
0000003570
lng:CQPInterestRateDerivativesMember
us-gaap:GainLossOnDerivativeInstrumentsMember
2019-01-01
2019-03-31
0000003570
lng:CQPInterestRateDerivativesMember
us-gaap:GainLossOnDerivativeInstrumentsMember
2018-01-01
2018-03-31
0000003570
lng:PriceRiskDerivativeAssetMember
2019-03-31
0000003570
lng:CCHInterestRateDerivativeAssetMember
2019-03-31
0000003570
lng:LNGTradingDerivativeAssetMember
2019-03-31
0000003570
lng:PriceRiskDerivativeLiabilityMember
2018-12-31
0000003570
lng:ForeignExchangeContractLiabilityMember
2018-12-31
0000003570
lng:PriceRiskDerivativeAssetMember
2018-12-31
0000003570
lng:PriceRiskDerivativeLiabilityMember
2019-03-31
0000003570
lng:CCHInterestRateDerivativeAssetMember
2018-12-31
0000003570
lng:ForeignExchangeContractAssetMember
2018-12-31
0000003570
lng:CCHInterestRateDerivativeLiabilityMember
2019-03-31
0000003570
lng:LNGTradingDerivativesLiabilityMember
2019-03-31
0000003570
lng:ForeignExchangeContractAssetMember
2019-03-31
0000003570
lng:LNGTradingDerivativeAssetMember
2018-12-31
0000003570
lng:ForeignExchangeContractLiabilityMember
2019-03-31
0000003570
lng:LNGTradingDerivativesLiabilityMember
2018-12-31
0000003570
lng:NoncurrentDerivativeAssetsMember
lng:CCHInterestRateDerivativesMember
2018-12-31
0000003570
us-gaap:DerivativeFinancialInstrumentsAssetsMember
lng:CCHInterestRateDerivativesMember
2018-12-31
0000003570
lng:NoncurrentDerivativeLiabilitiesMember
lng:CCHInterestRateDerivativesMember
2018-12-31
0000003570
lng:NoncurrentDerivativeLiabilitiesMember
lng:CCHInterestRateDerivativesMember
2019-03-31
0000003570
lng:NoncurrentDerivativeAssetsMember
lng:CCHInterestRateDerivativesMember
2019-03-31
0000003570
us-gaap:DerivativeFinancialInstrumentsAssetsMember
lng:CCHInterestRateDerivativesMember
2019-03-31
0000003570
us-gaap:ForeignExchangeContractMember
us-gaap:SalesMember
2018-01-01
2018-03-31
0000003570
us-gaap:ForeignExchangeContractMember
us-gaap:SalesMember
2019-01-01
2019-03-31
0000003570
srt:MinimumMember
lng:PhysicalLiquefactionSupplyDerivativesMember
us-gaap:FairValueInputsLevel3Member
2019-01-01
2019-03-31
0000003570
srt:MaximumMember
lng:PhysicalLiquefactionSupplyDerivativesMember
us-gaap:FairValueInputsLevel3Member
2019-01-01
2019-03-31
0000003570
lng:CheniereLNGOMServicesLLCMember
us-gaap:ServiceAgreementsMember
lng:MidshipPipelineMember
2019-03-31
0000003570
lng:CheniereLNGOMServicesLLCMember
us-gaap:ServiceAgreementsMember
lng:MidshipPipelineMember
2018-12-31
0000003570
lng:MidshipHoldingsLLCMember
2019-03-31
0000003570
lng:CheniereLNGOMServicesLLCMember
us-gaap:ServiceAgreementsMember
lng:MidshipPipelineMember
2018-01-01
2018-03-31
0000003570
lng:MidshipPipelineMember
2019-01-01
2019-03-31
0000003570
lng:CheniereLNGOMServicesLLCMember
us-gaap:ServiceAgreementsMember
lng:MidshipPipelineMember
2019-01-01
2019-03-31
0000003570
lng:MidshipPipelineMember
lng:MidshipPipelineLetterofCreditMember
lng:CorpusChristiLiquefactionMember
2019-03-31
0000003570
lng:CorpusChristiLiquefactionMember
lng:NaturalGasTransportationAgreementMember
lng:MidshipPipelineMember
2019-01-01
2019-03-31
0000003570
lng:MidshipHoldingsLLCMember
2018-12-31
0000003570
lng:MidshipPipelineMember
lng:MidshipPipelineLetterofCreditMember
lng:CorpusChristiLiquefactionMember
2018-05-31
0000003570
lng:CheniereEnergyPartnersLPMember
2019-01-01
2019-03-31
0000003570
lng:CheniereEnergyPartnersLPMember
lng:SubordinatedUnitsMember
2019-03-31
0000003570
lng:CheniereEnergyPartnersLPMember
lng:CommonUnitsMember
2019-03-31
0000003570
lng:DebtExcludingCapitalLeaseAndConvertibleDebtMember
2019-01-01
2019-03-31
0000003570
us-gaap:ConvertibleDebtMember
2018-01-01
2018-03-31
0000003570
us-gaap:ConvertibleDebtMember
2019-01-01
2019-03-31
0000003570
lng:DebtExcludingCapitalLeaseAndConvertibleDebtMember
2018-01-01
2018-03-31
0000003570
lng:NoteHoldersMember
lng:A2021ConvertibleUnsecuredNotesMember
2019-03-31
0000003570
lng:NoteHoldersMember
lng:A2025ConvertibleSeniorNotesMember
2019-01-01
2019-03-31
0000003570
lng:CheniereCCHHoldcoIILLCMember
lng:A2025ConvertibleSeniorNotesMember
2019-01-01
2019-03-31
0000003570
lng:NoteHoldersMember
lng:A2045ConvertibleSeniorNotesMember
2019-03-31
0000003570
lng:NoteHoldersMember
lng:A2025ConvertibleSeniorNotesMember
2019-03-31
0000003570
lng:NoteHoldersMember
lng:A2045ConvertibleSeniorNotesMember
2019-01-01
2019-03-31
0000003570
lng:CheniereCCHHoldcoIILLCMember
lng:A2025ConvertibleSeniorNotesMember
2019-03-31
0000003570
lng:A2025ConvertibleSeniorNotesMember
2019-03-31
0000003570
lng:A2025ConvertibleSeniorNotesMember
2019-01-01
2019-03-31
0000003570
lng:A2045ConvertibleSeniorNotesMember
2019-03-31
0000003570
lng:A2021ConvertibleUnsecuredNotesMember
2019-01-01
2019-03-31
0000003570
lng:A2021ConvertibleUnsecuredNotesMember
2019-03-31
0000003570
lng:A2045ConvertibleSeniorNotesMember
2019-01-01
2019-03-31
0000003570
lng:A2024CorpusChristiHoldingsSeniorNotesMember
2018-12-31
0000003570
lng:A2022SabinePassLiquefactionSeniorNotesMember
2018-12-31
0000003570
lng:A2037SabinePassLiquefactionNotesMember
2019-03-31
0000003570
lng:A2025CorpusChristiHoldingsSeniorNotesMember
2018-12-31
0000003570
lng:A2028SabinePassLiquefactionSeniorNotesMember
2019-03-31
0000003570
lng:A2027CorpusChristiHoldingsSeniorNotesMember
2018-12-31
0000003570
lng:A2028SabinePassLiquefactionSeniorNotesMember
2018-12-31
0000003570
lng:A2021SabinePassLiquefactionSeniorNotesMember
2018-12-31
0000003570
lng:A2025ConvertibleSeniorNotesMember
2018-12-31
0000003570
lng:A2026SabinePassLiquefactionSeniorNotesMember
2019-03-31
0000003570
lng:A2015CCHTermLoanFacilityMember
2018-12-31
0000003570
lng:A2021ConvertibleUnsecuredNotesMember
2018-12-31
0000003570
lng:WorkingCapitalFacilityMember
2019-03-31
0000003570
lng:A2025CorpusChristiHoldingsSeniorNotesMember
2019-03-31
0000003570
lng:WorkingCapitalFacilityMember
2018-12-31
0000003570
lng:A2015CCHTermLoanFacilityMember
2019-03-31
0000003570
lng:CorpusChristiHoldingsWorkingCapitalFacilityMember
2019-03-31
0000003570
lng:A2037SabinePassLiquefactionNotesMember
2018-12-31
0000003570
lng:A2027CorpusChristiHoldingsSeniorNotesMember
2019-03-31
0000003570
lng:A2025SabinePassLiquefactionSeniorNotesMember
2019-03-31
0000003570
lng:CheniereRevolvingCreditFacilityMember
2018-12-31
0000003570
lng:A2026SabinePassLiquefactionSeniorNotesMember
2018-12-31
0000003570
lng:A2025SabinePassLiquefactionSeniorNotesMember
2018-12-31
0000003570
lng:A2027SabinePassLiquefactionSeniorNotesMember
2019-03-31
0000003570
lng:A2024CorpusChristiHoldingsSeniorNotesMember
2019-03-31
0000003570
lng:A2021SabinePassLiquefactionSeniorNotesMember
2019-03-31
0000003570
lng:CheniereRevolvingCreditFacilityMember
2019-03-31
0000003570
lng:CorpusChristiHoldingsWorkingCapitalFacilityMember
2018-12-31
0000003570
lng:A2022SabinePassLiquefactionSeniorNotesMember
2019-03-31
0000003570
lng:A2024SabinePassLiquefactionSeniorNotesMember
2019-03-31
0000003570
lng:A2023SabinePassLiquefactionSeniorNotesMember
2018-12-31
0000003570
lng:A2024SabinePassLiquefactionSeniorNotesMember
2018-12-31
0000003570
lng:A2045ConvertibleSeniorNotesMember
2018-12-31
0000003570
lng:A2016CQPCreditFacilitiesMember
2019-03-31
0000003570
lng:A2027SabinePassLiquefactionSeniorNotesMember
2018-12-31
0000003570
lng:A2016CQPCreditFacilitiesMember
2018-12-31
0000003570
lng:A2023SabinePassLiquefactionSeniorNotesMember
2019-03-31
0000003570
lng:A2015CCHTermLoanFacilityMember
2019-01-01
2019-03-31
0000003570
lng:WorkingCapitalFacilityMember
2019-01-01
2019-03-31
0000003570
lng:CorpusChristiHoldingsWorkingCapitalFacilityMember
2019-01-01
2019-03-31
0000003570
lng:CheniereRevolvingCreditFacilityMember
2019-01-01
2019-03-31
0000003570
lng:A2016CQPCreditFacilitiesMember
2019-01-01
2019-03-31
0000003570
lng:A2025ConvertibleSeniorNotesMember
us-gaap:EstimateOfFairValueFairValueDisclosureMember
2019-03-31
0000003570
lng:A2021ConvertibleUnsecuredNotesMember
us-gaap:CarryingReportedAmountFairValueDisclosureMember
2019-03-31
0000003570
lng:A2025ConvertibleSeniorNotesMember
us-gaap:EstimateOfFairValueFairValueDisclosureMember
2018-12-31
0000003570
us-gaap:LineOfCreditMember
us-gaap:EstimateOfFairValueFairValueDisclosureMember
2019-03-31
0000003570
us-gaap:LineOfCreditMember
us-gaap:CarryingReportedAmountFairValueDisclosureMember
2019-03-31
0000003570
lng:A2037SabinePassLiquefactionNotesMember
us-gaap:EstimateOfFairValueFairValueDisclosureMember
2018-12-31
0000003570
us-gaap:SeniorNotesMember
us-gaap:CarryingReportedAmountFairValueDisclosureMember
2018-12-31
0000003570
lng:A2037SabinePassLiquefactionNotesMember
us-gaap:CarryingReportedAmountFairValueDisclosureMember
2019-03-31
0000003570
lng:A2021ConvertibleUnsecuredNotesMember
us-gaap:EstimateOfFairValueFairValueDisclosureMember
2019-03-31
0000003570
us-gaap:LineOfCreditMember
us-gaap:CarryingReportedAmountFairValueDisclosureMember
2018-12-31
0000003570
lng:A2037SabinePassLiquefactionNotesMember
us-gaap:EstimateOfFairValueFairValueDisclosureMember
2019-03-31
0000003570
lng:A2025ConvertibleSeniorNotesMember
us-gaap:CarryingReportedAmountFairValueDisclosureMember
2019-03-31
0000003570
lng:A2021ConvertibleUnsecuredNotesMember
us-gaap:CarryingReportedAmountFairValueDisclosureMember
2018-12-31
0000003570
lng:A2045ConvertibleSeniorNotesMember
us-gaap:EstimateOfFairValueFairValueDisclosureMember
2019-03-31
0000003570
lng:A2045ConvertibleSeniorNotesMember
us-gaap:CarryingReportedAmountFairValueDisclosureMember
2018-12-31
0000003570
us-gaap:SeniorNotesMember
us-gaap:EstimateOfFairValueFairValueDisclosureMember
2018-12-31
0000003570
lng:A2045ConvertibleSeniorNotesMember
us-gaap:EstimateOfFairValueFairValueDisclosureMember
2018-12-31
0000003570
us-gaap:SeniorNotesMember
us-gaap:EstimateOfFairValueFairValueDisclosureMember
2019-03-31
0000003570
lng:A2045ConvertibleSeniorNotesMember
us-gaap:CarryingReportedAmountFairValueDisclosureMember
2019-03-31
0000003570
us-gaap:LineOfCreditMember
us-gaap:EstimateOfFairValueFairValueDisclosureMember
2018-12-31
0000003570
us-gaap:SeniorNotesMember
us-gaap:CarryingReportedAmountFairValueDisclosureMember
2019-03-31
0000003570
lng:A2021ConvertibleUnsecuredNotesMember
us-gaap:EstimateOfFairValueFairValueDisclosureMember
2018-12-31
0000003570
lng:A2025ConvertibleSeniorNotesMember
us-gaap:CarryingReportedAmountFairValueDisclosureMember
2018-12-31
0000003570
lng:A2037SabinePassLiquefactionNotesMember
us-gaap:CarryingReportedAmountFairValueDisclosureMember
2018-12-31
0000003570
lng:February252019Member
lng:A2016CQPCreditFacilitiesMember
2019-01-01
2019-03-31
0000003570
lng:A2015CCHTermLoanFacilityMember
us-gaap:LondonInterbankOfferedRateLIBORMember
2019-01-01
2019-03-31
0000003570
srt:MinimumMember
lng:CheniereRevolvingCreditFacilityMember
us-gaap:LondonInterbankOfferedRateLIBORMember
2019-01-01
2019-03-31
0000003570
lng:WorkingCapitalFacilityMember
us-gaap:LondonInterbankOfferedRateLIBORMember
2019-01-01
2019-03-31
0000003570
srt:MaximumMember
lng:CheniereRevolvingCreditFacilityMember
us-gaap:LondonInterbankOfferedRateLIBORMember
2019-01-01
2019-03-31
0000003570
lng:A2015CCHTermLoanFacilityMember
us-gaap:BaseRateMember
2019-01-01
2019-03-31
0000003570
lng:WorkingCapitalFacilityMember
us-gaap:BaseRateMember
2019-01-01
2019-03-31
0000003570
srt:MinimumMember
lng:CorpusChristiHoldingsWorkingCapitalFacilityMember
us-gaap:BaseRateMember
2019-01-01
2019-03-31
0000003570
srt:MaximumMember
lng:CorpusChristiHoldingsWorkingCapitalFacilityMember
us-gaap:BaseRateMember
2019-01-01
2019-03-31
0000003570
lng:A2016CQPCreditFacilitiesMember
us-gaap:BaseRateMember
2019-01-01
2019-03-31
0000003570
srt:MaximumMember
lng:CorpusChristiHoldingsWorkingCapitalFacilityMember
us-gaap:LondonInterbankOfferedRateLIBORMember
2019-01-01
2019-03-31
0000003570
srt:MinimumMember
lng:CheniereRevolvingCreditFacilityMember
us-gaap:BaseRateMember
2019-01-01
2019-03-31
0000003570
lng:A2016CQPCreditFacilitiesMember
us-gaap:LondonInterbankOfferedRateLIBORMember
2019-01-01
2019-03-31
0000003570
srt:MinimumMember
lng:CorpusChristiHoldingsWorkingCapitalFacilityMember
us-gaap:LondonInterbankOfferedRateLIBORMember
2019-01-01
2019-03-31
0000003570
srt:MaximumMember
lng:CheniereRevolvingCreditFacilityMember
us-gaap:BaseRateMember
2019-01-01
2019-03-31
0000003570
lng:OperatingLeaseAssetsMember
2019-03-31
0000003570
lng:CurrentOperatingLeaseLiabilitiesMember
2019-03-31
0000003570
us-gaap:OtherNoncurrentLiabilitiesMember
2019-03-31
0000003570
us-gaap:PropertyPlantAndEquipmentMember
2019-03-31
0000003570
us-gaap:OtherCurrentLiabilitiesMember
2019-03-31
0000003570
lng:NonCurrentOperatingLeaseLiabilitiesMember
2019-03-31
0000003570
srt:MaximumMember
2019-03-31
0000003570
us-gaap:OperatingExpenseMember
2019-01-01
2019-03-31
0000003570
lng:DepreciationandAmortizationExpenseMember
2019-01-01
2019-03-31
0000003570
us-gaap:InterestExpenseMember
2019-01-01
2019-03-31
0000003570
lng:LiquefiedNaturalGasMember
2019-03-31
0000003570
lng:RegasificationServiceMember
2018-12-31
0000003570
lng:LiquefiedNaturalGasMember
2018-12-31
0000003570
lng:RegasificationServiceMember
2019-03-31
0000003570
lng:DerivativesandothersourcesMember
2019-01-01
2019-03-31
0000003570
lng:DerivativesandothersourcesMember
2018-01-01
2018-03-31
0000003570
lng:LiabilityAwardsMember
2019-01-01
2019-03-31
0000003570
lng:EquityAwardsMember
2018-01-01
2018-03-31
0000003570
lng:LiabilityAwardsMember
2018-01-01
2018-03-31
0000003570
lng:EquityAwardsMember
2019-01-01
2019-03-31
0000003570
srt:MaximumMember
us-gaap:PerformanceSharesMember
lng:A2011IncentivePlanMember
2019-01-01
2019-03-31
0000003570
srt:MinimumMember
us-gaap:PerformanceSharesMember
lng:A2011IncentivePlanMember
2019-01-01
2019-03-31
0000003570
us-gaap:PerformanceSharesMember
lng:A2011IncentivePlanMember
2019-01-01
2019-03-31
0000003570
us-gaap:RestrictedStockUnitsRSUMember
lng:A2011IncentivePlanMember
2019-01-01
2019-03-31
0000003570
lng:StockOptionsWarrantsAndUnvestedStockMember
2018-01-01
2018-03-31
0000003570
lng:A2021CheniereConvertibleNotesAnd2045CheniereConvertibleNotesMember
2019-01-01
2019-03-31
0000003570
lng:StockOptionsWarrantsAndUnvestedStockMember
2019-01-01
2019-03-31
0000003570
lng:A2021CheniereConvertibleNotesAnd2045CheniereConvertibleNotesMember
2018-01-01
2018-03-31
0000003570
lng:RestrictedStockWithUnsatisfiedPerformanceConditionsMember
2019-01-01
2019-03-31
0000003570
lng:RestrictedStockWithUnsatisfiedPerformanceConditionsMember
2018-01-01
2018-03-31
0000003570
lng:A2025ConvertibleSeniorNotesMember
2019-01-01
2019-03-31
0000003570
lng:A2025ConvertibleSeniorNotesMember
2018-01-01
2018-03-31
0000003570
lng:CheniereLNGTerminalsLLCMember
lng:ParallaxEnterprisesMember
2016-03-11
2016-03-11
0000003570
lng:CheniereLNGTerminalsLLCMember
lng:ParallaxEnterprisesMember
2015-12-31
0000003570
lng:CustomerAMember
us-gaap:AccountsReceivableMember
2019-01-01
2019-03-31
0000003570
lng:CustomerBMember
us-gaap:SalesRevenueNetMember
2018-01-01
2018-03-31
0000003570
lng:CustomerCMember
us-gaap:AccountsReceivableMember
2019-01-01
2019-03-31
0000003570
lng:CustomerAMember
us-gaap:SalesRevenueNetMember
2018-01-01
2018-03-31
0000003570
lng:CustomerBMember
us-gaap:AccountsReceivableMember
2019-01-01
2019-03-31
0000003570
lng:CustomerFMember
us-gaap:AccountsReceivableMember
2018-01-01
2018-12-31
0000003570
lng:CustomerEMember
us-gaap:AccountsReceivableMember
2018-01-01
2018-12-31
0000003570
lng:CustomerEMember
us-gaap:SalesRevenueNetMember
2018-01-01
2018-03-31
0000003570
lng:CustomerAMember
us-gaap:AccountsReceivableMember
2018-01-01
2018-12-31
0000003570
lng:CustomerBMember
us-gaap:AccountsReceivableMember
2018-01-01
2018-12-31
0000003570
lng:CustomerAMember
us-gaap:SalesRevenueNetMember
2019-01-01
2019-03-31
0000003570
lng:CustomerDMember
us-gaap:SalesRevenueNetMember
2019-01-01
2019-03-31
0000003570
lng:CustomerBMember
us-gaap:SalesRevenueNetMember
2019-01-01
2019-03-31
0000003570
lng:CustomerEMember
us-gaap:AccountsReceivableMember
2019-01-01
2019-03-31
0000003570
lng:CustomerCMember
us-gaap:AccountsReceivableMember
2018-01-01
2018-12-31
0000003570
lng:CustomerCMember
us-gaap:SalesRevenueNetMember
2018-01-01
2018-03-31
0000003570
lng:CustomerCMember
us-gaap:SalesRevenueNetMember
2019-01-01
2019-03-31
lng:unit
xbrli:shares
utreg:D
iso4217:USD
lng:tbtu
utreg:mi
lng:item
lng:milliontonnes
utreg:Y
lng:trains
iso4217:USD
xbrli:shares
xbrli:pure
utreg:Rate
UNITED STATES
SECURITIES AND EXCHANGE COMMISSION
Washington, D.C. 20549
FORM 10-Q
x QUARTERLY REPORT PURSUANT TO SECTION 13 OR 15(d) OF THE SECURITIES EXCHANGE ACT OF 1934
For the quarterly period ended March 31, 2019
or
¨ TRANSITION REPORT PURSUANT TO SECTION 13 OR 15(d) OF THE SECURITIES EXCHANGE ACT OF 1934
For the transition period from to
Commission file number 001-16383
CHENIERE ENERGY, INC.
(Exact name of registrant as specified in its charter)
|
| |
Delaware | 95-4352386 |
(State or other jurisdiction of incorporation or organization) | (I.R.S. Employer Identification No.) |
| |
700 Milam Street, Suite 1900 | |
Houston, Texas | 77002 |
(Address of principal executive offices) | (Zip Code) |
(713) 375-5000
(Registrant’s telephone number, including area code)
Indicate by check mark whether the registrant (1) has filed all reports required to be filed by Section 13 or 15(d) of the Securities Exchange Act of 1934 during the preceding 12 months (or for such shorter period that the registrant was required to file such reports), and (2) has been subject to such filing requirements for the past 90 days. Yes x No ¨
Indicate by check mark whether the registrant has submitted electronically every Interactive Data File required to be submitted pursuant to Rule 405 of Regulation S-T (§232.405 of this chapter) during the preceding 12 months (or for such shorter period that the registrant was required to submit such files). Yes x No ¨
Indicate by check mark whether the registrant is a large accelerated filer, an accelerated filer, a non-accelerated filer, a smaller reporting company, or an emerging growth company. See the definitions of “large accelerated filer,” “accelerated filer,” “smaller reporting company” and “emerging growth company” in Rule 12b-2 of the Exchange Act.
|
| |
Large accelerated filer x | Accelerated filer o |
Non-accelerated filer o | Smaller reporting company o |
| Emerging growth company o |
If an emerging growth company, indicate by check mark if the registrant has elected not to use the extended transition period for complying with any new or revised financial accounting standards provided pursuant to Section 13(a) of the Exchange Act. o
Indicate by check mark whether the registrant is a shell company (as defined in Rule 12b-2 of the Exchange Act). Yes o No x
Securities registered pursuant to Section 12(b) of the Act:
|
| | |
Title of each class | Trading Symbol | Name of each exchange on which registered |
Common Stock, $ 0.003 par value | LNG | NYSE American |
As of April 30, 2019, the issuer had 257,414,024 shares of Common Stock outstanding.
CHENIERE ENERGY, INC.
TABLE OF CONTENTS
DEFINITIONS
As used in this quarterly report, the terms listed below have the following meanings:
Common Industry and Other Terms
|
| | |
Bcf | | billion cubic feet |
Bcf/d | | billion cubic feet per day |
Bcf/yr | | billion cubic feet per year |
Bcfe | | billion cubic feet equivalent |
DOE | | U.S. Department of Energy |
EPC | | engineering, procurement and construction |
FERC | | Federal Energy Regulatory Commission |
FTA countries | | countries with which the United States has a free trade agreement providing for national treatment for trade in natural gas |
GAAP | | generally accepted accounting principles in the United States |
Henry Hub | | the final settlement price (in USD per MMBtu) for the New York Mercantile Exchange’s Henry Hub natural gas futures contract for the month in which a relevant cargo’s delivery window is scheduled to begin |
LIBOR | | London Interbank Offered Rate |
LNG | | liquefied natural gas, a product of natural gas that, through a refrigeration process, has been cooled to a liquid state, which occupies a volume that is approximately 1/600th of its gaseous state |
MMBtu | | million British thermal units, an energy unit |
mtpa | | million tonnes per annum |
non-FTA countries | | countries with which the United States does not have a free trade agreement providing for national treatment for trade in natural gas and with which trade is permitted |
SEC | | U.S. Securities and Exchange Commission |
SPA | | LNG sale and purchase agreement |
TBtu | | trillion British thermal units, an energy unit |
Train | | an industrial facility comprised of a series of refrigerant compressor loops used to cool natural gas into LNG |
TUA | | terminal use agreement |
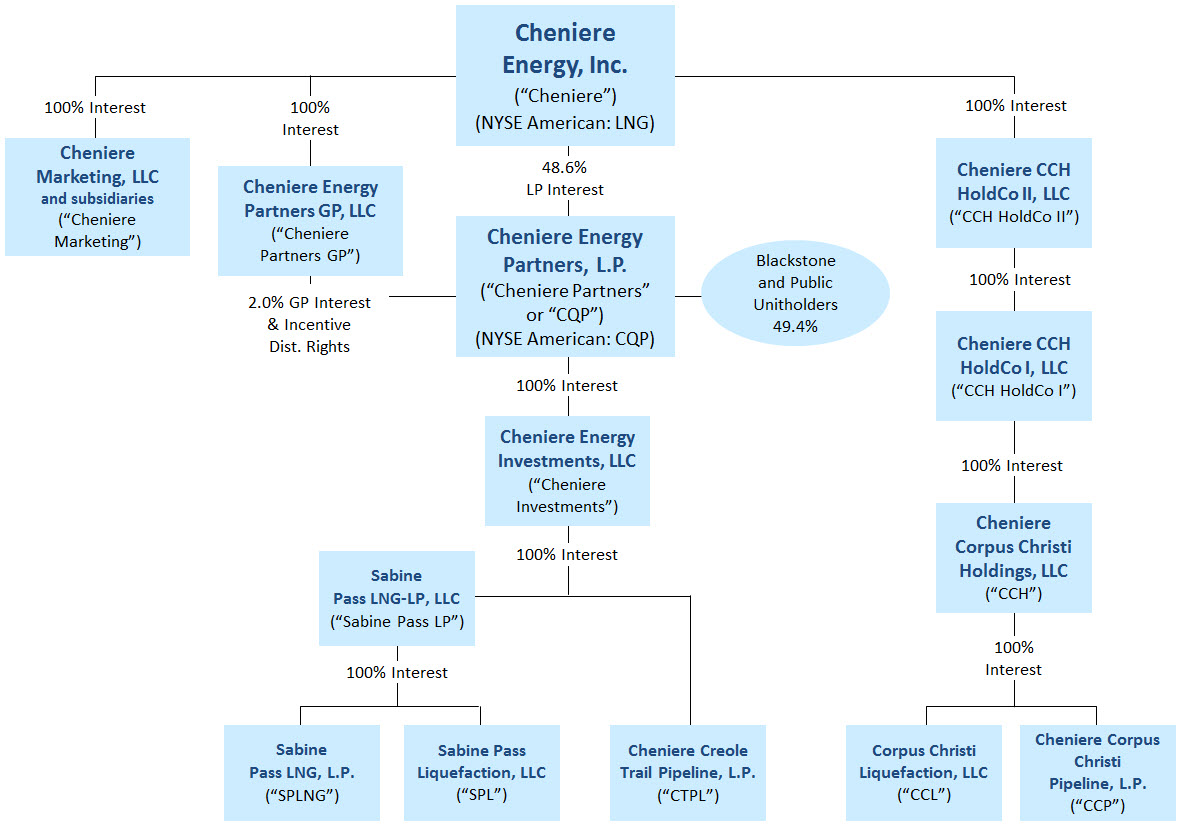
Abbreviated Legal Entity Structure
The following diagram depicts our abbreviated legal entity structure as of March 31, 2019, including our ownership of certain subsidiaries, and the references to these entities used in this quarterly report:
Unless the context requires otherwise, references to “Cheniere,” the “Company,” “we,” “us” and “our” refer to Cheniere Energy, Inc. and its consolidated subsidiaries, including our publicly traded subsidiary, Cheniere Partners.
Unless the context requires otherwise, references to the “CCH Group” refer to CCH HoldCo II, CCH HoldCo I, CCH, CCL and CCP, collectively.
| |
PART I. | FINANCIAL INFORMATION |
| |
ITEM 1. | CONSOLIDATED FINANCIAL STATEMENTS |
CHENIERE ENERGY, INC. AND SUBSIDIARIES
CONSOLIDATED BALANCE SHEETS
(in millions, except share data)
|
| | | | | | | |
| March 31, | | December 31, |
| 2019 | | 2018 |
ASSETS | (unaudited) | | |
Current assets | | | |
Cash and cash equivalents | $ | 1,093 |
| | $ | 981 |
|
Restricted cash | 1,918 |
| | 2,175 |
|
Accounts and other receivables | 390 |
| | 581 |
|
Accounts receivable—related party | 3 |
| | 4 |
|
Inventory | 279 |
| | 316 |
|
Derivative assets | 107 |
| | 63 |
|
Other current assets | 106 |
| | 114 |
|
Total current assets | 3,896 |
| | 4,234 |
|
| | | |
Property, plant and equipment, net | 27,953 |
| | 27,245 |
|
Operating lease assets, net | 542 |
| | — |
|
Debt issuance costs, net | 58 |
| | 72 |
|
Non-current derivative assets | 42 |
| | 54 |
|
Goodwill | 77 |
| | 77 |
|
Other non-current assets, net | 317 |
| | 305 |
|
Total assets | $ | 32,885 |
| | $ | 31,987 |
|
| | | |
LIABILITIES AND STOCKHOLDERS’ EQUITY | |
| | |
|
Current liabilities | |
| | |
|
Accounts payable | $ | 66 |
| | $ | 58 |
|
Accrued liabilities | 1,101 |
| | 1,169 |
|
Accrued liabilities—related party | 5 |
| | — |
|
Current debt | — |
| | 239 |
|
Deferred revenue | 108 |
| | 139 |
|
Current operating lease liabilities | 325 |
| | — |
|
Derivative liabilities | 37 |
| | 128 |
|
Other current liabilities | 17 |
| | 9 |
|
Total current liabilities | 1,659 |
| | 1,742 |
|
| | | |
Long-term debt, net | 28,726 |
| | 28,179 |
|
Non-current operating lease liabilities | 207 |
| | — |
|
Non-current finance lease liabilities | 58 |
| | 57 |
|
Non-current derivative liabilities | 39 |
| | 22 |
|
Other non-current liabilities | 58 |
| | 58 |
|
| | | |
Commitments and contingencies (see Note 16) |
|
| |
|
|
| | | |
Stockholders’ equity | |
| | |
|
Preferred stock, $0.0001 par value, 5.0 million shares authorized, none issued | — |
| | — |
|
Common stock, $0.003 par value | | | |
|
Authorized: 480.0 million shares at March 31, 2019 and December 31, 2018 | | | |
Issued: 270.4 million shares at March 31, 2019 and 269.8 million shares at December 31, 2018 |
|
| |
|
|
Outstanding: 257.4 million shares at March 31, 2019 and 257.0 million shares at December 31, 2018 | 1 |
| | 1 |
|
Treasury stock: 13.0 million shares and 12.8 million shares at March 31, 2019 and December 31, 2018, respectively, at cost | (418 | ) | | (406 | ) |
Additional paid-in-capital | 4,063 |
| | 4,035 |
|
Accumulated deficit | (4,015 | ) | | (4,156 | ) |
Total stockholders’ deficit | (369 | ) | | (526 | ) |
Non-controlling interest | 2,507 |
| | 2,455 |
|
Total equity | 2,138 |
| | 1,929 |
|
Total liabilities and equity | $ | 32,885 |
| | $ | 31,987 |
|
The accompanying notes are an integral part of these consolidated financial statements.
3
CHENIERE ENERGY, INC. AND SUBSIDIARIES
CONSOLIDATED STATEMENTS OF OPERATIONS
(in millions, except per share data)
(unaudited)
|
| | | | | | | |
| Three Months Ended March 31, |
| 2019 | | 2018 |
Revenues | | | |
LNG revenues | $ | 2,143 |
| | $ | 2,166 |
|
Regasification revenues | 66 |
| | 65 |
|
Other revenues | 48 |
| | 10 |
|
Other—related party | 4 |
| | 1 |
|
Total revenues | 2,261 |
| | 2,242 |
|
| | | |
Operating costs and expenses | | | |
Cost of sales (excluding depreciation and amortization expense shown separately below) | 1,204 |
| | 1,178 |
|
Cost of sales—related party | 10 |
| | — |
|
Operating and maintenance expense | 221 |
| | 140 |
|
Development expense | 1 |
| | 1 |
|
Selling, general and administrative expense | 73 |
| | 67 |
|
Depreciation and amortization expense | 144 |
| | 109 |
|
Impairment expense and loss on disposal of assets | 2 |
| | — |
|
Total operating costs and expenses | 1,655 |
| | 1,495 |
|
| | | |
Income from operations | 606 |
| | 747 |
|
| | | |
Other income (expense) | | | |
Interest expense, net of capitalized interest | (247 | ) | | (216 | ) |
Derivative gain (loss), net | (35 | ) | | 77 |
|
Other income | 16 |
| | 7 |
|
Total other expense | (266 | ) | | (132 | ) |
| | | |
Income before income taxes and non-controlling interest | 340 |
|
| 615 |
|
Income tax provision | (3 | ) |
| (15 | ) |
Net income | 337 |
|
| 600 |
|
Less: net income attributable to non-controlling interest | 196 |
|
| 243 |
|
Net income attributable to common stockholders | $ | 141 |
|
| $ | 357 |
|
|
|
|
|
|
|
Net income per share attributable to common stockholders—basic | $ | 0.55 |
|
| $ | 1.52 |
|
Net income per share attributable to common stockholders—diluted (1) | $ | 0.54 |
| | $ | 1.50 |
|
|
|
|
|
|
|
Weighted average number of common shares outstanding—basic | 257.1 |
| | 235.5 |
|
Weighted average number of common shares outstanding—diluted | 258.5 |
| | 238.0 |
|
The accompanying notes are an integral part of these consolidated financial statements.
4
CHENIERE ENERGY, INC. AND SUBSIDIARIES
CONSOLIDATED STATEMENTS OF STOCKHOLDERS’ EQUITY
(in millions)
(unaudited)
|
| | | | | | | | | | | | | | | | | | | | | | | | | | | | | |
Three Months Ended March 31, 2019 | | | | | | | | | | | | | | | |
| Total Stockholders’ Equity | | | |
| Common Stock | | Treasury Stock | | Additional Paid-in Capital | | Accumulated Deficit | | Non-controlling Interest | | Total Equity |
| Shares | | Par Value Amount | | Shares | | Amount | | | | |
Balance at December 31, 2018 | 257.0 |
|
| $ | 1 |
|
| 12.8 |
|
| $ | (406 | ) |
| $ | 4,035 |
|
| $ | (4,156 | ) |
| $ | 2,455 |
|
| $ | 1,929 |
|
Vesting of restricted stock units | 0.6 |
| | — |
| | — |
| | — |
| | — |
| | — |
| | — |
| | — |
|
Share-based compensation | — |
| | — |
| | — |
| | — |
| | 28 |
| | — |
| | — |
| | 28 |
|
Shares repurchased related to share-based compensation | (0.2 | ) | | — |
| | 0.2 |
| | (12 | ) | | — |
| | — |
| | — |
| | (12 | ) |
Net income attributable to non-controlling interest | — |
| | — |
| | — |
| | — |
| | — |
| | — |
| | 196 |
| | 196 |
|
Distributions and dividends to non-controlling interest | — |
| | — |
| | — |
| | — |
| | — |
| | — |
| | (144 | ) | | (144 | ) |
Net income | — |
| | — |
| | — |
| | — |
| | — |
| | 141 |
| | — |
| | 141 |
|
Balance at March 31, 2019 | 257.4 |
| | $ | 1 |
| | 13.0 |
| | $ | (418 | ) | | $ | 4,063 |
| | $ | (4,015 | ) | | $ | 2,507 |
| | $ | 2,138 |
|
|
| | | | | | | | | | | | | | | | | | | | | | | | | | | | | |
Three Months Ended March 31, 2018 | | | | | | | | | | | | | | | |
| Total Stockholders’ Equity | | | |
| Common Stock | | Treasury Stock | | Additional Paid-in Capital | | Accumulated Deficit | | Non-controlling Interest | | Total
Equity |
| Shares | | Par Value Amount | | Shares | | Amount | | | | |
Balance at December 31, 2017 | 237.6 |
| | $ | 1 |
| | 12.5 |
| | $ | (386 | ) | | $ | 3,248 |
| | $ | (4,627 | ) | | $ | 3,004 |
| | $ | 1,240 |
|
Vesting of restricted stock units | 0.3 |
| | — |
| | — |
| | — |
| | — |
| | — |
| | — |
| | — |
|
Share-based compensation | — |
| | — |
| | — |
| | — |
| | 16 |
| | — |
| | — |
| | 16 |
|
Shares repurchased related to share-based compensation | — |
| | — |
| | 0.1 |
| | (6 | ) | | — |
| | — |
| | — |
| | (6 | ) |
Net income attributable to non-controlling interest | — |
| | — |
| | — |
| | — |
| | — |
| | — |
| | 243 |
| | 243 |
|
Distributions and dividends to non-controlling interest | — |
| | — |
| | — |
| | — |
| | — |
| | — |
| | (143 | ) | | (143 | ) |
Net income | — |
| | — |
| | — |
| | — |
| | — |
| | 357 |
| | — |
| | 357 |
|
Balance at March 31, 2018 | 237.9 |
| | $ | 1 |
| | 12.6 |
| | $ | (392 | ) | | $ | 3,264 |
| | $ | (4,270 | ) | | $ | 3,104 |
| | $ | 1,707 |
|
The accompanying notes are an integral part of these consolidated financial statements.
5
CHENIERE ENERGY, INC. AND SUBSIDIARIES
CONSOLIDATED STATEMENTS OF CASH FLOWS
(in millions)
(unaudited)
|
| | | | | | | |
| Three Months Ended March 31, |
| 2019 | | 2018 |
Cash flows from operating activities | | | |
Net income | $ | 337 |
| | $ | 600 |
|
Adjustments to reconcile net income to net cash provided by operating activities: | | | |
Depreciation and amortization expense | 144 |
| | 109 |
|
Share-based compensation expense | 28 |
| | 28 |
|
Non-cash interest expense | 33 |
| | 15 |
|
Amortization of debt issuance costs, deferred commitment fees, premium and discount | 18 |
| | 17 |
|
Amortization of operating lease assets | 79 |
| | — |
|
Total gains on derivatives, net | (122 | ) | | (31 | ) |
Net cash provided by (used for) settlement of derivative instruments | 16 |
| | (4 | ) |
Impairment expense and loss on disposal of assets | 2 |
| | — |
|
Other | — |
| | (10 | ) |
Changes in operating assets and liabilities: | | | |
Accounts and other receivables | 98 |
| | (237 | ) |
Accounts receivable—related party | 1 |
| | — |
|
Inventory | 44 |
| | 120 |
|
Accounts payable and accrued liabilities | (151 | ) | | (156 | ) |
Accrued liabilities—related party | 5 |
| | — |
|
Deferred revenue | (31 | ) | | 8 |
|
Operating lease liabilities | (85 | ) | | — |
|
Finance lease liabilities | 1 |
| | — |
|
Other, net | (5 | ) | | 10 |
|
Net cash provided by operating activities | 412 |
| | 469 |
|
| | | |
Cash flows from investing activities | | | |
Property, plant and equipment, net | (625 | ) | | (776 | ) |
Investment in equity method investment | (24 | ) | | — |
|
Other | (2 | ) | | — |
|
Net cash used in investing activities | (651 | ) | | (776 | ) |
| | | |
Cash flows from financing activities | | | |
Proceeds from issuances of debt | 692 |
| | 266 |
|
Repayments of debt | (441 | ) | | — |
|
Debt issuance and deferred financing costs | — |
| | (1 | ) |
Distributions and dividends to non-controlling interest | (144 | ) | | (143 | ) |
Payments related to tax withholdings for share-based compensation | (12 | ) | | (6 | ) |
Other | (1 | ) | | — |
|
Net cash provided by financing activities | 94 |
| | 116 |
|
| | | |
Net decrease in cash, cash equivalents and restricted cash | (145 | ) | | (191 | ) |
Cash, cash equivalents and restricted cash—beginning of period | 3,156 |
| | 2,613 |
|
Cash, cash equivalents and restricted cash—end of period | $ | 3,011 |
| | $ | 2,422 |
|
Balances per Consolidated Balance Sheet:
|
| | | |
| March 31, |
| 2019 |
Cash and cash equivalents | $ | 1,093 |
|
Restricted cash | 1,918 |
|
Total cash, cash equivalents and restricted cash | $ | 3,011 |
|
The accompanying notes are an integral part of these consolidated financial statements.
6
CHENIERE ENERGY, INC. AND SUBSIDIARIES
NOTES TO CONSOLIDATED FINANCIAL STATEMENTS
(unaudited)
NOTE 1—NATURE OF OPERATIONS AND BASIS OF PRESENTATION
We are currently developing and constructing two natural gas liquefaction and export facilities. The Sabine Pass LNG terminal is located in Cameron Parish, Louisiana, on the Sabine-Neches Waterway less than four miles from the Gulf Coast. Cheniere Partners is developing, constructing and operating natural gas liquefaction facilities (the “SPL Project”) at the Sabine Pass LNG terminal adjacent to the existing regasification facilities (described below) through a wholly owned subsidiary, SPL. Cheniere Partners plans to construct up to six Trains, which are in various stages of development, construction and operations. Trains 1 through 5 are operational and early works have begun for Train 6 under limited notices to proceed ahead of an anticipated positive final investment decision (“FID”). The Sabine Pass LNG terminal has operational regasification facilities owned by Cheniere Partners’ wholly owned subsidiary, SPLNG, and a 94-mile pipeline that interconnects the Sabine Pass LNG terminal with a number of large interstate pipelines owned by Cheniere Partners’ wholly owned subsidiary, CTPL.
We are developing and constructing a second natural gas liquefaction and export facility at the Corpus Christi LNG terminal near Corpus Christi, Texas, and operate a 23-mile natural gas supply pipeline that interconnects the Corpus Christi LNG terminal with several interstate and intrastate natural gas pipelines (the “Corpus Christi Pipeline” and together with the liquefaction facilities, the “CCL Project”) through our wholly owned subsidiaries CCL and CCP, respectively. The CCL Project is being developed in stages with the first phase being three Trains (“Phase 1”). The first stage includes Trains 1 and 2, two LNG storage tanks, one complete marine berth and a second partial berth and all of the CCL Project’s necessary infrastructure facilities (“Stage 1”). The second stage includes Train 3, one LNG storage tank and the completion of the second partial berth (“Stage 2”). Train 1 is operational, Train 2 is undergoing commissioning and Train 3 is under construction.
Additionally, separate from the CCH Group, we are developing an expansion of the Corpus Christi LNG terminal adjacent to the CCL Project and filed an application with FERC in June 2018 for seven midscale Trains with an expected aggregate nominal production capacity of approximately 9.5 mtpa and one LNG storage tank.
We remain focused on expansion of our existing sites by leveraging existing infrastructure. We continue to consider development of other projects, including infrastructure projects in support of natural gas supply and LNG demand, which, among other things, will require acceptable commercial and financing arrangements before we make an FID.
Basis of Presentation
The accompanying unaudited Consolidated Financial Statements of Cheniere have been prepared in accordance with GAAP for interim financial information and with Rule 10-01 of Regulation S-X. Accordingly, they do not include all of the information and footnotes required by GAAP for complete financial statements and should be read in conjunction with the Consolidated Financial Statements and accompanying notes included in our annual report on Form 10-K for the year ended December 31, 2018. In our opinion, all adjustments, consisting only of normal recurring adjustments necessary for a fair presentation, have been included.
Results of operations for the three months ended March 31, 2019 are not necessarily indicative of the results of operations that will be realized for the year ending December 31, 2019.
Recent Accounting Standards
We adopted ASU 2016-02, Leases (Topic 842), and subsequent amendments thereto (“ASC 842”) on January 1, 2019 using the optional transition approach to apply the standard at the beginning of the first quarter of 2019 with no retrospective adjustments to prior periods. The adoption of the standard resulted in the recognition of right-of-use assets and lease liabilities for operating leases of approximately $550 million on our Consolidated Balance Sheets, with no material impact on our Consolidated Statements of Operations or Consolidated Statements of Cash Flows. We have elected the practical expedients to (1) carryforward prior conclusions related to lease identification and classification for existing leases, (2) combine lease and non-lease components of an arrangement for all classes of leased assets, (3) omit short-term leases with a term of 12 months or less from recognition on the balance sheet and (4) carryforward our existing accounting for land easements not previously accounted for as leases. See Note 11—Leases for additional information on our leases following the adoption of this standard.
CHENIERE ENERGY, INC. AND SUBSIDIARIES
NOTES TO CONSOLIDATED FINANCIAL STATEMENTS—CONTINUED
(unaudited)
NOTE 2—RESTRICTED CASH
Restricted cash consists of funds that are contractually restricted as to usage or withdrawal and have been presented separately from cash and cash equivalents on our Consolidated Balance Sheets. As of March 31, 2019 and December 31, 2018, restricted cash consisted of the following (in millions):
|
| | | | | | | | |
| | March 31, | | December 31, |
| | 2019 | | 2018 |
Current restricted cash | | | | |
SPL Project | | $ | 621 |
| | $ | 756 |
|
Cheniere Partners and cash held by guarantor subsidiaries | | 676 |
| | 785 |
|
CCL Project | | 218 |
| | 289 |
|
Cash held by our subsidiaries restricted to Cheniere | | 403 |
| | 345 |
|
Total current restricted cash | | $ | 1,918 |
| | $ | 2,175 |
|
Pursuant to the accounts agreements entered into with the collateral trustees for the benefit of SPL’s debt holders and CCH’s debt holders, SPL and CCH are required to deposit all cash received into reserve accounts controlled by the collateral trustees. The usage or withdrawal of such cash is restricted to the payment of liabilities related to the SPL Project and the CCL Project and other restricted payments.
Under Cheniere Partners’ credit facilities (the “CQP Credit Facilities”), Cheniere Partners and each of its subsidiaries other than (1) SPL and (2) certain subsidiaries of Cheniere Partners owning other development projects, as well as certain other specified subsidiaries and members of the foregoing entities, as guarantor subsidiaries, are subject to limitations on the use of cash under the terms of the CQP Credit Facilities and the related depositary agreement governing the extension of credit to Cheniere Partners. Specifically, Cheniere Partners may only withdraw funds from collateral accounts held at a designated depositary bank on a limited basis and for specific purposes, including for the payment of operating expenses of Cheniere Partners and its guarantor subsidiaries. In addition, distributions and capital expenditures may only be made quarterly and are subject to certain restrictions.
NOTE 3—ACCOUNTS AND OTHER RECEIVABLES
As of March 31, 2019 and December 31, 2018, accounts and other receivables consisted of the following (in millions):
|
| | | | | | | | |
| | March 31, | | December 31, |
| | 2019 | | 2018 |
Trade receivables | | | | |
SPL | | $ | 187 |
| | $ | 330 |
|
Cheniere Marketing | | 152 |
| | 205 |
|
Other accounts receivable | | 51 |
| | 46 |
|
Total accounts and other receivables | | $ | 390 |
| | $ | 581 |
|
NOTE 4—INVENTORY
As of March 31, 2019 and December 31, 2018, inventory consisted of the following (in millions):
|
| | | | | | | | |
| | March 31, | | December 31, |
| | 2019 | | 2018 |
Natural gas | | $ | 10 |
| | $ | 30 |
|
LNG | | 67 |
| | 24 |
|
LNG in-transit | | 81 |
| | 173 |
|
Materials and other | | 121 |
| | 89 |
|
Total inventory | | $ | 279 |
| | $ | 316 |
|
CHENIERE ENERGY, INC. AND SUBSIDIARIES
NOTES TO CONSOLIDATED FINANCIAL STATEMENTS—CONTINUED
(unaudited)
NOTE 5—PROPERTY, PLANT AND EQUIPMENT
As of March 31, 2019 and December 31, 2018, property, plant and equipment, net consisted of the following (in millions):
|
| | | | | | | | |
| | March 31, | | December 31, |
| | 2019 | | 2018 |
LNG terminal costs | | | | |
LNG terminal and interconnecting pipeline facilities | | $ | 23,626 |
| | $ | 13,386 |
|
LNG site and related costs | | 319 |
| | 86 |
|
LNG terminal construction-in-process | | 5,239 |
| | 14,864 |
|
Accumulated depreciation | | (1,433 | ) | | (1,299 | ) |
Total LNG terminal costs, net | | 27,751 |
| | 27,037 |
|
Fixed assets and other | | |
| | |
|
Computer and office equipment | | 18 |
| | 17 |
|
Furniture and fixtures | | 22 |
| | 22 |
|
Computer software | | 101 |
| | 100 |
|
Leasehold improvements | | 41 |
| | 41 |
|
Land | | 59 |
| | 59 |
|
Other | | 22 |
| | 21 |
|
Accumulated depreciation | | (119 | ) | | (111 | ) |
Total fixed assets and other, net | | 144 |
| | 149 |
|
Assets under finance lease | | | | |
Tug vessels | | 60 |
| | 60 |
|
Accumulated depreciation | | (2 | ) | | (1 | ) |
Total assets under finance lease, net | | 58 |
| | 59 |
|
Property, plant and equipment, net | | $ | 27,953 |
| | $ | 27,245 |
|
Depreciation expense was $143 million and $108 million during the three months ended March 31, 2019 and 2018, respectively.
We realize offsets to LNG terminal costs for sales of commissioning cargoes that were earned or loaded prior to the start of commercial operations of the respective Train during the testing phase for its construction. We realized offsets to LNG terminal costs of $202 million in the three months ended March 31, 2019 for sales of commissioning cargoes from Train 5 of the SPL Project and Train 1 of the CCL Project. We did not realize any offsets to LNG terminal costs in the three months ended March 31, 2018.
NOTE 6—DERIVATIVE INSTRUMENTS
We have entered into the following derivative instruments that are reported at fair value:
| |
• | interest rate swaps to hedge the exposure to volatility in a portion of the floating-rate interest payments under certain credit facilities (“Interest Rate Derivatives”); |
| |
• | commodity derivatives consisting of natural gas supply contracts for the commissioning and operation of the SPL Project and the CCL Project (“Physical Liquefaction Supply Derivatives”) and associated economic hedges (collectively, the “Liquefaction Supply Derivatives”); |
| |
• | financial derivatives to hedge the exposure to the commodity markets in which we have contractual arrangements to purchase or sell physical LNG (“LNG Trading Derivatives”); and |
| |
• | foreign currency exchange (“FX”) contracts to hedge exposure to currency risk associated with both LNG Trading Derivatives and operations in countries outside of the United States (“FX Derivatives”). |
We recognize our derivative instruments as either assets or liabilities and measure those instruments at fair value. None of our derivative instruments are designated as cash flow hedging instruments, and changes in fair value are recorded within our Consolidated Statements of Operations to the extent not utilized for the commissioning process.
CHENIERE ENERGY, INC. AND SUBSIDIARIES
NOTES TO CONSOLIDATED FINANCIAL STATEMENTS—CONTINUED
(unaudited)
The following table shows the fair value of our derivative instruments that are required to be measured at fair value on a recurring basis as of March 31, 2019 and December 31, 2018, which are classified as derivative assets, non-current derivative assets, derivative liabilities or non-current derivative liabilities in our Consolidated Balance Sheets (in millions).
|
| | | | | | | | | | | | | | | | | | | | | | | | | | | | | | | |
| Fair Value Measurements as of |
| March 31, 2019 | | December 31, 2018 |
| Quoted Prices in Active Markets
(Level 1) | | Significant Other Observable Inputs
(Level 2) | | Significant Unobservable Inputs
(Level 3) | | Total | | Quoted Prices in Active Markets
(Level 1) | | Significant Other Observable Inputs
(Level 2) | | Significant Unobservable Inputs
(Level 3) | | Total |
CCH Interest Rate Derivatives asset (liability) | $ | — |
| | $ | (19 | ) | | $ | — |
| | $ | (19 | ) | | $ | — |
| | $ | 18 |
| | $ | — |
| | $ | 18 |
|
Liquefaction Supply Derivatives asset (liability) | 1 |
| | 3 |
| | 31 |
| | 35 |
| | 6 |
| | (19 | ) | | (29 | ) | | (42 | ) |
LNG Trading Derivatives asset (liability) | (17 | ) | | 51 |
| | — |
| | 34 |
| | 1 |
| | (25 | ) | | — |
| | (24 | ) |
FX Derivatives asset | — |
| | 23 |
| | — |
| | 23 |
| | — |
| | 15 |
| | — |
| | 15 |
|
There have been no changes to our evaluation of and accounting for our derivative positions during the three months ended March 31, 2019.
We value our Interest Rate Derivatives using an income-based approach utilizing observable inputs to the valuation model including interest rate curves, risk adjusted discount rates, credit spreads and other relevant data. We value our LNG Trading Derivatives and our Liquefaction Supply Derivatives using a market-based approach incorporating present value techniques, as needed, using observable commodity price curves, when available, and other relevant data. We value our FX Derivatives with a market approach using observable FX rates and other relevant data.
The fair value of our Physical Liquefaction Supply Derivatives is predominantly driven by market commodity basis prices and, as applicable to our natural gas supply contracts, our assessment of the associated conditions precedent, including evaluating whether the respective market is available as pipeline infrastructure is developed. Upon the satisfaction of conditions precedent, including completion and placement into service of relevant pipeline infrastructure to accommodate marketable physical gas flow, we recognize a gain or loss based on the fair value of the respective natural gas supply contracts.
We include a portion of our Physical Liquefaction Supply Derivatives as Level 3 within the valuation hierarchy as the fair value is developed through the use of internal models which may be impacted by inputs that are unobservable in the marketplace. The curves used to generate the fair value of our Physical Liquefaction Supply Derivatives are based on basis adjustments applied to forward curves for a liquid trading point. In addition, there may be observable liquid market basis information in the near term, but terms of a Physical Liquefaction Supply Derivatives contract may exceed the period for which such information is available, resulting in a Level 3 classification. In these instances, the fair value of the contract incorporates extrapolation assumptions made in the determination of the market basis price for future delivery periods in which applicable commodity basis prices were either not observable or lacked corroborative market data. As of March 31, 2019 and December 31, 2018, some of our Physical Liquefaction Supply Derivatives existed within markets for which the pipeline infrastructure is under development to accommodate marketable physical gas flow.
The Level 3 fair value measurements of natural gas positions within our Physical Liquefaction Supply Derivatives could be materially impacted by a significant change in certain natural gas market basis spreads due to the contractual notional amount represented by our Level 3 positions, which is a substantial portion of our overall Physical Liquefaction Supply Derivatives portfolio. The following table includes quantitative information for the unobservable inputs for our Level 3 Physical Liquefaction Supply Derivatives as of March 31, 2019:
|
| | | | | | | | |
| | Net Fair Value Asset (in millions) | | Valuation Approach | | Significant Unobservable Input | | Significant Unobservable Inputs Range |
Physical Liquefaction Supply Derivatives | | $31 | | Market approach incorporating present value techniques | | Basis Spread | | $(0.703) - $0.082 |
CHENIERE ENERGY, INC. AND SUBSIDIARIES
NOTES TO CONSOLIDATED FINANCIAL STATEMENTS—CONTINUED
(unaudited)
The following table shows the changes in the fair value of our Level 3 Physical Liquefaction Supply Derivatives during the three months ended March 31, 2019 and 2018 (in millions):
|
| | | | | | | | |
| | Three Months Ended March 31, |
| | 2019 | | 2018 |
Balance, beginning of period | | $ | (29 | ) | | $ | 43 |
|
Realized and mark-to-market gains (losses): | | | | |
Included in cost of sales | | 12 |
| | (13 | ) |
Purchases and settlements: | | | | |
Purchases | | 1 |
| | 3 |
|
Settlements | | 47 |
| | (23 | ) |
Balance, end of period | | $ | 31 |
| | $ | 10 |
|
Change in unrealized gains (losses) relating to instruments still held at end of period | | $ | 12 |
| | $ | (13 | ) |
Derivative assets and liabilities arising from our derivative contracts with the same counterparty are reported on a net basis, as all counterparty derivative contracts provide for net settlement. The use of derivative instruments exposes us to counterparty credit risk, or the risk that a counterparty will be unable to meet its commitments in instances when our derivative instruments are in an asset position. Additionally, we evaluate our own ability to meet our commitments in instances where our derivative instruments are in a liability position. Our derivative instruments are subject to contractual provisions which provide for the unconditional right of set-off for all derivative assets and liabilities with a given counterparty in the event of default.
Interest Rate Derivatives
During the three months ended March 31, 2019, there were no changes to the terms of the interest rate swaps (“CCH Interest Rate Derivatives”) entered into by CCH to protect against volatility of future cash flows and hedge a portion of the variable interest payments on its credit facility (the “CCH Credit Facility”).
Cheniere Partners previously had interest rate swaps (“CQP Interest Rate Derivatives”) to hedge a portion of the variable interest payments on its CQP Credit Facilities, which were terminated in October 2018.
As of March 31, 2019, we had the following Interest Rate Derivatives outstanding:
|
| | | | | | | | | | | | |
| | Initial Notional Amount | | Maximum Notional Amount | | Effective Date | | Maturity Date | | Weighted Average Fixed Interest Rate Paid | | Variable Interest Rate Received |
CCH Interest Rate Derivatives | | $29 million | | $4.7 billion | | May 20, 2015 | | May 31, 2022 | | 2.30% | | One-month LIBOR |
The following table shows the fair value and location of the CCH Interest Rate Derivatives on our Consolidated Balance Sheets (in millions):
|
| | | | | | | | |
| | March 31, | | December 31, |
| | 2019 | | 2018 |
Consolidated Balance Sheet Location | | | | |
Derivative assets | | $ | 4 |
| | $ | 10 |
|
Non-current derivative assets | | — |
| | 8 |
|
Total derivative assets | | 4 |
| | 18 |
|
| | | | |
Non-current derivative liabilities | | (23 | ) | | — |
|
| | | | |
Derivative asset (liability), net | | $ | (19 | ) | | $ | 18 |
|
CHENIERE ENERGY, INC. AND SUBSIDIARIES
NOTES TO CONSOLIDATED FINANCIAL STATEMENTS—CONTINUED
(unaudited)
The following table shows the changes in the fair value and settlements of our Interest Rate Derivatives recorded in derivative gain (loss), net on our Consolidated Statements of Operations during the three months ended March 31, 2019 and 2018 (in millions):
|
| | | | | | | | |
| | Three Months Ended March 31, |
| | 2019 | | 2018 |
CCH Interest Rate Derivatives gain (loss) | | $ | (35 | ) | | $ | 69 |
|
CQP Interest Rate Derivatives gain | | — |
| | 8 |
|
Commodity Derivatives
SPL and CCL have entered into primarily index-based physical natural gas supply contracts and associated economic hedges to purchase natural gas for the commissioning and operation of the SPL Project and the CCL Project. The terms of the physical natural gas supply contracts range up to eight years, some of which commence upon the satisfaction of certain conditions precedent.
We have entered into, and may from time to time enter into, financial LNG Trading Derivatives in the form of swaps, forwards, options or futures to economically hedge exposure to the commodity markets in which we have contractual arrangements to purchase or sell physical LNG. We have entered into LNG Trading Derivatives to secure a fixed price position to minimize future cash flow variability associated with LNG purchase and sale transactions.
The following table shows the fair value and location of our Liquefaction Supply Derivatives and LNG Trading Derivatives (collectively, “Commodity Derivatives”) on our Consolidated Balance Sheets (in millions, except notional amount):
|
| | | | | | | | | | | | | | | | | | | | | | | |
| March 31, 2019 | | December 31, 2018 |
| Liquefaction Supply Derivatives (1) | | LNG Trading Derivatives (2) | | Total | | Liquefaction Supply Derivatives (1) | | LNG Trading Derivatives (2) | | Total |
Consolidated Balance Sheet Location | | | | | | | | | | | |
Derivative assets | $ | 21 |
| | $ | 58 |
| | $ | 79 |
| | $ | 13 |
| | $ | 24 |
| | $ | 37 |
|
Non-current derivative assets | 42 |
| | — |
| | 42 |
| | 46 |
| | — |
| | 46 |
|
Total derivative assets | 63 |
| | 58 |
| | 121 |
| | 59 |
| | 24 |
| | 83 |
|
| | | | | | | | | | | |
Derivative liabilities | (12 | ) | | (24 | ) | | (36 | ) | | (79 | ) | | (48 | ) | | (127 | ) |
Non-current derivative liabilities | (16 | ) | | — |
| | (16 | ) | | (22 | ) | | — |
| | (22 | ) |
Total derivative liabilities | (28 | ) | | (24 | ) | | (52 | ) | | (101 | ) | | (48 | ) | | (149 | ) |
| | | | | | | | | | | |
Derivative asset (liability), net | $ | 35 |
| | $ | 34 |
| | $ | 69 |
| | $ | (42 | ) | | $ | (24 | ) | | $ | (66 | ) |
| | | | | | | | | | | |
Notional amount, net (in TBtu) (3) | 6,025 |
| | (10 | ) | | | | 5,832 |
| | 12 |
| | |
| |
(1) | $5 million for such contracts, which are included in other current assets in our Consolidated Balance Sheets as of both March 31, 2019 and December 31, 2018. |
| |
(2) | $32 million and $9 million deposited for such contracts, which are included in other current assets in our Consolidated Balance Sheets as of March 31, 2019 and December 31, 2018, respectively. |
| |
(3) | 3,542 TBtu and 3,464 TBtu and CCL had secured up to approximately 2,805 TBtu and 2,801 TBtu of natural gas feedstock through natural gas supply contracts as of March 31, 2019 and December 31, 2018, respectively. |
CHENIERE ENERGY, INC. AND SUBSIDIARIES
NOTES TO CONSOLIDATED FINANCIAL STATEMENTS—CONTINUED
(unaudited)
The following table shows the changes in the fair value, settlements and location of our Commodity Derivatives recorded on our Consolidated Statements of Operations during the three months ended March 31, 2019 and 2018 (in millions):
|
| | | | | | | | | |
| Consolidated Statements of Operations Location (1) | | Three Months Ended March 31, |
| | 2019 | | 2018 |
LNG Trading Derivatives gain | LNG revenues | | $ | 64 |
| | $ | 7 |
|
Liquefaction Supply Derivatives gain (2) | LNG revenues | | 2 |
| | — |
|
Liquefaction Supply Derivatives gain (loss) (2) | Cost of sales | | 82 |
| | (50 | ) |
| |
(2) | $10 million that CCL recorded in cost of sales—related party under a natural gas supply contract with a related party during the three months ended March 31, 2019. Of this amount, $5 million was included in accrued liabilities—related party as of March 31, 2019. |
FX Derivatives
The following table shows the fair value and location of our FX Derivatives on our Consolidated Balance Sheets (in millions):
|
| | | | | | | | | |
| | | Fair Value Measurements as of |
| Consolidated Balance Sheet Location | | March 31, 2019 | | December 31, 2018 |
FX Derivatives | Derivative assets | | $ | 24 |
| | $ | 16 |
|
FX Derivatives | Derivative liabilities | | (1 | ) | | (1 | ) |
The total notional amount of our FX Derivatives was $377 million and $379 million as of March 31, 2019 and December 31, 2018, respectively.
The following table shows the changes in the fair value and location of our FX Derivatives recorded on our Consolidated Statements of Operations during the three months ended March 31, 2019 and 2018 (in millions):
|
| | | | | | | | | |
| | | Three Months Ended March 31, |
| Statement of Operations Location | | 2019 | | 2018 |
FX Derivatives gain (loss) | LNG revenues | | $ | 9 |
| | $ | (3 | ) |
CHENIERE ENERGY, INC. AND SUBSIDIARIES
NOTES TO CONSOLIDATED FINANCIAL STATEMENTS—CONTINUED
(unaudited)
Consolidated Balance Sheet Presentation
Our derivative instruments are presented on a net basis on our Consolidated Balance Sheets as described above. The following table shows the fair value of our derivatives outstanding on a gross and net basis (in millions):
|
| | | | | | | | | | | | |
| | Gross Amounts Recognized | | Gross Amounts Offset in the Consolidated Balance Sheets | | Net Amounts Presented in the Consolidated Balance Sheets |
Offsetting Derivative Assets (Liabilities) | | | |
As of March 31, 2019 | | | | | | |
CCH Interest Rate Derivatives | | $ | 5 |
| | $ | (1 | ) | | $ | 4 |
|
CCH Interest Rate Derivatives | | (23 | ) | | — |
| | (23 | ) |
Liquefaction Supply Derivatives | | 68 |
| | (5 | ) | | 63 |
|
Liquefaction Supply Derivatives | | (33 | ) | | 5 |
| | (28 | ) |
LNG Trading Derivatives | | 61 |
| | (3 | ) | | 58 |
|
LNG Trading Derivatives | | (25 | ) | | 1 |
| | (24 | ) |
FX Derivatives | | 34 |
| | (10 | ) | | 24 |
|
FX Derivatives | | (12 | ) | | 11 |
| | (1 | ) |
As of December 31, 2018 | | | | | |
|
|
CCH Interest Rate Derivatives | | $ | 19 |
| | $ | (1 | ) | | $ | 18 |
|
Liquefaction Supply Derivatives | | 95 |
| | (36 | ) | | 59 |
|
Liquefaction Supply Derivatives | | (121 | ) | | 20 |
| | (101 | ) |
LNG Trading Derivatives | | 112 |
| | (88 | ) | | 24 |
|
LNG Trading Derivatives | | (92 | ) | | 44 |
| | (48 | ) |
FX Derivatives | | 30 |
| | (14 | ) | | 16 |
|
FX Derivatives | | (2 | ) | | 1 |
| | (1 | ) |
NOTE 7—OTHER NON-CURRENT ASSETS
As of March 31, 2019 and December 31, 2018, other non-current assets, net consisted of the following (in millions):
|
| | | | | | | | |
| | March 31, | | December 31, |
| | 2019 | | 2018 |
Advances made to municipalities for water system enhancements | | $ | 90 |
| | $ | 90 |
|
Advances and other asset conveyances to third parties to support LNG terminals | | 54 |
| | 54 |
|
Tax-related payments and receivables | | 21 |
| | 21 |
|
Equity method investments | | 117 |
| | 94 |
|
Advances made under EPC and non-EPC contracts | | 1 |
| | 14 |
|
Other | | 34 |
| | 32 |
|
Total other non-current assets, net | | $ | 317 |
| | $ | 305 |
|
Equity Method Investments
Our equity method investments consist of interests in privately-held companies. In 2017, we acquired an equity interest in Midship Holdings, LLC (“Midship Holdings”), which manages the business and affairs of Midship Pipeline Company, LLC (“Midship Pipeline”). Midship Pipeline is currently constructing an approximately 200-mile natural gas pipeline project (the “Midship Project”) that connects production in the Anadarko Basin to Gulf Coast markets. Construction of the Midship Project commenced in the first quarter of 2019.
Subsequent to Midship Project obtaining its financing in the form of credit facilities, in conjunction with existing equity, Midship Holdings is able to finance its current activities without additional subordinated financial support. As a result of the total equity investment at risk being sufficient to finance its activities, Midship Holdings is no longer a variable interest entity. We continue to report Midship Holdings as an equity method investment due to our ability to exercise significant influence over the operating and financial policies of Midship Holdings through our non-controlling voting rights on its board of managers. Our investment in Midship Holdings was $108 million and $85 million at March 31, 2019 and December 31, 2018, respectively.
Cheniere LNG O&M Services, LLC (“O&M Services”), our wholly owned subsidiary, provides the development, construction, operation and maintenance services associated with the Midship Project pursuant to agreements in which O&M
CHENIERE ENERGY, INC. AND SUBSIDIARIES
NOTES TO CONSOLIDATED FINANCIAL STATEMENTS—CONTINUED
(unaudited)
Services receives an agreed upon fee and reimbursement of costs incurred. O&M Services recorded $4 million and $1 million in the three months ended March 31, 2019 and 2018, respectively, of revenues in other—related party and $3 million and $4 million of accounts receivable—related party as of March 31, 2019 and December 31, 2018, respectively, for services provided to Midship Pipeline under these agreements. CCL has entered into a transportation precedent agreement and a negotiated rate agreement with Midship Pipeline to secure firm pipeline transportation capacity for a period of 10 years following commencement of the Midship Project. In May 2018, CCL issued a letter of credit to Midship Pipeline for drawings up to an aggregate maximum amount of $16 million. Midship Pipeline had not made any drawings on this letter of credit as of March 31, 2019.
NOTE 8—NON-CONTROLLING INTEREST
We own a 48.6% limited partner interest in Cheniere Partners in the form of 104.5 million common units and 135.4 million subordinated units, with the remaining non-controlling interest held by Blackstone CQP Holdco LP and the public. We also own 100% of the general partner interest and the incentive distribution rights in Cheniere Partners. Cheniere Partners is accounted for as a variable interest entity. See Note 10—Variable Interest Entities of our Notes to Consolidated Financial Statements in our annual report on Form 10-K for the year ended December 31, 2018 for further information.
NOTE 9—ACCRUED LIABILITIES
As of March 31, 2019 and December 31, 2018, accrued liabilities consisted of the following (in millions):
|
| | | | | | | | |
| | March 31, | | December 31, |
| | 2019 | | 2018 |
Interest costs and related debt fees | | $ | 285 |
| | $ | 233 |
|
Accrued natural gas purchases | | 406 |
| | 610 |
|
LNG terminals and related pipeline costs | | 323 |
| | 125 |
|
Compensation and benefits | | 39 |
| | 117 |
|
Accrued LNG inventory | | 1 |
| | 14 |
|
Other accrued liabilities | | 47 |
| | 70 |
|
Total accrued liabilities | | $ | 1,101 |
| | $ | 1,169 |
|
CHENIERE ENERGY, INC. AND SUBSIDIARIES
NOTES TO CONSOLIDATED FINANCIAL STATEMENTS—CONTINUED
(unaudited)
NOTE 10—DEBT
As of March 31, 2019 and December 31, 2018, our debt consisted of the following (in millions):
|
| | | | | | | | |
| | March 31, | | December 31, |
| | 2019 | | 2018 |
Long-term debt: | | | | |
SPL | | | |
|
|
5.625% Senior Secured Notes due 2021 (“2021 SPL Senior Notes”) | | $ | 2,000 |
| | $ | 2,000 |
|
6.25% Senior Secured Notes due 2022 (“2022 SPL Senior Notes”) | | 1,000 |
| | 1,000 |
|
5.625% Senior Secured Notes due 2023 (“2023 SPL Senior Notes”) | | 1,500 |
| | 1,500 |
|
5.75% Senior Secured Notes due 2024 (“2024 SPL Senior Notes”) | | 2,000 |
| | 2,000 |
|
5.625% Senior Secured Notes due 2025 (“2025 SPL Senior Notes”) | | 2,000 |
| | 2,000 |
|
5.875% Senior Secured Notes due 2026 (“2026 SPL Senior Notes”) | | 1,500 |
| | 1,500 |
|
5.00% Senior Secured Notes due 2027 (“2027 SPL Senior Notes”) | | 1,500 |
| | 1,500 |
|
4.200% Senior Secured Notes due 2028 (“2028 SPL Senior Notes”) | | 1,350 |
| | 1,350 |
|
5.00% Senior Secured Notes due 2037 (“2037 SPL Senior Notes”) | | 800 |
| | 800 |
|
Cheniere Partners | | | | |
5.250% Senior Notes due 2025 (“2025 CQP Senior Notes”) | | 1,500 |
| | 1,500 |
|
5.625% Senior Notes due 2026 (“2026 CQP Senior Notes”) | | 1,100 |
| | 1,100 |
|
CQP Credit Facilities | | — |
| | — |
|
CCH | | | | |
7.000% Senior Secured Notes due 2024 (“2024 CCH Senior Notes”) | | 1,250 |
| | 1,250 |
|
5.875% Senior Secured Notes due 2025 (“2025 CCH Senior Notes”) | | 1,500 |
| | 1,500 |
|
5.125% Senior Secured Notes due 2027 (“2027 CCH Senior Notes”) | | 1,500 |
| | 1,500 |
|
CCH Credit Facility | | 5,647 |
| | 5,156 |
|
CCH HoldCo II | | | | |
11.0% Convertible Senior Secured Notes due 2025 (“2025 CCH HoldCo II Convertible Senior Notes”) | | 1,495 |
| | 1,455 |
|
Cheniere | | | | |
4.875% Convertible Unsecured Notes due 2021 (“2021 Cheniere Convertible Unsecured Notes”) | | 1,218 |
| | 1,218 |
|
4.25% Convertible Senior Notes due 2045 (“2045 Cheniere Convertible Senior Notes”) | | 625 |
| | 625 |
|
$1.25 billion Cheniere Revolving Credit Facility (“Cheniere Revolving Credit Facility”) | | — |
| | — |
|
Unamortized premium, discount and debt issuance costs, net | | (759 | ) | | (775 | ) |
Total long-term debt, net | | 28,726 |
| | 28,179 |
|
| | | | |
Current debt: | | | | |
$1.2 billion SPL Working Capital Facility (“SPL Working Capital Facility”) | | — |
| | — |
|
$1.2 billion CCH Working Capital Facility (“CCH Working Capital Facility”) | | — |
| | 168 |
|
Cheniere Marketing trade finance facilities | | — |
| | 71 |
|
Total current debt | | — |
| | 239 |
|
| | | | |
Total debt, net | | $ | 28,726 |
| | $ | 28,418 |
|
CHENIERE ENERGY, INC. AND SUBSIDIARIES
NOTES TO CONSOLIDATED FINANCIAL STATEMENTS—CONTINUED
(unaudited)
Credit Facilities
Below is a summary of our credit facilities outstanding as of March 31, 2019 (in millions):
|
| | | | | | | | | | | | | | | | | | | | |
| | SPL Working Capital Facility | | CQP Credit Facilities | | CCH Credit Facility | | CCH Working Capital Facility | | Cheniere Revolving Credit Facility |
Original facility size | | $ | 1,200 |
| | $ | 2,800 |
| | $ | 8,404 |
| | $ | 350 |
| | $ | 750 |
|
Incremental commitments | | — |
| | — |
| | 1,566 |
| | 850 |
| | 500 |
|
Less: | | | | | | | | | | |
Outstanding balance | | — |
| | — |
| | 5,647 |
| | — |
| | — |
|
Commitments prepaid or terminated | | — |
| | 2,685 |
| | 3,832 |
| | — |
| | — |
|
Letters of credit issued | | 421 |
| | — |
| | — |
| | 321 |
| | — |
|
Available commitment | | $ | 779 |
|
| $ | 115 |
|
| $ | 491 |
|
| $ | 879 |
|
| $ | 1,250 |
|
| | | | | | | | | | |
Interest rate | | LIBOR plus 1.75% or base rate plus 0.75% | | LIBOR plus 2.25% or base rate plus 1.25%, with 0.50% step-up as of February 25, 2019 | | LIBOR plus 1.75% or base rate plus 0.75% | | LIBOR plus 1.25% - 1.75% or base rate plus 0.25% - 0.75% | | LIBOR plus 1.75% - 2.50% or base rate plus 0.75% - 1.50% |
Weighted average interest rate of outstanding balance | | n/a | | n/a | | 4.25% | | n/a | | n/a |
Maturity date | | December 31, 2020 | | February 25, 2020 | | June 30, 2024 | | June 29, 2023 | | December 23, 2022 |
Convertible Notes
Below is a summary of our convertible notes outstanding as of March 31, 2019 (in millions):
|
| | | | | | | | | | | | |
| | 2021 Cheniere Convertible Unsecured Notes | | 2025 CCH HoldCo II Convertible Senior Notes | | 2045 Cheniere Convertible Senior Notes |
Aggregate original principal | | $ | 1,000 |
| | $ | 1,000 |
| | $ | 625 |
|
Debt component, net of discount and debt issuance costs | | $ | 1,135 |
| | $ | 1,474 |
| | $ | 310 |
|
Equity component | | $ | 209 |
| | $ | — |
| | $ | 194 |
|
Interest payment method | | Paid-in-kind |
| | Paid-in-kind (1) |
| | Cash |
|
Conversion by us (2) | | — |
| | (3) |
| | (4) |
|
Conversion by holders (2) | | (5) |
| | (6) |
| | (7) |
|
Conversion basis | | Cash and/or stock |
| | Stock |
| | Cash and/or stock |
|
Conversion value in excess of principal | | $ | — |
| | $ | — |
| | $ | — |
|
Maturity date | | May 28, 2021 |
| | May 13, 2025 |
| | March 15, 2045 |
|
Contractual interest rate | | 4.875 | % | | 11.0 | % | | 4.25 | % |
Effective interest rate (8) | | 8.4 | % | | 11.9 | % | | 9.4 | % |
Remaining debt discount and debt issuance costs amortization period (9) | | 2.2 years |
| | 1.5 years |
| | 26.0 years |
|
| |
(1) | Prior to the substantial completion of Train 2 of the CCL Project, interest will be paid entirely in kind. Following this date, the interest generally must be paid in cash; however, a portion of the interest may be paid in kind under certain specified circumstances. |
| |
(2) | Conversion is subject to various limitations and conditions. |
| |
(3) | Convertible on or after the later of March 1, 2020 and the substantial completion of Train 2 of the CCL Project, provided that our market capitalization is not less than $10.0 billion (“Eligible Conversion Date”). The conversion price is the lower of (1) a 10% discount to the average of the daily volume-weighted average price (“VWAP”) of our common stock for the 90 trading day period prior to the date notice is provided, and (2) a 10% discount to the closing price of our common stock on the trading day preceding the date notice is provided. |
CHENIERE ENERGY, INC. AND SUBSIDIARIES
NOTES TO CONSOLIDATED FINANCIAL STATEMENTS—CONTINUED
(unaudited)
| |
(4) | Redeemable at any time after March 15, 2020 at a redemption price payable in cash equal to the accreted amount of the 2045 Cheniere Convertible Senior Notes to be redeemed, plus accrued and unpaid interest, if any, to such redemption date. |
| |
(5) | Initially convertible at $93.64 (subject to adjustment upon the occurrence of certain specified events), provided that the closing price of our common stock is greater than or equal to the conversion price on the conversion date. |
| |
(6) | Convertible on or after the six-month anniversary of the Eligible Conversion Date, provided that our total market capitalization is not less than $10.0 billion, at a price equal to the average of the daily VWAP of our common stock for the 90 trading day period prior to the date on which notice of conversion is provided. |
| |
(7) | Prior to December 15, 2044, convertible only under certain circumstances as specified in the indenture; thereafter, holders may convert their notes regardless of these circumstances. The conversion rate will initially equal 7.2265 shares of our common stock per $1,000 principal amount of the 2045 Cheniere Convertible Senior Notes, which corresponds to an initial conversion price of approximately $138.38 per share of our common stock (subject to adjustment upon the occurrence of certain specified events). |
| |
(9) | 2025 CCH HoldCo II Convertible Senior Notes, which are amortized through the date they are first convertible by holders into our common stock. |
Restrictive Debt Covenants
As of March 31, 2019, each of our issuers was in compliance with all covenants related to their respective debt agreements.
Interest Expense
Total interest expense, including interest expense related to our convertible notes, consisted of the following (in millions):
|
| | | | | | | |
| Three Months Ended March 31, |
| 2019 | | 2018 |
Interest cost on convertible notes: | | | |
Interest per contractual rate | $ | 62 |
| | $ | 58 |
|
Amortization of debt discount | 10 |
| | 8 |
|
Amortization of debt issuance costs | 3 |
| | 2 |
|
Total interest cost related to convertible notes | 75 |
| | 68 |
|
Interest cost on debt and finance leases excluding convertible notes | 373 |
|
| 336 |
|
Total interest cost | 448 |
| | 404 |
|
Capitalized interest | (201 | ) | | (188 | ) |
Total interest expense, net | $ | 247 |
| | $ | 216 |
|
Fair Value Disclosures
The following table shows the carrying amount, which is net of unamortized premium, discount and debt issuance costs, and estimated fair value of our debt (in millions):
|
| | | | | | | | | | | | | | | | |
| | March 31, 2019 | | December 31, 2018 |
| | Carrying
Amount | | Estimated
Fair Value | | Carrying
Amount | | Estimated
Fair Value |
Senior notes (1) | | $ | 19,476 |
| | $ | 21,016 |
| | $ | 19,466 |
| | $ | 19,901 |
|
2037 SPL Senior Notes (2) | | 791 |
| | 858 |
| | 791 |
| | 817 |
|
Credit facilities (3) | | 5,540 |
| | 5,540 |
| | 5,294 |
| | 5,294 |
|
2021 Cheniere Convertible Unsecured Notes (2) | | 1,135 |
| | 1,291 |
| | 1,126 |
| | 1,236 |
|
2025 CCH HoldCo II Convertible Senior Notes (2) | | 1,474 |
| | 1,719 |
| | 1,432 |
| | 1,612 |
|
2045 Cheniere Convertible Senior Notes (4) | | 310 |
| | 485 |
| | 310 |
| | 431 |
|
CHENIERE ENERGY, INC. AND SUBSIDIARIES
NOTES TO CONSOLIDATED FINANCIAL STATEMENTS—CONTINUED
(unaudited)
| |
(1) | 2021 SPL Senior Notes, 2022 SPL Senior Notes, 2023 SPL Senior Notes, 2024 SPL Senior Notes, 2025 SPL Senior Notes, 2026 SPL Senior Notes, 2027 SPL Senior Notes, 2028 SPL Senior Notes, 2025 CQP Senior Notes, 2026 CQP Senior Notes, 2024 CCH Senior Notes, 2025 CCH Senior Notes and 2027 CCH Senior Notes. The Level 2 estimated fair value was based on quotes obtained from broker-dealers or market makers of these senior notes and other similar instruments. |
| |
(3) | SPL Working Capital Facility, CQP Credit Facilities, CCH Credit Facility, CCH Working Capital Facility, Cheniere Revolving Credit Facility and Cheniere Marketing trade finance facilities. The Level 3 estimated fair value approximates the principal amount because the interest rates are variable and reflective of market rates and the debt may be repaid, in full or in part, at any time without penalty. |
NOTE 11—LEASES
Our leased assets consist primarily of (1) LNG vessel time charters (“vessel charters”), (2) tug vessels, (3) office space and facilities and (4) land sites, all of which are classified as operating leases except for our tug vessels at the Corpus Christi LNG terminal, which are classified as finance leases.
ASC 842 requires a lessee to recognize leases on its balance sheet by recording a lease liability representing the obligation to make future lease payments and a right-of-use asset representing the right to use the underlying asset for the lease term. As our leases generally do not provide an implicit rate, in order to calculate the lease liability, we discounted our expected future lease payments using our relevant subsidiary’s incremental borrowing rate at the later of January 1, 2019 or the commencement date of the lease. The incremental borrowing rate is an estimate of the rate of interest that a given subsidiary would have to pay to borrow on a collateralized basis over a similar term to that of the lease term.
Many of our leases contain renewal options exercisable at our sole discretion. Options to renew a lease are included in the lease term and recognized as part of the right-of-use asset and lease liability only to the extent they are reasonably certain to be exercised, such as when necessary to satisfy obligations that existed at the execution of the lease or when the non-renewal would otherwise result in an economic penalty.
We have elected the practical expedient to omit leases with an initial term of 12 months or less (“short-term lease”) from recognition on the balance sheet. We recognize short-term lease payments on a straight-line basis over the lease term and variable payments under short-term leases in the period in which the obligation is incurred.
Certain of our leases contain non-lease components which are not separated from the lease components when calculating the right-of-use asset and lease liability per our use of the practical expedient to combine both components of an arrangement for all classes of leased assets.
Certain of our leases also contain variable payments, such as inflation, that are not included when calculating the right-of-use asset and lease liability unless the payments are in-substance fixed.
We recognize lease expense for operating leases on a straight-line basis over the lease term. We recognize lease expense for finance leases as the sum of the amortization of the right-of-use assets on a straight-line basis and the interest on lease liabilities using the effective interest method over the lease term.
CHENIERE ENERGY, INC. AND SUBSIDIARIES
NOTES TO CONSOLIDATED FINANCIAL STATEMENTS—CONTINUED
(unaudited)
The following table shows the classification and location of our right-of-use assets and lease liabilities on our Consolidated Balance Sheets (in millions):
|
| | | | | |
| Consolidated Balance Sheet Location | | March 31, 2019 |
Right-of-use assets—Operating | Operating lease assets, net | | $ | 542 |
|
Right-of-use assets—Financing | Property, plant and equipment, net | | 58 |
|
Total right-of-use assets | | | $ | 600 |
|
| | | |
Current operating lease liabilities | Current operating lease liabilities | | $ | 325 |
|
Current finance lease liabilities | Other current liabilities | | 1 |
|
Non-current operating lease liabilities | Non-current operating lease liabilities | | 207 |
|
Non-current finance lease liabilities | Non-current finance lease liabilities | | 58 |
|
Total lease liabilities | | | $ | 591 |
|
The following table shows the classification and location of our lease cost on our Consolidated Statements of Operations (in millions):
|
| | | | | |
| Consolidated Statement of Operations Location | | Three Months Ended March 31, 2019 |
Operating lease cost (1) | Operating costs and expenses (2) | | $ | 137 |
|
Finance lease cost: | | | |
Amortization of right-of-use assets | Depreciation and amortization expense | | 1 |
|
Interest on lease liabilities | Interest expense, net of capitalized interest | | 2 |
|
Total lease cost | | | $ | 140 |
|
| |
(1) | $47 million of short-term lease costs and $5 million of variable lease costs incurred during the three months ended March 31, 2019. |
Future annual minimum lease payments for operating and finance leases as of March 31, 2019 are as follows (in millions):
|
| | | | | | | |
Years Ending December 31, | Operating Leases (1) | | Finance Leases |
2019 | $ | 276 |
| | $ | 8 |
|
2020 | 138 |
| | 10 |
|
2021 | 31 |
| | 10 |
|
2022 | 18 |
| | 10 |
|
2023 | 18 |
| | 10 |
|
Thereafter | 167 |
| | 146 |
|
Total lease payments | 648 |
| | 194 |
|
Less: Interest | (116 | ) | | (135 | ) |
Present value of lease liabilities | $ | 532 |
| | $ | 59 |
|
| |
(1) | $1.6 billion of legally binding minimum lease payments for vessel charters which were previously executed but will commence primarily between 2020 and 2021 and have lease terms of up to seven years. |
CHENIERE ENERGY, INC. AND SUBSIDIARIES
NOTES TO CONSOLIDATED FINANCIAL STATEMENTS—CONTINUED
(unaudited)
Future annual minimum lease payments for operating and capital leases as of December 31, 2018, prepared in accordance with accounting standards prior to the adoption of ASC 842, were as follows (in millions):
|
| | | | | | | |
Years Ending December 31, | Operating Leases (1) | | Capital Leases (2) |
2019 (3) | $ | 380 |
| | $ | 5 |
|
2020 | 184 |
| | 5 |
|
2021 | 238 |
| | 5 |
|
2022 | 264 |
| | 5 |
|
2023 | 264 |
| | 5 |
|
Thereafter | 999 |
| | 73 |
|
Total lease payments | 2,329 |
| | 98 |
|
Less: Interest | — |
| | (39 | ) |
Present value of lease liabilities | $ | 2,329 |
| | $ | 59 |
|
| |
(1) | . Also includes $79 million in payments for short-term leases and $1.6 billion in payments for LNG vessel charters which were previously executed but will commence primarily between 2020 and 2021. |
| |
(3) | $43 million in aggregate payments we will receive from our LNG vessel subcharters. |
The following table shows the weighted-average remaining lease term (in years) and the weighted-average discount rate for our operating leases and finance leases:
|
| | | |
| March 31, 2019 |
| Operating Leases | | Finance Leases |
Weighted-average remaining lease term (in years) | 6.8 | | 19.5 |
Weighted-average discount rate (1) | 5.4% | | 16.2% |
The following table includes other quantitative information for our operating and finance leases (in millions):
|
| | | |
| Three Months Ended March 31, 2019 |
Cash paid for amounts included in the measurement of lease liabilities: | |
Operating cash flows from operating leases | $ | 90 |
|
Operating cash flows from finance leases | 2 |
|
Financing cash flows from finance leases | — |
|
Right-of-use assets obtained in exchange for new operating lease liabilities | 64 |
|
LNG Vessel Subcharters
From time to time, we sublease certain LNG vessels under charter to third parties while retaining our existing obligation to the original lessor. We have elected the practical expedient for lessors to combine lease and non-lease components and since the lease component is the predominant component of each arrangement, these subleases are accounted for as operating leases. The subleases have lease terms of up to one year and many contain short-term renewal options exercisable at the discretion of the third party. As of March 31, 2019, we had $32 million in future minimum sublease payments to be received from LNG vessel subcharters, which will be recognized entirely within 2019. We recognize fixed sublease income on a straight-line basis over the lease term of the sublease while variable sublease income is recognized when earned. We recognized sublease income of $37 million, including $5 million of variable lease payments, in other revenues on our Consolidated Statements of Operations during the three months ended March 31, 2019.
CHENIERE ENERGY, INC. AND SUBSIDIARIES
NOTES TO CONSOLIDATED FINANCIAL STATEMENTS—CONTINUED
(unaudited)
NOTE 12—REVENUES FROM CONTRACTS WITH CUSTOMERS
The following table represents a disaggregation of revenue earned from contracts with customers during the three months ended March 31, 2019 and 2018 (in millions):
|
| | | | | | | |
| Three Months Ended March 31, |
| 2019 | | 2018 |
LNG revenues | $ | 2,068 |
| | $ | 2,162 |
|
Regasification revenues | 66 |
| | 65 |
|
Other revenues | 11 |
| | 10 |
|
Other—related party | 4 |
| | 1 |
|
Total revenues from customers | 2,149 |
| | 2,238 |
|
Derivative gains and other revenues (1) | 112 |
| | 4 |
|
Total revenues | $ | 2,261 |
| | $ | 2,242 |
|
| |
(1) | $75 million and $4 million in net derivative gains for the three months ended March 31, 2019 and 2018, respectively, and $37 million in revenues from LNG vessel subcharters for the three months ended March 31, 2019. See Note 6—Derivative Instruments for additional information about our derivatives and Note 11—Leases for additional information about our subleases. |
Contract Assets and Liabilities
The following table shows our contract assets, which we classify as other non-current assets, net on our Consolidated Balance Sheets (in millions):
|
| | | | | | | | |
| | March 31, | | December 31, |
| | 2019 | | 2018 |
Contract assets | | $ | 5 |
| | $ | — |
|
Contract assets represent our right to consideration for transferring goods or services to the customer under the terms of a sales contract when the associated consideration is not yet due. Changes in contract assets during the three months ended March 31, 2019 were primarily attributable to revenue recognized due to the delivery of LNG under certain SPAs for which the associated consideration was not yet due.
The following table reflects the changes in our contract liabilities, which we classify as deferred revenue on our Consolidated Balance Sheets (in millions):
|
| | | |
| Three Months Ended March 31, 2019 |
Deferred revenues, beginning of period | $ | 139 |
|
Cash received but not yet recognized | 108 |
|
Revenue recognized from prior period deferral | (139 | ) |
Deferred revenues, end of period | $ | 108 |
|
Transaction Price Allocated to Future Performance Obligations
Because many of our sales contracts have long-term durations, we are contractually entitled to significant future consideration which we have not yet recognized as revenue. The following table discloses the aggregate amount of the transaction price that is allocated to performance obligations that have not yet been satisfied as of March 31, 2019 and December 31, 2018:
|
| | | | | | | | | | | | |
| | March 31, 2019 | | December 31, 2018 |
| | Unsatisfied Transaction Price (in billions) | | Weighted Average Recognition Timing (years) (1) | | Unsatisfied Transaction Price (in billions) | | Weighted Average Recognition Timing (years) (1) |
LNG revenues | | $ | 106.2 |
| | 11 | | $ | 106.6 |
| | 11 |
Regasification revenues | | 2.6 |
| | 6 | | 2.6 |
| | 6 |
Total revenues | | $ | 108.8 |
| |
| | $ | 109.2 |
| | |
CHENIERE ENERGY, INC. AND SUBSIDIARIES
NOTES TO CONSOLIDATED FINANCIAL STATEMENTS—CONTINUED
(unaudited)
We have elected the following exemptions which omit certain potential future sources of revenue from the table above:
| |
(1) | We omit from the table above all performance obligations that are part of a contract that has an original expected duration of one year or less. |
| |
(2) | We omit from the table above all variable consideration that is allocated entirely to a wholly unsatisfied performance obligation or to a wholly unsatisfied promise to transfer a distinct good or service that forms part of a single performance obligation when that performance obligation qualifies as a series. The table above excludes substantially all variable consideration under our SPAs and TUAs. The amount of revenue from variable fees that is not included in the transaction price will vary based on the future prices of Henry Hub throughout the contract terms, to the extent customers elect to take delivery of their LNG, and adjustments to the consumer price index. Certain of our contracts contain additional variable consideration based on the outcome of contingent events and the movement of various indexes. We have not included such variable consideration in the transaction price to the extent the consideration is considered constrained due to the uncertainty of ultimate pricing and receipt. Approximately 58% and 56% of our LNG revenues from contracts with a duration of over one year during the three months ended March 31, 2019 and 2018, respectively, and approximately 3% of our regasification revenues during each of the three months ended March 31, 2019 and 2018 were related to variable consideration received from customers. |
We have entered into contracts to sell LNG that are conditioned upon one or both of the parties achieving certain milestones such as reaching FID on a certain liquefaction Train, obtaining financing or achieving substantial completion of a Train and any related facilities. These contracts are considered completed contracts for revenue recognition purposes and are included in the transaction price above when the conditions are considered probable of being met.
NOTE 13—INCOME TAXES
We recorded an income tax provision of $3 million and $15 million during the three months ended March 31, 2019 and 2018, respectively. Changes in the income tax recorded between comparative periods are primarily attributable to changes in the income earned and tax transfer pricing applied to our U.K. integrated marketing function.
The effective tax rates during the three months ended March 31, 2019 and 2018 were lower than the 21% federal statutory rate during the 2019 and 2018 interim periods primarily as a result of maintaining a valuation allowance against our federal and state net deferred tax assets. Due to historical losses and other available evidence related to our ability to generate taxable income, we continue to maintain a valuation allowance against our federal and state net deferred tax assets at March 31, 2019.
NOTE 14—SHARE-BASED COMPENSATION
We have granted restricted stock shares, restricted stock units, performance stock units and phantom units to employees and non-employee directors under the 2011 Incentive Plan, as amended (the “2011 Plan”) and the 2015 Employee Inducement Incentive Plan.
For the three months ended March 31, 2019, we granted 1.3 million restricted stock units and 0.2 million performance stock units at target performance under the 2011 Plan to certain employees. Restricted stock units are stock awards that vest over a service period of three years and entitle the holder to receive shares of our common stock upon vesting, subject to restrictions on transfer and to a risk of forfeiture if the recipient terminates employment with us prior to the lapse of the restrictions. Performance stock units provide for cliff vesting after a period of three years with payouts based on metrics dependent upon market and performance achieved over the period from January 1, 2019 through December 31, 2021 compared to pre-established performance targets. The settlement amounts of the awards are based on market and performance metrics which include cumulative distributable cash flow per share, and in certain circumstances, total shareholder return (“TSR”) of our common stock. Where applicable, the compensation for performance stock units is based on fair value assigned to the market metric of TSR using a Monte Carlo model upon grant, which remains constant through the vesting period, and a performance metric, which will vary due to changing estimates regarding the expected achievement of the performance metric of cumulative distributable cash flow per share. The number of shares that may be earned at the end of the vesting period ranges from 25% to 300% of the target award amount if the threshold
CHENIERE ENERGY, INC. AND SUBSIDIARIES
NOTES TO CONSOLIDATED FINANCIAL STATEMENTS—CONTINUED
(unaudited)
performance is met. Both restricted stock units and performance stock units will be settled in Cheniere common stock (on a one-for-one basis) and are classified as equity awards.
Total share-based compensation consisted of the following (in millions):
|
| | | | | | | |
| Three Months Ended March 31, |
| 2019 | | 2018 |
Share-based compensation costs, pre-tax: | | | |
Equity awards | $ | 29 |
| | $ | 17 |
|
Liability awards | 3 |
| | 17 |
|
Total share-based compensation | 32 |
|
| 34 |
|
Capitalized share-based compensation | (4 | ) | | (6 | ) |
Total share-based compensation expense | $ | 28 |
|
| $ | 28 |
|
Tax benefit associated with share-based compensation expense | $ | 1 |
| | $ | 2 |
|
NOTE 15—NET INCOME PER SHARE ATTRIBUTABLE TO COMMON STOCKHOLDERS
Basic net income per share attributable to common stockholders (“EPS”) excludes dilution and is computed by dividing net income attributable to common stockholders by the weighted average number of common shares outstanding during the period. Diluted EPS reflects potential dilution and is computed by dividing net income attributable to common stockholders by the weighted average number of common shares outstanding during the period increased by the number of additional common shares that would have been outstanding if the potential common shares had been issued. The dilutive effect of unvested stock is calculated using the treasury-stock method and the dilutive effect of convertible securities is calculated using the if-converted method.
The following table reconciles basic and diluted weighted average common shares outstanding for the three months ended March 31, 2019 and 2018 (in millions, except per share data):
|
| | | | | | | | |
| | Three Months Ended March 31, |
| | 2019 | | 2018 |
Weighted average common shares outstanding: | | | | |
Basic | | 257.1 |
| | 235.5 |
|
Dilutive unvested stock | | 1.4 |
| | 2.5 |
|
Diluted | | 258.5 |
| | 238.0 |
|
| | | | |
Basic net income per share attributable to common stockholders | | $ | 0.55 |
| | $ | 1.52 |
|
Diluted net income per share attributable to common stockholders | | $ | 0.54 |
| | $ | 1.50 |
|
Potentially dilutive securities that were not included in the diluted net income per share computations because their effects would have been anti-dilutive were as follows (in millions):
|
| | | | | | |
| | Three Months Ended March 31, |
| | 2019 | | 2018 |
Unvested stock (1) | | 2.4 |
| | 2.0 |
|
Convertible notes (2) | | 17.7 |
| | 17.1 |
|
Total potentially dilutive common shares | | 20.1 |
| | 19.1 |
|
| |
(1) | 0.6 million shares and 0.4 million shares for the three months ended March 31, 2019 and 2018, respectively, of unvested stock because the performance conditions had not yet been satisfied as of March 31, 2019 and 2018, respectively. |
| |
(2) | 2021 Cheniere Convertible Unsecured Notes and the 2045 Cheniere Convertible Senior Notes. There were no shares included in the computation of diluted net income per share for the 2025 CCH HoldCo II Convertible Senior Notes because substantive non-market-based contingencies underlying the eligible conversion date have not been met as of March 31, 2019. |
CHENIERE ENERGY, INC. AND SUBSIDIARIES
NOTES TO CONSOLIDATED FINANCIAL STATEMENTS—CONTINUED
(unaudited)
NOTE 16—COMMITMENTS AND CONTINGENCIES
We have various contractual obligations which are recorded as liabilities in our Consolidated Financial Statements. Other items, such as certain purchase commitments and other executed contracts which do not meet the definition of a liability as of March 31, 2019, are not recognized as liabilities but require disclosures in our Consolidated Financial Statements.
Legal Proceedings
We may in the future be involved as a party to various legal proceedings, which are incidental to the ordinary course of business. We regularly analyze current information and, as necessary, provide accruals for probable liabilities on the eventual disposition of these matters.
Parallax Litigation
In 2015, our wholly owned subsidiary, Cheniere LNG Terminals, LLC (“CLNGT”), entered into discussions with Parallax Enterprises, LLC (“Parallax Enterprises”) regarding the potential joint development of two liquefaction plants in Louisiana (the “Potential Liquefaction Transactions”). While the parties negotiated regarding the Potential Liquefaction Transactions, CLNGT loaned Parallax Enterprises approximately $46 million, as reflected in a secured note dated April 23, 2015, as amended on June 30, 2015, September 30, 2015 and November 4, 2015 (the “Secured Note”). The Secured Note was secured by all assets of Parallax Enterprises and its subsidiary entities. On June 30, 2015, Parallax Enterprises’ parent entity, Parallax Energy LLC (“Parallax Energy”), executed a Pledge and Guarantee Agreement further securing repayment of the Secured Note by providing a parent guaranty and a pledge of all of the equity of Parallax Enterprises in satisfaction of the Secured Note (the “Pledge Agreement”). CLNGT and Parallax Enterprises never executed a definitive agreement to pursue the Potential Liquefaction Transactions. The Secured Note matured on December 11, 2015, and Parallax Enterprises failed to make payment. On February 3, 2016, CLNGT filed an action against Parallax Energy, Parallax Enterprises and certain of Parallax Enterprises’ subsidiary entities, styled Cause No. 4:16-cv-00286, Cheniere LNG Terminals, LLC v. Parallax Energy LLC, et al., in the United States District Court for the Southern District of Texas (the “Texas Federal Suit”). CLNGT asserted claims in the Texas Federal Suit for (1) recovery of all amounts due under the Secured Note and (2) declaratory relief establishing that CLNGT is entitled to enforce its rights under the Secured Note and Pledge Agreement in accordance with each instrument’s terms and that CLNGT has no obligations of any sort to Parallax Enterprises concerning the Potential Liquefaction Transactions. On March 11, 2016, Parallax Enterprises and the other defendants in the Texas Federal Suit moved to dismiss the suit for lack of subject matter jurisdiction. On August 2, 2016, the court denied the defendants’ motion to dismiss without prejudice and permitted the parties to pursue jurisdictional discovery.
On March 11, 2016, Parallax Enterprises filed a suit against us and CLNGT styled Civil Action No. 62-810, Parallax Enterprises LLP v. Cheniere Energy, Inc. and Cheniere LNG Terminals, LLC, in the 25th Judicial District Court of Plaquemines Parish, Louisiana (the “Louisiana Suit”), wherein Parallax Enterprises asserted claims for breach of contract, fraudulent inducement, negligent misrepresentation, detrimental reliance, unjust enrichment and violation of the Louisiana Unfair Trade Practices Act. Parallax Enterprises predicated its claims in the Louisiana Suit on an allegation that we and CLNGT breached a purported agreement to jointly develop the Potential Liquefaction Transactions. Parallax Enterprises sought $400 million in alleged economic damages and rescission of the Secured Note. On April 15, 2016, we and CLNGT removed the Louisiana Suit to the United States District Court for the Eastern District of Louisiana, which subsequently transferred the Louisiana Suit to the United States District Court for the Southern District of Texas, where it was assigned Civil Action No. 4:16-cv-01628 and transferred to the same judge presiding over the Texas Federal Suit for coordinated handling. On August 22, 2016, Parallax Enterprises voluntarily dismissed all claims asserted against CLNGT and us in the Louisiana Suit without prejudice to refiling.
On July 27, 2017, the Parallax entities named as defendants in the Texas Federal Suit reurged their motion to dismiss and simultaneously filed counterclaims against CLNGT and third party claims against us for breach of contract, breach of fiduciary duty, promissory estoppel, quantum meruit and fraudulent inducement of the Secured Note and Pledge Agreement, based on substantially the same factual allegations Parallax Enterprises made in the Louisiana Suit. These Parallax entities also simultaneously filed an action styled Cause No. 2017-49685, Parallax Enterprises, LLC, et al. v. Cheniere Energy, Inc., et al., in the 61st District Court of Harris County, Texas (the “Texas State Suit”), which asserts substantially the same claims these entities asserted in the Texas Federal Suit. On July 31, 2017, CLNGT withdrew its opposition to the dismissal of the Texas Federal Suit without prejudice on jurisdictional grounds and the federal court subsequently dismissed the Texas Federal Suit without prejudice. We and CLNGT simultaneously filed an answer and counterclaims in the Texas State Suit, asserting the same claims CLNGT had previously asserted in the Texas Federal Suit. Additionally, CLNGT filed third party claims against Parallax principals Martin
CHENIERE ENERGY, INC. AND SUBSIDIARIES
NOTES TO CONSOLIDATED FINANCIAL STATEMENTS—CONTINUED
(unaudited)
Houston, Christopher Bowen Daniels, Howard Candelet and Mark Evans, as well as Tellurian Investments, Inc., Driftwood LNG, LLC, Driftwood LNG Pipeline LLC and Tellurian Services LLC, formerly known as Parallax Services LLC, including claims for tortious interference with CLNGT’s collateral rights under the Secured Note and Pledge Agreement, fraudulent transfer, conspiracy/aiding and abetting. Discovery in the Texas State Suit is ongoing. Trial is currently set for October 2019.
On February 15, 2019, we filed an action with CLNGT against Charif Souki, our former Chairman of the Board and Chief Executive Officer, styled, Cause No. 2019-11529, Cheniere Energy, Inc. and Cheniere LNG Terminals, LLC v. Charif Souki, in the 55th District Court of Harris County, Texas, which asserts claims of breach of fiduciary duties, fraudulent transfer, tortious interference with CLNGT’s collateral rights under the Secured Note and Pledge Agreement and conspiracy/aiding and abetting.
We do not expect that the resolution of any of the foregoing litigation will have a material adverse impact on our financial results.
NOTE 17—CUSTOMER CONCENTRATION
The following table shows customers with revenues of 10% or greater of total revenues from external customers and customers with accounts receivable balances of 10% or greater of total accounts receivable from external customers:
|
| | | | | | | | |
| | Percentage of Total Revenues from External Customers | | Percentage of Accounts Receivable from External Customers |
| | Three Months Ended March 31, | | March 31, | | December 31, |
| | 2019 | | 2018 | | 2019 | | 2018 |
Customer A | | 20% | | 17% | | 18% | | 21% |
Customer B | | 12% | | 12% | | 11% | | 14% |
Customer C | | 12% | | 24% | | 12% | | 18% |
Customer D | | 14% | | * | | * | | * |
Customer E | | * | | —% | | 11% | | —% |
Customer F | | * | | * | | * | | 10% |
* Less than 10%
NOTE 18—SUPPLEMENTAL CASH FLOW INFORMATION
The following table provides supplemental disclosure of cash flow information (in millions):
|
| | | | | | | | |
| | Three Months Ended March 31, |
| | 2019 | | 2018 |
Cash paid during the period for interest on debt and finance leases, net of amounts capitalized | | $ | 108 |
| | $ | 282 |
|
The balance in property, plant and equipment, net funded with accounts payable and accrued liabilities was $509 million and $310 million as of March 31, 2019 and 2018, respectively.
See Note 11—Leases for our supplemental cash flow information related to our leases.
| |
ITEM 2. | MANAGEMENT’S DISCUSSION AND ANALYSIS OF FINANCIAL CONDITION AND RESULTS OF OPERATIONS |
Information Regarding Forward-Looking Statements
This quarterly report contains certain statements that are, or may be deemed to be, “forward-looking statements” within the meaning of Section 27A of the Securities Act of 1933, as amended, and Section 21E of the Securities Exchange Act of 1934, as amended (the “Exchange Act”). All statements, other than statements of historical or present facts or conditions, included herein or incorporated herein by reference are “forward-looking statements.” Included among “forward-looking statements” are, among other things:
| |
• | statements that we expect to commence or complete construction of our proposed LNG terminals, liquefaction facilities, pipeline facilities or other projects, or any expansions or portions thereof, by certain dates, or at all; |
| |
• | statements regarding future levels of domestic and international natural gas production, supply or consumption or future levels of LNG imports into or exports from North America and other countries worldwide or purchases of natural gas, regardless of the source of such information, or the transportation or other infrastructure or demand for and prices related to natural gas, LNG or other hydrocarbon products; |
| |
• | statements regarding any financing transactions or arrangements, or our ability to enter into such transactions; |
| |
• | statements relating to the construction of our Trains and pipelines, including statements concerning the engagement of any EPC contractor or other contractor and the anticipated terms and provisions of any agreement with any EPC or other contractor, and anticipated costs related thereto; |
| |
• | statements regarding any SPA or other agreement to be entered into or performed substantially in the future, including any revenues anticipated to be received and the anticipated timing thereof, and statements regarding the amounts of total LNG regasification, natural gas liquefaction or storage capacities that are, or may become, subject to contracts; |
| |
• | statements regarding counterparties to our commercial contracts, construction contracts, and other contracts; |
| |
• | statements regarding our planned development and construction of additional Trains and pipelines, including the financing of such Trains or pipelines; |
| |
• | statements that our Trains, when completed, will have certain characteristics, including amounts of liquefaction capacities; |
| |
• | statements regarding our business strategy, our strengths, our business and operation plans or any other plans, forecasts, projections, or objectives, including anticipated revenues, capital expenditures, maintenance and operating costs and cash flows, any or all of which are subject to change; |
| |
• | statements regarding legislative, governmental, regulatory, administrative or other public body actions, approvals, requirements, permits, applications, filings, investigations, proceedings or decisions; |
| |
• | statements regarding marketing of volumes expected to be made available to our integrated marketing function; and |
| |
• | any other statements that relate to non-historical or future information. |
All of these types of statements, other than statements of historical or present facts or conditions, are forward-looking statements. In some cases, forward-looking statements can be identified by terminology such as “may,” “will,” “could,” “should,” “achieve,” “anticipate,” “believe,” “contemplate,” “continue,” “estimate,” “expect,” “intend,” “plan,” “potential,” “predict,” “project,” “pursue,” “target,” the negative of such terms or other comparable terminology. The forward-looking statements contained in this quarterly report are largely based on our expectations, which reflect estimates and assumptions made by our management. These estimates and assumptions reflect our best judgment based on currently known market conditions and other factors. Although we believe that such estimates are reasonable, they are inherently uncertain and involve a number of risks and uncertainties beyond our control. In addition, assumptions may prove to be inaccurate. We caution that the forward-looking statements contained in this quarterly report are not guarantees of future performance and that such statements may not be realized or the forward-looking statements or events may not occur. Actual results may differ materially from those anticipated or implied in forward-looking statements as a result of a variety of factors described in this quarterly report and in the other reports and other information that we file with the SEC, including those discussed under “Risk Factors” in our annual report on Form 10-K for the year ended December 31, 2018. All forward-looking statements attributable to us or persons acting on our behalf are expressly qualified in their entirety by these risk factors. These forward-looking statements speak only as of the date made, and other than
as required by law, we undertake no obligation to update or revise any forward-looking statement or provide reasons why actual results may differ, whether as a result of new information, future events or otherwise.
Introduction
The following discussion and analysis presents management’s view of our business, financial condition and overall performance and should be read in conjunction with our Consolidated Financial Statements and the accompanying notes. This information is intended to provide investors with an understanding of our past performance, current financial condition and outlook for the future. Our discussion and analysis includes the following subjects:
| |
• | Overview of Significant Events |
| |
• | Liquidity and Capital Resources |
| |
• | Off-Balance Sheet Arrangements |
| |
• | Summary of Critical Accounting Estimates |
| |
• | Recent Accounting Standards |
Overview of Business
Cheniere, a Delaware corporation, is a Houston-based energy company primarily engaged in LNG-related businesses. Our vision is to provide clean, secure and affordable energy to the world, while responsibly delivering a reliable, competitive and integrated source of LNG, in a safe and rewarding work environment. We own and operate the Sabine Pass LNG terminal in Louisiana through our ownership interest in and management agreements with Cheniere Partners, which is a publicly traded limited partnership that we created in 2007. As of March 31, 2019, we owned 100% of the general partner interest and 48.6% of the limited partner interest in Cheniere Partners. We are currently developing and constructing two natural gas liquefaction and export facilities. The liquefaction of natural gas into LNG allows it to be shipped economically from areas of the world where natural gas is abundant and inexpensive to produce to other areas where natural gas demand and infrastructure exist to economically justify the use of LNG.
The Sabine Pass LNG terminal is located in Cameron Parish, Louisiana, on the Sabine-Neches Waterway less than four miles from the Gulf Coast. Cheniere Partners is developing, constructing and operating natural gas liquefaction facilities (the “SPL Project”) at the Sabine Pass LNG terminal adjacent to the existing regasification facilities through a wholly owned subsidiary, SPL. Cheniere Partners plans to construct up to six Trains, which are in various stages of development, construction and operations. Trains 1 through 5 are operational and early works have begun for Train 6 under limited notices to proceed ahead of an anticipated positive final investment decision (“FID”). Each Train is expected to have a nominal production capacity, which is prior to adjusting for planned maintenance, production reliability, potential overdesign and debottlenecking opportunities, of approximately 4.5 mtpa of LNG per Train, and run rate adjusted nominal production capacity of approximately 4.5 to 4.9 mtpa of LNG per Train. The Sabine Pass LNG terminal has operational regasification facilities owned by Cheniere Partners’ wholly owned subsidiary, SPLNG, that include pre-existing infrastructure of five LNG storage tanks with aggregate capacity of approximately 16.9 Bcfe, two marine berths that can each accommodate vessels with nominal capacity of up to 266,000 cubic meters and vaporizers with regasification capacity of approximately 4.0 Bcf/d. Cheniere Partners also owns a 94-mile pipeline that interconnects the Sabine Pass LNG terminal with a number of large interstate pipelines through a wholly owned subsidiary, CTPL.
We are developing and constructing a second natural gas liquefaction and export facility at the Corpus Christi LNG terminal near Corpus Christi, Texas, and operate a 23-mile natural gas supply pipeline that interconnects the Corpus Christi LNG terminal with several interstate and intrastate natural gas pipelines (the “Corpus Christi Pipeline” and together with the liquefaction facilities, the “CCL Project”) through our wholly owned subsidiaries CCL and CCP, respectively. The CCL Project is being developed in stages with the first phase being three Trains (“Phase 1”), with expected aggregate nominal production capacity, which is prior to adjusting for planned maintenance, production reliability, potential overdesign and debottlenecking opportunities, of approximately 13.5 mtpa of LNG, three LNG storage tanks with aggregate capacity of approximately 10.1 Bcfe and two marine berths that can each accommodate vessels with nominal capacity of up to 266,000 cubic meters. The first stage (“Stage 1”) includes Trains 1 and 2, two LNG storage tanks, one complete marine berth and a second partial berth and all of the CCL Project’s necessary infrastructure
facilities. The second stage (“Stage 2”) includes Train 3, one LNG storage tank and the completion of the second partial berth. Train 1 is operational, Train 2 is undergoing commissioning and Train 3 is under construction.
Additionally, separate from the CCH Group, we are developing an expansion of the Corpus Christi LNG terminal adjacent to the CCL Project (“Corpus Christi Stage 3”) and filed an application with FERC in June 2018 for seven midscale Trains with an expected aggregate nominal production capacity of approximately 9.5 mtpa and one LNG storage tank.
We have made an equity investment in Midship Holdings, LLC (“Midship Holdings”), which manages the business and affairs of Midship Pipeline Company, LLC (“Midship Pipeline”). Midship Pipeline is constructing a pipeline (the “Midship Project”) with expected capacity of up to 1.44 million Dekatherms per day that will connect new gas production in the Anadarko Basin to Gulf Coast markets, including markets serving the SPL Project and the CCL Project. Construction of the Midship Project commenced in the first quarter of 2019.
We remain focused on expansion of our existing sites by leveraging existing infrastructure. We continue to consider development of other projects, including infrastructure projects in support of natural gas supply and LNG demand, which, among other things, will require acceptable commercial and financing arrangements before we can make an FID.
Overview of Significant Events
Our significant accomplishments since January 1, 2019 and through the filing date of this Form 10-Q include the following:
Strategic
| |
• | In March 2019, we received a positive Environmental Assessment from FERC relating to Corpus Christi Stage 3. |
| |
• | In February 2019, Midship Pipeline, in which we hold an indirect equity interest, issued full notice to proceed to construct the Midship natural gas pipeline and related compression and interconnect facilities following receipt of final Notice to Proceed from the FERC and obtaining financing to construct the Midship Project. |
Operational
| |
• | As of April 30, 2019, over 650 cumulative LNG cargoes have been produced, loaded and exported from the SPL Project and the CCL Project, with deliveries to 32 countries and regions worldwide. |
| |
• | In February 2019 and March 2019, CCL and SPL achieved substantial completion of Train 1 of the CCL Project and Train 5 of the SPL Project, respectively, and commenced operating activities. |
Financial
| |
• | In March 2019, the date of first commercial delivery was reached under the 20-year SPA with BG Gulf Coast LNG, LLC relating to Train 4 of the SPL Project. |
Liquidity and Capital Resources
Although results are consolidated for financial reporting, Cheniere, Cheniere Partners, SPL and the CCH Group operate with independent capital structures. We expect the cash needs for at least the next twelve months will be met for each of these independent capital structures as follows:
| |
• | SPL through project debt and borrowings and operating cash flows; |
| |
• | Cheniere Partners through operating cash flows from SPLNG, SPL and CTPL and debt or equity offerings; |
| |
• | CCH Group through operating cash flows from CCL and CCP, project debt and borrowings and equity contributions from Cheniere; and |
| |
• | Cheniere through project financing, existing unrestricted cash, debt and equity offerings by us or our subsidiaries, operating cash flows, services fees from our subsidiaries and distributions from our investment in Cheniere Partners. |
The following table provides a summary of our liquidity position at March 31, 2019 and December 31, 2018 (in millions):
|
| | | | | | | |
| March 31, | | December 31, |
| 2019 | | 2018 |
Cash and cash equivalents | $ | 1,093 |
| | $ | 981 |
|
Restricted cash designated for the following purposes: | | | |
SPL Project | 621 |
| | 756 |
|
Cheniere Partners and cash held by guarantor subsidiaries | 676 |
| | 785 |
|
CCL Project | 218 |
| | 289 |
|
Other | 403 |
| | 345 |
|
Available commitments under the following credit facilities: | | | |
$1.2 billion SPL Working Capital Facility (“SPL Working Capital Facility”) | 779 |
| | 775 |
|
Cheniere Partners’ Credit Facilities (“CQP Credit Facilities”) | 115 |
| | 115 |
|
Amended and restated CCH Credit Facility (“CCH Credit Facility”) | 491 |
| | 982 |
|
$1.2 billion CCH Working Capital Facility (“CCH Working Capital Facility”) | 879 |
| | 716 |
|
$1.25 billion Cheniere Revolving Credit Facility (“Cheniere Revolving Credit Facility”) | 1,250 |
| | 1,250 |
|
For additional information regarding our debt agreements, see Note 10—Debt of our Notes to Consolidated Financial Statements in this quarterly report and Note 12—Debt of our Notes to Consolidated Financial Statements in our annual report on Form 10-K for the year ended December 31, 2018.
Cheniere
Convertible Notes
In November 2014, we issued an aggregate principal amount of $1.0 billion of Convertible Unsecured Notes due 2021 (the “2021 Cheniere Convertible Unsecured Notes”). The 2021 Cheniere Convertible Unsecured Notes are convertible at the option of the holder into our common stock at the then applicable conversion rate, provided that the closing price of our common stock is greater than or equal to the conversion price on the date of conversion. In March 2015, we issued $625 million aggregate principal amount of 4.25% Convertible Senior Notes due 2045 (the “2045 Cheniere Convertible Senior Notes”). We have the right, at our option, at any time after March 15, 2020, to redeem all or any part of the 2045 Cheniere Convertible Senior Notes at a redemption price equal to the accreted amount of the 2045 Cheniere Convertible Senior Notes to be redeemed, plus accrued and unpaid interest, if any, to such redemption date. We have the option to satisfy the conversion obligation for the 2021 Cheniere Convertible Unsecured Notes and the 2045 Cheniere Convertible Senior Notes with cash, common stock or a combination thereof.
Cheniere Revolving Credit Facility
In December 2018, we amended and restated the Cheniere Revolving Credit Facility to increase total commitments under the Cheniere Revolving Credit Facility from $750 million to $1.25 billion. The Cheniere Revolving Credit Facility is intended to fund, through loans and letters of credit, equity capital contributions to CCH HoldCo II and its subsidiaries for the development of the CCL Project and, provided that certain conditions are met, for general corporate purposes.
The Cheniere Revolving Credit Facility matures on December 13, 2022 and contains representations, warranties and affirmative and negative covenants customary for companies like us with lenders of the type participating in the Cheniere Revolving Credit Facility that limit our ability to make restricted payments, including distributions, unless certain conditions are satisfied, as well as limitations on indebtedness, guarantees, hedging, liens, investments and affiliate transactions. Under the Cheniere Revolving Credit Facility, we are required to ensure that the sum of our unrestricted cash and the amount of undrawn commitments under the Cheniere Revolving Credit Facility is at least equal to the lesser of (1) 20% of the commitments under the Cheniere Revolving Credit Facility and (2) $200 million (the “Liquidity Covenant”).
From and after the time at which certain specified conditions are met (the “Trigger Point”), we will have increased flexibility under the Cheniere Revolving Credit Facility to, among other things, (1) make restricted payments and (2) raise incremental commitments. The Trigger Point will occur once (1) completion has occurred for each of Train 1 of the CCL Project (as defined in the CCH Indenture) and Train 5 of the SPL Project (as defined in SPL’s common terms agreement), which has occurred in February 2019 and March 2019, respectively; (2) the aggregate principal amount of outstanding loans plus drawn and unreimbursed letters of credit under the Cheniere Revolving Credit Facility is less than or equal to 10% of aggregate commitments under the Cheniere Revolving Credit Facility and (3) we elect on a go-forward basis to be governed by a non-consolidated leverage ratio
covenant not to exceed 5.75:1.00 (the “Springing Leverage Covenant”), which following such election will apply at any time that the aggregate principal amount of outstanding loans plus drawn and unreimbursed letters of credit under the Cheniere Revolving Credit Facility is greater than 30% of aggregate commitments under the Cheniere Revolving Credit Facility. Following the Trigger Point, at any time that the Springing Leverage Covenant is in effect, the Liquidity Covenant will not apply.
The Cheniere Revolving Credit Facility is secured by a first priority security interest (subject to permitted liens and other customary exceptions) in substantially all of our assets, including our interests in our direct subsidiaries (excluding CCH HoldCo II and certain other subsidiaries).
Cash Receipts from Subsidiaries
Our ownership interest in the Sabine Pass LNG terminal is held through Cheniere Partners. As of March 31, 2019, we owned a 48.6% limited partner interest in Cheniere Partners in the form of 104.5 million common units and 135.4 million subordinated units. We also own 100% of the general partner interest and the incentive distribution rights in Cheniere Partners. We are eligible to receive quarterly equity distributions from Cheniere Partners related to our ownership interests and our incentive distribution rights.
We also receive fees for providing management services to some of our subsidiaries. We received $20 million in total service fees from these subsidiaries during each of the three months ended March 31, 2019 and 2018.
Cheniere Partners
CQP Senior Notes
The $1.5 billion of 5.250% Senior Notes due 2025 (the “2025 CQP Senior Notes”) and $1.1 billion of 5.625% Senior Notes due 2026 (the “2026 CQP Senior Notes”) (collectively, the “CQP Senior Notes”) are jointly and severally guaranteed by each of Cheniere Partners’ subsidiaries other than SPL (the “CQP Guarantors”) and, subject to certain conditions governing its guarantee, Sabine Pass LP. The CQP Senior Notes are governed by the same base indenture (the “CQP Base Indenture”). The 2025 CQP Senior Notes are further governed by the First Supplemental Indenture (together with the CQP Base Indenture, the “2025 CQP Notes Indenture”) and the 2026 CQP Senior Notes are further governed by the Second Supplemental Indenture (together with the CQP Base Indenture, the “2026 CQP Notes Indenture”). The 2025 CQP Notes Indenture and the 2026 CQP Notes Indenture contain customary terms and events of default and certain covenants that, among other things, limit the ability of Cheniere Partners and the CQP Guarantors to incur liens and sell assets, enter into transactions with affiliates, enter into sale-leaseback transactions and consolidate, merge or sell, lease or otherwise dispose of all or substantially all of the applicable entity’s properties or assets.
At any time prior to October 1, 2020 for the 2025 CQP Senior Notes and October 1, 2021 for the 2026 CQP Senior Notes, Cheniere Partners may redeem all or a part of the applicable CQP Senior Notes at a redemption price equal to 100% of the aggregate principal amount of the CQP Senior Notes redeemed, plus the “applicable premium” set forth in the respective indentures governing the CQP Senior Notes, plus accrued and unpaid interest, if any, to the date of redemption. In addition, at any time prior to October 1, 2020 for the 2025 CQP Senior Notes and October 1, 2021 for the 2026 CQP Senior Notes, Cheniere Partners may redeem up to 35% of the aggregate principal amount of the CQP Senior Notes with an amount of cash not greater than the net cash proceeds from certain equity offerings at a redemption price equal to 105.250% of the aggregate principal amount of the 2025 CQP Senior Notes and 105.625% of the aggregate principal amount of the 2026 CQP Senior Notes redeemed, plus accrued and unpaid interest, if any, to the date of redemption. Cheniere Partners also may at any time on or after October 1, 2020 through the maturity date of October 1, 2025 for the 2025 CQP Senior Notes and October 1, 2021 through the maturity date of October 1, 2026 for the 2026 CQP Senior Notes, redeem the CQP Senior Notes, in whole or in part, at the redemption prices set forth in the respective indentures governing the CQP Senior Notes.
The CQP Senior Notes are Cheniere Partners’ senior obligations, ranking equally in right of payment with Cheniere Partners’ other existing and future unsubordinated debt and senior to any of its future subordinated debt. After applying the proceeds from the 2026 CQP Senior Notes, the CQP Senior Notes became unsecured. In the event that the aggregate amount of Cheniere Partners’ secured indebtedness and the secured indebtedness of the CQP Guarantors (other than the CQP Senior Notes or any other series of notes issued under the CQP Base Indenture) outstanding at any one time exceeds the greater of (1) $1.5 billion and (2) 10% of net tangible assets, the CQP Senior Notes will be secured to the same extent as such obligations under the CQP Credit Facilities. The obligations under the CQP Credit Facilities are secured on a first-priority basis (subject to permitted encumbrances) with liens on (1) substantially all the existing and future tangible and intangible assets and rights of Cheniere Partners and the CQP Guarantors
and equity interests in the CQP Guarantors (except, in each case, for certain excluded properties set forth in the CQP Credit Facilities) and (2) substantially all of the real property of SPLNG (except for excluded properties referenced in the CQP Credit Facilities). The liens securing the CQP Senior Notes, if applicable, will be shared equally and ratably (subject to permitted liens) with the holders of other senior secured obligations, which include the CQP Credit Facilities obligations and any future additional senior secured debt obligations.
CQP Credit Facilities
In February 2016, Cheniere Partners entered into the CQP Credit Facilities. The CQP Credit Facilities originally consisted of: (1) a $450 million CTPL tranche term loan that was used to prepay the $400 million term loan facility in February 2016, (2) an approximately $2.1 billion SPLNG tranche term loan that was used to repay and redeem in November 2016 the approximately $2.1 billion of the senior notes previously issued by SPLNG, (3) a $125 million facility that could be used to satisfy a six-month debt service reserve requirement and (4) a $115 million revolving credit facility that may be used for general business purposes. In September 2017 and September 2018, Cheniere Partners issued the 2025 CQP Senior Notes and the 2026 CQP Senior Notes, respectively, and the net proceeds were used to prepay the outstanding term loans under the CQP Credit Facilities. As of March 31, 2019, only a $115 million revolving credit facility, which is currently undrawn, remains as part of the CQP Credit Facilities.
The CQP Credit Facilities mature on February 25, 2020. Any outstanding balance may be repaid, in whole or in part, at any time without premium or penalty, except for interest hedging and interest rate breakage costs. The CQP Credit Facilities contain conditions precedent for extensions of credit, as well as customary affirmative and negative covenants and limit Cheniere Partners’ ability to make restricted payments, including distributions, to once per fiscal quarter as long as certain conditions are satisfied. Under the CQP Credit Facilities, Cheniere Partners is required to hedge not less than 50% of the variable interest rate exposure on its projected aggregate outstanding balance, maintain a minimum debt service coverage ratio of at least 1.15x at the end of each fiscal quarter beginning March 31, 2019 and have a projected debt service coverage ratio of 1.55x in order to incur additional indebtedness to refinance a portion of the existing obligations.
The CQP Credit Facilities are unconditionally guaranteed by each subsidiary of Cheniere Partners other than (1) SPL and (2) certain subsidiaries of Cheniere Partners owning other development projects, as well as certain other specified subsidiaries and members of the foregoing entities.
Sabine Pass LNG Terminal
Liquefaction Facilities
We are developing, constructing and operating the SPL Project at the Sabine Pass LNG terminal adjacent to the existing regasification facilities. We have received authorization from the FERC to site, construct and operate Trains 1 through 6. We have achieved substantial completion of Trains 1, 2, 3, 4 and 5 of the SPL Project and commenced operating activities in May 2016, September 2016, March 2017, October 2017 and March 2019, respectively.
The following orders have been issued by the DOE authorizing the export of domestically produced LNG by vessel from the Sabine Pass LNG terminal:
| |
• | Trains 1 through 4—FTA countries for a 30-year term, which commenced on May 15, 2016, and non-FTA countries for a 20-year term, which commenced on June 3, 2016, in an amount up to a combined total of the equivalent of 16 mtpa (approximately 803 Bcf/yr of natural gas). |
| |
• | Trains 1 through 4—FTA countries for a 25-year term and non-FTA countries for a 20-year term in an amount up to a combined total of the equivalent of approximately 203 Bcf/yr of natural gas (approximately 4 mtpa). |
| |
• | Trains 5 and 6—FTA countries and non-FTA countries for a 20-year term, in an amount up to a combined total of 503.3 Bcf/yr of natural gas (approximately 10 mtpa). |
In each case, the terms of these authorizations begin on the earlier of the date of first export thereunder or the date specified in the particular order, which ranges from five to 10 years from the date the order was issued. In addition, SPL received an order providing for a three-year makeup period with respect to each of the non-FTA orders for LNG volumes SPL was authorized but unable to export during any portion of the initial 20-year export period of such order.
In January 2018, the DOE issued orders authorizing SPL to export domestically produced LNG by vessel from the Sabine Pass LNG terminal to FTA countries and non-FTA countries over a two-year period commencing January 2018, in an aggregate amount up to the equivalent of 600 Bcf of natural gas (however, exports under this order, when combined with exports under the orders above, may not exceed 1,509 Bcf/yr).
Customers
SPL has entered into fixed price SPAs with terms of at least 20 years (plus extension rights) with six third parties for Trains 1 through 5 of the SPL Project, to make available an aggregate amount of LNG that is between approximately 80% to 95% of the expected aggregate adjusted nominal production capacity from these Trains. Under these SPAs, the customers will purchase LNG from SPL for a price consisting of a fixed fee per MMBtu of LNG (a portion of which is subject to annual adjustment for inflation) plus a variable fee per MMBtu of LNG equal to approximately 115% of Henry Hub. In certain circumstances, the customers may elect to cancel or suspend deliveries of LNG cargoes, in which case the customers would still be required to pay the fixed fee with respect to the contracted volumes that are not delivered as a result of such cancellation or suspension. We refer to the fee component that is applicable regardless of a cancellation or suspension of LNG cargo deliveries under the SPAs as the fixed fee component of the price under SPL’s SPAs. We refer to the fee component that is applicable only in connection with LNG cargo deliveries as the variable fee component of the price under SPL’s SPAs. The variable fees under SPL’s SPAs were sized at the time of entry into each SPA with the intent to cover the costs of gas purchases and transportation related to, and operating and maintenance costs to produce, the LNG to be sold under each such SPA. The SPAs and contracted volumes to be made available under the SPAs are not tied to a specific Train; however, the term of each SPA generally commences upon the date of first commercial delivery of a specified Train.
In aggregate, the annual fixed fee portion to be paid by the third-party SPA customers is approximately $2.3 billion for Trains 1 through 4 and increasing to $2.9 billion upon the date of first commercial delivery of Train 5, with the applicable fixed fees starting from the date of first commercial delivery from the applicable Train, as specified in each SPA.
In addition, Cheniere Marketing has entered into an SPA with SPL to purchase, at Cheniere Marketing’s option, any LNG produced by SPL in excess of that required for other customers.
Natural Gas Transportation, Storage and Supply
To ensure SPL is able to transport adequate natural gas feedstock to the Sabine Pass LNG terminal, it has entered into transportation precedent and other agreements to secure firm pipeline transportation capacity with CTPL and third-party pipeline companies. SPL has entered into firm storage services agreements with third parties to assist in managing variability in natural gas needs for the SPL Project. SPL has also entered into enabling agreements and long-term natural gas supply contracts with third parties in order to secure natural gas feedstock for the SPL Project. As of March 31, 2019, SPL had secured up to approximately 3,542 TBtu of natural gas feedstock through long-term and short-term natural gas supply contracts.
Construction
SPL entered into lump sum turnkey contracts with Bechtel Oil, Gas and Chemicals, Inc. (“Bechtel”) for the engineering, procurement and construction of Trains 1 through 6 of the SPL Project, under which Bechtel charges a lump sum for all work performed and generally bears project cost risk unless certain specified events occur, in which case Bechtel may cause SPL to enter into a change order, or SPL agrees with Bechtel to a change order.
The total contract price of the EPC contract for Train 6 of the SPL Project is approximately $2.5 billion, including estimated costs for an optional third marine berth.
Final Investment Decision on Train 6
SPL has issued limited notices to proceed to Bechtel for the commencement of certain engineering, procurement and site works for Train 6 of the SPL Project and a schedule for completion has been established. FID and full notice to proceed for Train 6 of the SPL Project will be contingent upon, among other things, entering into acceptable commercial arrangements and obtaining adequate financing to construct Train 6.
Regasification Facilities
The Sabine Pass LNG terminal has operational regasification capacity of approximately 4.0 Bcf/d and aggregate LNG storage capacity of approximately 16.9 Bcfe. Approximately 2.0 Bcf/d of the regasification capacity at the Sabine Pass LNG terminal has been reserved under two long-term third-party TUAs, under which SPLNG’s customers are required to pay fixed monthly fees, whether or not they use the LNG terminal. Each of Total Gas & Power North America, Inc. (“Total”) and Chevron U.S.A. Inc. (“Chevron”) has reserved approximately 1.0 Bcf/d of regasification capacity and is obligated to make monthly capacity payments to SPLNG aggregating approximately $125 million annually, prior to inflation adjustments, for 20 years that commenced in 2009. Total S.A. has guaranteed Total’s obligations under its TUA up to $2.5 billion, subject to certain exceptions, and Chevron Corporation has guaranteed Chevron’s obligations under its TUA up to 80% of the fees payable by Chevron.
The remaining approximately 2.0 Bcf/d of capacity has been reserved under a TUA by SPL. SPL is obligated to make monthly capacity payments to SPLNG aggregating approximately $250 million annually, prior to inflation adjustments, continuing until at least May 2036. SPL entered into a partial TUA assignment agreement with Total, whereby upon substantial completion of Train 5 of the SPL Project, SPL gained access to substantially all of Total’s capacity and other services provided under Total’s TUA with SPLNG. This agreement provides SPL with additional berthing and storage capacity at the Sabine Pass LNG terminal that may be used to provide increased flexibility in managing LNG cargo loading and unloading activity, permit SPL to more flexibly manage its LNG storage capacity and accommodate the development of Train 6. Notwithstanding any arrangements between Total and SPL, payments required to be made by Total to SPLNG will continue to be made by Total to SPLNG in accordance with its TUA. During each of the three months ended March 31, 2019 and 2018, SPL recorded $7.5 million as operating and maintenance expense under this partial TUA assignment agreement.
Under each of these TUAs, SPLNG is entitled to retain 2% of the LNG delivered to the Sabine Pass LNG terminal.
Capital Resources
We currently expect that SPL’s capital resources requirements with respect to the SPL Project will be financed through project debt and borrowings and cash flows under the SPAs. We believe that with the net proceeds of borrowings, available commitments under the SPL Working Capital Facility and cash flows from operations, we will have adequate financial resources available to meet our currently anticipated capital, operating and debt service requirements with respect to Trains 1 through 5 of the SPL Project. SPL began generating cash flows from operations from the SPL Project in May 2016, when Train 1 achieved substantial completion and initiated operating activities. Trains 2, 3, 4 and 5 subsequently achieved substantial completion in September 2016, March 2017, October 2017 and March 2019, respectively. We realized offsets to LNG terminal costs of $74 million in the three months ended March 31, 2019 that were related to the sale of commissioning cargoes because these amounts were earned or loaded prior to the start of commercial operations of Train 5 of the SPL Project during the testing phase for its construction. We did not realize any offsets to LNG terminal costs in the three months ended March 31, 2018. Additionally, SPLNG generates cash flows from the TUAs, as discussed above.
The following table provides a summary of our capital resources from borrowings and available commitments for the Sabine Pass LNG Terminal, excluding equity contributions to our subsidiaries and cash flows from operations (as described in Sources and Uses of Cash), at March 31, 2019 and December 31, 2018 (in millions):
|
| | | | | | | | |
| | March 31, | | December 31, |
| | 2019 | | 2018 |
Senior notes (1) | | $ | 16,250 |
| | $ | 16,250 |
|
Credit facilities outstanding balance (2) | | — |
| | — |
|
Letters of credit issued (3) | | 421 |
| | 425 |
|
Available commitments under credit facilities (3) | | 779 |
| | 775 |
|
Total capital resources from borrowings and available commitments (4) | | $ | 17,450 |
| | $ | 17,450 |
|
| |
(1) | Includes SPL’s 5.625% Senior Secured Notes due 2021, 6.25% Senior Secured Notes due 2022, 5.625% Senior Secured Notes due 2023, 5.75% Senior Secured Notes due 2024, 5.625% Senior Secured Notes due 2025, 5.875% Senior Secured Notes due 2026 (the “2026 SPL Senior Notes”), 5.00% Senior Secured Notes due 2027 (the “2027 SPL Senior Notes”), 4.200% Senior Secured Notes due 2028 (the “2028 SPL Senior Notes”) and 5.00% Senior Secured Notes due 2037 (the “2037 SPL Senior Notes”) (collectively, the “SPL Senior Notes”) and Cheniere Partners’ 2025 CQP Senior Notes and 2026 CQP Senior Notes. |
| |
(2) | Includes outstanding balances under the SPL Working Capital Facility and CQP Credit Facilities. |
| |
(3) | Consists of SPL Working Capital Facility. Does not include the letters of credit issued or available commitments under the CQP Credit Facilities, which are not specifically for the Sabine Pass LNG Terminal. |
| |
(4) | Does not include Cheniere’s additional borrowings from the 2021 Cheniere Convertible Unsecured Notes and the 2045 Cheniere Convertible Senior Notes, which may be used for the Sabine Pass LNG Terminal. |
For additional information regarding our debt agreements related to the Sabine Pass LNG Terminal, see Note 10—Debt of our Notes to Consolidated Financial Statements in this quarterly report and Note 12—Debt of our Notes to Consolidated Financial Statements in our annual report on Form 10-K for the year ended December 31, 2018.
SPL Senior Notes
The SPL Senior Notes are secured on a pari passu first-priority basis by a security interest in all of the membership interests in SPL and substantially all of SPL’s assets.
At any time prior to three months before the respective dates of maturity for each series of the SPL Senior Notes (except for the 2026 SPL Senior Notes, 2027 SPL Senior Notes, 2028 SPL Senior Notes and 2037 SPL Senior Notes, in which case the time period is six months before the respective dates of maturity), SPL may redeem all or part of such series of the SPL Senior Notes at a redemption price equal to the “make-whole” price (except for the 2037 SPL Senior Notes, in which case the redemption price is equal to the “optional redemption” price) set forth in the respective indentures governing the SPL Senior Notes, plus accrued and unpaid interest, if any, to the date of redemption. SPL may also, at any time within three months of the respective maturity dates for each series of the SPL Senior Notes (except for the 2026 SPL Senior Notes, 2027 SPL Senior Notes, 2028 SPL Senior Notes and 2037 SPL Senior Notes, in which case the time period is within six months of the respective dates of maturity), redeem all or part of such series of the SPL Senior Notes at a redemption price equal to 100% of the principal amount of such series of the SPL Senior Notes to be redeemed, plus accrued and unpaid interest, if any, to the date of redemption.
Both the indenture governing the 2037 SPL Senior Notes (the “2037 SPL Senior Notes Indenture”) and the common indenture governing the remainder of the SPL Senior Notes (the “SPL Indenture”) include restrictive covenants. SPL may incur additional indebtedness in the future, including by issuing additional notes, and such indebtedness could be at higher interest rates and have different maturity dates and more restrictive covenants than the current outstanding indebtedness of SPL, including the SPL Senior Notes and the SPL Working Capital Facility. Under the 2037 SPL Senior Notes Indenture and the SPL Indenture, SPL may not make any distributions until, among other requirements, deposits are made into debt service reserve accounts as required and a debt service coverage ratio test of 1.25:1.00 is satisfied. Semi-annual principal payments for the 2037 SPL Senior Notes are due on March 15 and September 15 of each year beginning September 15, 2025.
SPL Working Capital Facility
In September 2015, SPL entered into the SPL Working Capital Facility, which is intended to be used for loans to SPL (“SPL Working Capital Loans”), the issuance of letters of credit on behalf of SPL, as well as for swing line loans to SPL (“SPL Swing Line Loans”), primarily for certain working capital requirements related to developing and placing into operation the SPL Project. SPL may, from time to time, request increases in the commitments under the SPL Working Capital Facility of up to $760 million and, upon the completion of the debt financing of Train 6 of the SPL Project, request an incremental increase in commitments of up to an additional $390 million. As of March 31, 2019 and December 31, 2018, SPL had $779 million and $775 million of available commitments and $421 million and $425 million aggregate amount of issued letters of credit under the SPL Working Capital Facility, respectively. SPL did not have any amounts outstanding under the SPL Working Capital Facility as of both March 31, 2019 and December 31, 2018.
The SPL Working Capital Facility matures on December 31, 2020, and the outstanding balance may be repaid, in whole or in part, at any time without premium or penalty upon three business days’ notice. Loans deemed made in connection with a draw upon a letter of credit have a term of up to one year. SPL Swing Line Loans terminate upon the earliest of (1) the maturity date or earlier termination of the SPL Working Capital Facility, (2) the date 15 days after such SPL Swing Line Loan is made and (3) the first borrowing date for a SPL Working Capital Loan or SPL Swing Line Loan occurring at least three business days following the date the SPL Swing Line Loan is made. SPL is required to reduce the aggregate outstanding principal amount of all SPL Working Capital Loans to zero for a period of five consecutive business days at least once each year.
The SPL Working Capital Facility contains conditions precedent for extensions of credit, as well as customary affirmative and negative covenants. The obligations of SPL under the SPL Working Capital Facility are secured by substantially all of the assets of SPL as well as all of the membership interests in SPL on a pari passu basis with the SPL Senior Notes.
Corpus Christi LNG Terminal
Liquefaction Facilities
The CCL Project is being developed and constructed at the Corpus Christi LNG terminal. We have received authorization from the FERC to site, construct and operate Stages 1 and 2 of the CCL Project. We achieved substantial completion of Train 1 of the CCL Project and commenced operating activities in February 2019. The following table summarizes the overall project status of the CCL Project as of March 31, 2019:
|
| | | | | |
| CCL Stage 1 | | CCL Stage 2 |
Overall project completion percentage | 98.4% | | 51.6% |
Completion percentage of: | | | | |
Engineering | 100% | | 91.3% |
Procurement | 100% | | 77.0% |
Subcontract work | 93.9% | | 10.5% |
Construction | 96.7% | | 19.3% |
Expected date of substantial completion | Train 2 | 2H 2019 | | Train 3 | 2H 2021 |
Separate from the CCH Group, we are also developing Corpus Christi Stage 3, adjacent to the CCL Project. We filed an application with FERC in June 2018 for seven midscale Trains with an expected aggregate nominal production capacity of approximately 9.5 mtpa and one LNG storage tank.
The following orders have been issued by the DOE authorizing the export of domestically produced LNG by vessel from the Corpus Christi LNG terminal:
| |
• | CCL Project—FTA countries for a 25-year term and to non-FTA countries for a 20-year term up to a combined total of the equivalent of 767 Bcf/yr (approximately 15 mtpa) of natural gas. |
| |
• | Corpus Christi Stage 3—FTA countries for a 20-year term in an amount equivalent to 514 Bcf/yr (approximately 10 mtpa) of natural gas (the “Stage 3 FTA”). The application for authorization to export that same 514 Bcf/yr of domestically produced LNG by vessel to non-FTA countries is currently pending before the DOE (the “Stage 3 Non-FTA”). |
In each case, the terms of these authorizations begin on the earlier of the date of first export thereunder or the date specified in the particular order, which ranges from seven to 10 years from the date the order was issued.
In June 2018, we requested that DOE vacate the Stage 3 FTA and permit us to withdraw the pending Stage 3 Non-FTA. These requests were made due to certain changes to Corpus Christi Stage 3.
In conjunction with the submission in June 2018 of our FERC application for Corpus Christi Stage 3, we submitted a new application for long-term multi-contract authorization to export up to a combined total of 582.14 Bcf/yr (approximately 11.45 mtpa) of natural gas to FTA countries for a 25-year term and to non-FTA countries for a 20-year term. The term of each authorization is expected to begin on the earlier of the date of first commercial export of LNG produced by Corpus Christi Stage 3 or the date which is seven years from the issuance of such authorizations.
Customers
CCL has entered into fixed price SPAs generally with terms of 20 years (plus extension rights) with nine third parties for Trains 1 through 3 of the CCL Project, to make available an aggregate amount of LNG that is between approximately 75% to 85% of the expected aggregate adjusted nominal production capacity from these Trains. Under these SPAs, the customers will purchase LNG from CCL for a price consisting of a fixed fee per MMBtu of LNG (a portion of which is subject to annual adjustment for inflation) plus a variable fee per MMBtu of LNG equal to approximately 115% of Henry Hub. In certain circumstances, the customers may elect to cancel or suspend deliveries of LNG cargoes, in which case the customers would still be required to pay the fixed fee with respect to the contracted volumes that are not delivered as a result of such cancellation or suspension. We refer to the fee component that is applicable regardless of a cancellation or suspension of LNG cargo deliveries under the SPAs as the
fixed fee component of the price under our SPAs. We refer to the fee component that is applicable only in connection with LNG cargo deliveries as the variable fee component of the price under our SPAs. The variable fee under CCL’s SPAs entered into in connection with the development of the CCL Project was sized at the time of entry into each SPA with the intent to cover the costs of gas purchases and transportation related to, and operating and maintenance costs to produce, the LNG to be sold under each such SPA. The SPAs and contracted volumes to be made available under the SPAs are not tied to a specific Train; however, the term of each SPA generally commences upon the date of first commercial delivery for the applicable Train, as specified in each SPA.
In aggregate, the minimum fixed fee portion to be paid by the third-party SPA customers is approximately $550 million for Train 1 and increasing to approximately $1.4 billion for Train 2, in each case upon the date of first commercial delivery for the respective Train, and further increasing to approximately $1.8 billion following the substantial completion of Train 3 of the CCL Project.
In addition, Cheniere Marketing has entered into SPAs with CCL to purchase 15 TBtu per annum of LNG and any LNG produced by CCL in excess of that required for other customers at Cheniere Marketing’s option.
Natural Gas Transportation, Storage and Supply
To ensure CCL is able to transport adequate natural gas feedstock to the Corpus Christi LNG terminal, it has entered into transportation precedent agreements to secure firm pipeline transportation capacity with CCP and certain third-party pipeline companies. CCL has entered into a firm storage services agreement with a third party to assist in managing variability in natural gas needs for the CCL Project. CCL has also entered into enabling agreements and long-term natural gas supply contracts with third parties, and will continue to enter into such agreements, in order to secure natural gas feedstock for the CCL Project. As of March 31, 2019, CCL had secured up to approximately 2,805 TBtu of natural gas feedstock through long-term natural gas supply contracts, a portion of which is subject to the achievement of certain project milestones and other conditions precedent.
Construction
CCL entered into separate lump sum turnkey contracts with Bechtel for the engineering, procurement and construction of Stages 1 and 2 of the CCL Project under which Bechtel charges a lump sum for all work performed and generally bears project cost risk unless certain specified events occur, in which case Bechtel may cause CCL to enter into a change order, or CCL agrees with Bechtel to a change order.
The total contract prices of the EPC contract for Stage 1 and the EPC contract for Stage 2, which do not include the Corpus Christi Pipeline, are approximately $7.8 billion and $2.4 billion, respectively, reflecting amounts incurred under change orders through March 31, 2019. Total expected capital costs for Trains 1 through 3 are estimated to be between $11.0 billion and $12.0 billion before financing costs and between $15.0 billion and $16.0 billion after financing costs including, in each case, estimated owner’s costs and contingencies.
Pipeline Facilities
In December 2014, the FERC issued a certificate of public convenience and necessity under Section 7(c) of the Natural Gas Act of 1938, as amended, authorizing CCP to construct and operate the Corpus Christi Pipeline. The Corpus Christi Pipeline is designed to transport 2.25 Bcf/d of natural gas feedstock required by the CCL Project from the existing regional natural gas pipeline grid. The construction of the Corpus Christi Pipeline was completed in the second quarter of 2018.
Capital Resources
The CCH Group expects to finance the construction costs of the CCL Project from one or more of the following: project financing, operating cash flows from CCL and CCP and equity contributions from Cheniere. We realized offsets to LNG terminal costs of $128 million in the three months ended March 31, 2019 that were related to the sale of commissioning cargoes because these amounts were earned or loaded prior to the start of commercial operations of Train 1 during the testing phase for its construction. The following table provides a summary of the capital resources of the CCH Group from borrowings and available commitments for the CCL Project, excluding equity contributions from Cheniere, at March 31, 2019 and December 31, 2018 (in millions):
|
| | | | | | | | |
| | March 31, | | December 31, |
| | 2019 | | 2018 |
Senior notes (1) | | $ | 4,250 |
| | $ | 4,250 |
|
11.0% Convertible Senior Secured Notes due 2025 (2) | | 1,000 |
| | 1,000 |
|
Credit facilities outstanding balance (3) | | 5,647 |
| | 5,324 |
|
Letters of credit issued (3) | | 321 |
| | 316 |
|
Available commitments under credit facilities (3) | | 1,370 |
| | 1,698 |
|
Total capital resources from borrowings and available commitments (4) | | $ | 12,588 |
| | $ | 12,588 |
|
| |
(1) | Includes CCH’s 7.000% Senior Secured Notes due 2024 (the “2024 CCH Senior Notes”), 5.875% Senior Secured Notes due 2025 (the “2025 CCH Senior Notes”) and 5.125% Senior Secured Notes due 2027 (the “2027 CCH Senior Notes”) (collectively, the “CCH Senior Notes”). |
| |
(2) | Aggregate original principal amount before debt discount and debt issuance costs. |
| |
(3) | Includes CCH Credit Facility and CCH Working Capital Facility. |
| |
(4) | Does not include Cheniere’s additional borrowings from 2021 Cheniere Convertible Unsecured Notes, 2045 Cheniere Convertible Senior Notes and Cheniere Revolving Credit Facility, which may be used for the CCL Project. |
For additional information regarding our debt agreements related to the CCL Project, see Note 10—Debt of our Notes to Consolidated Financial Statements in this quarterly report and Note 12—Debt of our Notes to Consolidated Financial Statements in our annual report on Form 10-K for the year ended December 31, 2018.
2025 CCH HoldCo II Convertible Senior Notes
In May 2015, CCH HoldCo II issued $1.0 billion aggregate principal amount of 11.0% Convertible Senior Secured Notes due 2025 (the “2025 CCH HoldCo II Convertible Senior Notes”) on a private placement basis. The 2025 CCH HoldCo II Convertible Senior Notes are convertible at the option of CCH HoldCo II or the holders, provided that various conditions are met. CCH HoldCo II is restricted from making distributions to Cheniere under agreements governing its indebtedness generally until, among other requirements, Trains 1 and 2 of the CCL Project are in commercial operation and a historical debt service coverage ratio and a projected fixed debt service coverage ratio of 1.20:1.00 are achieved.
In May 2018, the amended and restated note purchase agreement under which the 2025 CCH HoldCo II Convertible Senior Notes were issued was subsequently amended in connection with commercialization and financing of Train 3 of the CCL Project and to provide the note holders with certain prepayment rights related thereto consistent with those under the CCH Credit Facility. All terms of the 2025 CCH HoldCo II Convertible Senior Notes substantially remained unchanged.
CCH Senior Notes
The CCH Senior Notes are jointly and severally guaranteed by CCH’s subsidiaries, CCL, CCP and Corpus Christi Pipeline GP, LLC (the “CCH Guarantors”). The indenture governing the CCH Senior Notes (the “CCH Indenture”) contains customary terms and events of default and certain covenants that, among other things, limit CCH’s ability and the ability of CCH’s restricted subsidiaries to: incur additional indebtedness or issue preferred stock; make certain investments or pay dividends or distributions on membership interests or subordinated indebtedness or purchase, redeem or retire membership interests; sell or transfer assets, including membership or partnership interests of CCH’s restricted subsidiaries; restrict dividends or other payments by restricted subsidiaries to CCH or any of CCH’s restricted subsidiaries; incur liens; enter into transactions with affiliates; dissolve, liquidate, consolidate, merge, sell or lease all or substantially all of the properties or assets of CCH and its restricted subsidiaries taken as a
whole; or permit any CCH Guarantor to dissolve, liquidate, consolidate, merge, sell or lease all or substantially all of its properties and assets.
At any time prior to six months before the respective dates of maturity for each series of the CCH Senior Notes, CCH may redeem all or part of such series of the CCH Senior Notes at a redemption price equal to the “make-whole” price set forth in the CCH Indenture, plus accrued and unpaid interest, if any, to the date of redemption. CCH also may at any time within six months of the respective dates of maturity for each series of the CCH Senior Notes, redeem all or part of such series of the CCH Senior Notes, in whole or in part, at a redemption price equal to 100% of the principal amount of the CCH Senior Notes to be redeemed, plus accrued and unpaid interest, if any, to the date of redemption.
CCH Credit Facility
In May 2018, CCH amended and restated the CCH Credit Facility to increase total commitments under the CCH Credit Facility from $4.6 billion to $6.1 billion. The obligations of CCH under the CCH Credit Facility are secured by a first priority lien on substantially all of the assets of CCH and its subsidiaries and by a pledge by CCH HoldCo I of its limited liability company interests in CCH. As of March 31, 2019 and December 31, 2018, CCH had $491 million and $1.0 billion of available commitments and $5.6 billion and $5.2 billion of loans outstanding under the CCH Credit Facility, respectively.
The CCH Credit Facility matures on June 30, 2024, with principal payments due quarterly commencing on the earlier of (1) the first quarterly payment date occurring more than three calendar months following the completion of the CCL Project as defined in the common terms agreement and (2) a set date determined by reference to the date under which a certain LNG buyer linked to the last Train of the CCL Project to become operational is entitled to terminate its SPA for failure to achieve the date of first commercial delivery for that agreement. Scheduled repayments will be based upon a 19-year tailored amortization, commencing the first full quarter after the completion of Trains 1 through 3 and designed to achieve a minimum projected fixed debt service coverage ratio of 1.50:1.
Under the CCH Credit Facility, CCH is required to hedge not less than 65% of the variable interest rate exposure of its senior secured debt. CCH is restricted from making certain distributions under agreements governing its indebtedness generally until, among other requirements, the completion of the construction of Trains 1 through 3 of the CCL Project, funding of a debt service reserve account equal to six months of debt service and achieving a historical debt service coverage ratio and fixed projected debt service coverage ratio of at least 1.25:1.00.
CCH Working Capital Facility
In June 2018, CCH amended and restated the CCH Working Capital Facility to increase total commitments under the CCH Working Capital Facility from $350 million to $1.2 billion. The CCH Working Capital Facility is intended to be used for loans to CCH (“CCH Working Capital Loans”) and the issuance of letters of credit on behalf of CCH for certain working capital requirements related to developing and placing into operations the CCL Project and for related business purposes. Loans under the CCH Working Capital Facility are guaranteed by the CCH Guarantors. CCH may, from time to time, request increases in the commitments under the CCH Working Capital Facility of up to the maximum allowed for working capital under the Common Terms Agreement that was entered into concurrently with the CCH Credit Facility. As of March 31, 2019 and December 31, 2018, CCH had $879 million and $716 million of available commitments, $321 million and $316 million aggregate amount of issued letters of credit and zero and $168 million of loans outstanding under the CCH Working Capital Facility, respectively.
The CCH Working Capital Facility matures on June 29, 2023, and CCH may prepay the CCH Working Capital Loans and loans made in connection with a draw upon any letter of credit (“CCH LC Loans”) at any time without premium or penalty upon three business days’ notice and may re-borrow at any time. CCH LC Loans have a term of up to one year. CCH is required to reduce the aggregate outstanding principal amount of all CCH Working Capital Loans to zero for a period of five consecutive business days at least once each year.
The CCH Working Capital Facility contains conditions precedent for extensions of credit, as well as customary affirmative and negative covenants. The obligations of CCH under the CCH Working Capital Facility are secured by substantially all of the assets of CCH and the CCH Guarantors as well as all of the membership interests in CCH and each of the CCH Guarantors on a pari passu basis with the CCH Senior Notes and the CCH Credit Facility.
Restrictive Debt Covenants
As of March 31, 2019, each of our issuers was in compliance with all covenants related to their respective debt agreements.
Marketing
We market and sell LNG produced by the SPL Project and the CCL Project that is not required for other customers through our integrated marketing function. We are developing a portfolio of long-, medium- and short-term SPAs to transport and unload commercial LNG cargoes to locations worldwide, which is primarily sourced by LNG produced by the SPL Project and the CCL Project but supplemented by volume procured from other locations worldwide, as needed. As of March 31, 2019, we have sold or have options to sell approximately 5,536 TBtu of LNG to be delivered to customers between 2019 and 2045. The cargoes have been sold either on a free on board (“FOB”) basis (delivered to the customer at the Sabine Pass LNG terminal or the Corpus Christi LNG terminal) or a delivered at terminal (“DAT”) basis (delivered to the customer at their LNG receiving terminal). We have chartered LNG vessels to be utilized in DAT transactions. In addition, we have entered into a long-term agreement to sell LNG cargoes on a DAT basis that is conditioned upon the buyer achieving certain milestones.
Cheniere Marketing entered into uncommitted trade finance facilities with available commitments of $420 million as of March 31, 2019, primarily to be used for the purchase and sale of LNG for ultimate resale in the course of its operations. The finance facilities are intended to be used for advances, guarantees or the issuance of letters of credit or standby letters of credit on behalf of Cheniere Marketing. As of March 31, 2019 and December 31, 2018, Cheniere Marketing had $10 million and $31 million, respectively, in standby letters of credit and guarantees outstanding under the finance facilities. As of March 31, 2019 and December 31, 2018, Cheniere Marketing had zero and $71 million, respectively, in loans outstanding under the finance facilities. Cheniere Marketing pays interest or fees on utilized commitments.
Corporate and Other Activities
We are required to maintain corporate and general and administrative functions to serve our business activities described above. We are also in various stages of developing other projects, including infrastructure projects in support of natural gas supply and LNG demand, which, among other things, will require acceptable commercial and financing arrangements before we make an FID. We have made an equity investment in Midship Pipeline, which is constructing a pipeline with expected capacity of up to 1.44 million Dekatherms per day that will connect new gas production in the Anadarko Basin to Gulf Coast markets, including markets serving the SPL Project and the CCL Project.
Sources and Uses of Cash
The following table summarizes the sources and uses of our cash, cash equivalents and restricted cash for the three months ended March 31, 2019 and 2018 (in millions). The table presents capital expenditures on a cash basis; therefore, these amounts differ from the amounts of capital expenditures, including accruals, which are referred to elsewhere in this report. Additional discussion of these items follows the table.
|
| | | | | | | |
| Three Months Ended March 31, |
| 2019 | | 2018 |
Operating cash flows | $ | 412 |
| | $ | 469 |
|
Investing cash flows | (651 | ) | | (776 | ) |
Financing cash flows | 94 |
| | 116 |
|
| | | |
Net decrease in cash, cash equivalents and restricted cash | (145 | ) |
| (191 | ) |
Cash, cash equivalents and restricted cash—beginning of period | 3,156 |
| | 2,613 |
|
Cash, cash equivalents and restricted cash—end of period | $ | 3,011 |
| | $ | 2,422 |
|
Operating Cash Flows
Our operating cash net inflows during the three months ended March 31, 2019 and 2018 were $412 million and $469 million, respectively. The $57 million decrease in operating cash inflows in 2019 compared to 2018 was primarily related to increased operating costs and expenses, partially offset by increased cash receipts from the sale of LNG cargoes, as a result of the additional Trains that were operating at the SPL Project and the CCL Project in 2019. In addition to Trains 1 through 4 of the SPL Project
that were operational during both the three months ended March 31, 2019 and 2018, Train 5 of the SPL Project and Train 1 of the CCL Project were operational for approximately a month during the three months ended March 31, 2019.
Investing Cash Flows
Investing cash net outflows during the three months ended March 31, 2019 and 2018 were $651 million and $776 million, respectively, and were primarily used to fund the construction costs for the SPL Project and the CCL Project. These costs are capitalized as construction-in-process until achievement of substantial completion. Additionally, we invested $24 million in Midship Holdings, our equity method investment, during the three months ended March 31, 2019.
Financing Cash Flows
Financing cash net inflows during the three months ended March 31, 2019 were $94 million, primarily as a result of:
| |
• | $491 million of borrowings under the CCH Credit Facility; |
| |
• | $201 million of borrowings and $369 million in repayments under the CCH Working Capital Facility; |
| |
• | $72 million of net repayments related to our Cheniere Marketing trade financing facilities; |
| |
• | $144 million of distributions to non-controlling interest by Cheniere Partners; and |
| |
• | $12 million paid for tax withholdings for share-based compensation. |
Financing cash net inflows during the three months ended March 31, 2018 were $116 million, primarily as a result of:
| |
• | $266 million of borrowings under the CCH Credit Facility; and |
| |
• | $143 million of distributions and dividends to non-controlling interest by Cheniere Partners and Cheniere Energy Partners LP Holdings, LLC (“Cheniere Holdings”). |
Results of Operations
The following table summarizes the volumes of operational and commissioning LNG cargoes that were loaded from the SPL Project and the CCL Project, which were recognized on our Consolidated Financial Statements during the three months ended March 31, 2019:
|
| | | | | |
| Three Months Ended March 31, 2019 |
(in TBtu) | Operational | | Commissioning |
Volumes loaded during the current period | 284 |
| | 25 |
|
Volumes loaded during the prior period but recognized during the current period | 25 |
| | 3 |
|
Less: volumes loaded during the current period and in transit at the end of the period | (27 | ) | | — |
|
Total volumes recognized in the current period | 282 |
| | 28 |
|
Our consolidated net income attributable to common stockholders was $141 million, or $0.55 per share—basic and $0.54 per share—diluted, in the three months ended March 31, 2019, compared to net income attributable to common stockholders of $357 million, or $1.52 per share—basic and $1.50 per share—diluted, in the three months ended March 31, 2018. This $216 million decrease in net income attributable to common stockholders in 2019 was primarily attributable to decreased margins per MMBtu due to decreased pricing on LNG and higher cost of sales, increased operating and maintenance expense, increased derivative loss, net, and increased interest expense, net of amounts capitalized, which were partially offset by decreased net income attributable to non-controlling interest.
Revenues
|
| | | | | | | | | | | | |
| | Three Months Ended March 31, |
(in millions) | | 2019 | | 2018 | | Change |
LNG revenues | | $ | 2,143 |
| | $ | 2,166 |
| | $ | (23 | ) |
Regasification revenues | | 66 |
| | 65 |
| | 1 |
|
Other revenues | | 48 |
| | 10 |
| | 38 |
|
Other—related party | | 4 |
| | 1 |
| | 3 |
|
Total revenues |
| $ | 2,261 |
|
| $ | 2,242 |
|
| $ | 19 |
|
We begin recognizing LNG revenues from the SPL Project and CCL Project following the substantial completion and the commencement of operating activities of the respective Trains. In addition to Trains 1 through 4 of the SPL Project that were operational during both the three months ended March 31, 2019 and 2018, Train 5 of the SPL Project and Train 1 of the CCL Project were operational for approximately a month during the three months ended March 31, 2019. The additional revenue from the increased volume of LNG sold following the achievement of substantial completion of these Trains in the three months ended March 31, 2019 from the comparable period in 2018 was offset by decreased revenues per MMBtu, which was primarily affected by sales made at current market prices by our integrated marketing function. We expect our LNG revenues to increase in the future upon Trains 2 and 3 of the CCL Project becoming operational.
Prior to substantial completion of a Train, amounts received from the sale of commissioning cargoes from that Train are offset against LNG terminal construction-in-process, because these amounts are earned or loaded during the testing phase for the construction of that Train. During the three months ended March 31, 2019, we realized offsets to LNG terminal costs of $202 million corresponding to 28 TBtu of LNG, that were related to the sale of commissioning cargoes from the SPL Project and the CCL Project. We did not realize any offsets to LNG terminal costs in the three months ended March 31, 2018.
Also included in LNG revenues are gains from derivative instruments, which include the realized value associated with a portion of derivative instruments that settle through physical delivery and the sale of natural gas procured for the liquefaction process. During the three months ended March 31, 2019 and 2018, we realized $134 million and $42 million, respectively, of gains from these transactions and other revenues.
The following table presents the components of LNG revenues and the corresponding LNG volumes sold.
|
| | | | | | | | |
| | Three Months Ended March 31, |
| | 2019 | | 2018 |
LNG revenues (in millions): | | | | |
LNG from SPL Project and CCL Project sold under third party long-term agreements (1) | | $ | 1,517 |
| | $ | 993 |
|
LNG from SPL Project and CCL Project sold by our integrated marketing function under short-term agreements | | 339 |
| | 1,021 |
|
LNG procured from third parties | | 153 |
| | 110 |
|
Other revenues and derivative gains (losses) | | 134 |
| | 42 |
|
Total LNG revenues | | $ | 2,143 |
| | $ | 2,166 |
|
| | | | |
Volumes sold as LNG revenues (in TBtu): | | | | |
LNG from SPL Project and CCL Project sold under third party long-term agreements (1) | | 236 |
| | 165 |
|
LNG from SPL Project and CCL Project sold by our integrated marketing function under short-term agreements | | 46 |
| | 108 |
|
LNG procured from third parties | | 18 |
| | 11 |
|
Total volumes sold as LNG revenues | | 300 |
| | 284 |
|
(1) Long-term agreements include agreements with tenure of 12 months or more.
The increase in revenues during the three months ended March 31, 2019 from the comparable period in 2018 was primarily attributable to an increase in other revenues due to additional sublease revenue from LNG vessel subcharters.
Operating costs and expenses
|
| | | | | | | | | | | | |
| | Three Months Ended March 31, |
(in millions) | | 2019 | | 2018 | | Change |
Cost of sales | | $ | 1,204 |
| | $ | 1,178 |
| | $ | 26 |
|
Cost of sales—related party | | 10 |
| | — |
| | 10 |
|
Operating and maintenance expense | | 221 |
| | 140 |
| | 81 |
|
Development expense | | 1 |
| | 1 |
| | — |
|
Selling, general and administrative expense | | 73 |
| | 67 |
| | 6 |
|
Depreciation and amortization expense | | 144 |
| | 109 |
| | 35 |
|
Impairment expense and loss on disposal of assets | | 2 |
| | — |
| | 2 |
|
Total operating costs and expenses | | $ | 1,655 |
| | $ | 1,495 |
| | $ | 160 |
|
Our total operating costs and expenses increased during the three months ended March 31, 2019 from the three months ended March 31, 2018, primarily as a result of the increase in operating Trains between each of the periods and third-party service and maintenance costs from increased maintenance and related activities at the SPL Project.
Cost of sales includes costs incurred directly for the production and delivery of LNG from the SPL Project and CCL Project, to the extent those costs are not utilized for the commissioning process. Cost of sales increased during the three months ended March 31, 2019 from the three months ended March 31, 2018 due to increased volumes of natural gas feedstock related to our LNG sales as a result of substantial completion of Train 5 of the SPL Project and Train 1 of the CCL Project, as well as increased pricing of natural gas feedstock. Partially offsetting the increase in cost of natural gas feedstock was: (1) an increase in fair value of the derivatives associated with hedges to secure natural gas feedstock for the SPL Project, due to a favorable shift in the long-term forward prices, (2) decrease in vessel charter costs due to higher utilization for commissioning purposes and (3) decrease in port and canal fees due to higher number of cargoes that were sold on a FOB basis instead of on a delivered ex-ship basis. Cost of sales also includes variable transportation and storage costs and other costs to convert natural gas into LNG.
Operating and maintenance expense primarily includes costs associated with operating and maintaining the SPL Project and CCL Project. The increase in operating and maintenance expense during the three months ended March 31, 2019 from the three months ended March 31, 2018 was primarily related to: (1) increased maintenance and related activities at the SPL Project, (2) increased natural gas transportation and storage capacity demand charges from operating Train 5 of the SPL Project and Train 1 of the CCL Project following the respective substantial completions and (3) increased payroll and benefit costs from increased headcount to operate Train 5 of the SPL Project and Train 1 of the CCL Project. Operating and maintenance expense also includes insurance and regulatory costs and other operating costs.
Depreciation and amortization expense increased during the three months ended March 31, 2019 from the three months ended March 31, 2018 as a result of commencing operations of Train 5 of the SPL Project and Train 1 of the CCL Project in March 2019 and February 2019, respectively, and completing construction of the Corpus Christi Pipeline in the second quarter of 2018, as the related assets began depreciating upon reaching substantial completion.
We expect our operating costs and expenses to generally increase in the future upon Trains 2 and 3 of the CCL Project achieving substantial completion, although certain costs will not proportionally increase with the number of operational Trains as cost efficiencies will be realized.
Other expense (income)
|
| | | | | | | | | | | | |
| | Three Months Ended March 31, |
(in millions) | | 2019 | | 2018 | | Change |
Interest expense, net of capitalized interest | | $ | 247 |
| | $ | 216 |
| | $ | 31 |
|
Derivative loss (gain), net | | 35 |
| | (77 | ) | | 112 |
|
Other income | | (16 | ) | | (7 | ) | | (9 | ) |
Total other expense | | $ | 266 |
| | $ | 132 |
| | $ | 134 |
|
Interest expense, net of capitalized interest, increased during the three months ended March 31, 2019 compared to the three months ended March 31, 2018, as a result of increased outstanding debt (before unamortized premium, discount and debt issuance costs, net) from $26.4 billion as of March 31, 2018 to $29.5 billion as of March 31, 2019 primarily due to increased borrowings
under the CCH Credit Facility, as well as a decrease in the portion of total interest costs that could be capitalized as additional Trains of the SPL Project and CCL Project completed construction between the periods. For the three months ended March 31, 2019 and 2018, we incurred $448 million and $404 million of total interest cost, respectively, of which we capitalized $201 million and $188 million, respectively, which was primarily related to the construction of the SPL Project and the CCL Project.
Derivative loss, net increased during the three months ended March 31, 2019 compared to the three months ended March 31, 2018, primarily due to an unfavorable shift in the long-term forward LIBOR curve between the periods.
Other income increased during the three months ended March 31, 2019 as compared to the three months ended March 31, 2018, primarily due to an increase in interest income earned on our cash and cash equivalents.
Income tax provision
|
| | | | | | | | | | | | |
| | Three Months Ended March 31, |
(in millions) | | 2019 | | 2018 | | Change |
Income before income taxes and non-controlling interest | | $ | 340 |
| | $ | 615 |
| | $ | (275 | ) |
Income tax provision | | (3 | ) | | (15 | ) | | 12 |
|
| | | | | | |
Effective tax rate | | 0.9 | % | | 2.4 | % | | |
Income tax provision decreased $12 million during the three months ended March 31, 2019 from the three months ended March 31, 2018, primarily attributable to changes in the income earned and tax transfer pricing applied to our U.K. integrated marketing function. The effective tax rates during each of the three months ended March 31, 2019 and 2018 were lower than the 21% federal statutory rate, primarily as a result of maintaining a valuation allowance against our federal and state net deferred tax assets. Given our current and anticipated future earnings, we believe that there is a reasonable possibility that within approximately 12 to 24 months, sufficient positive evidence may become available to allow us to conclude that a significant portion of the valuation allowance will no longer be needed. The release of the valuation allowance would result in the recognition of certain deferred tax assets and an income tax benefit in the period the release is recorded. However, the precise timing and amount of the valuation allowance release are subject to change on the basis of the level of profitability that we are able to achieve.
Net income attributable to non-controlling interest
|
| | | | | | | | | | | | |
| | Three Months Ended March 31, |
(in millions) | | 2019 | | 2018 | | Change |
Net income attributable to non-controlling interest | | $ | 196 |
| | $ | 243 |
| | $ | (47 | ) |
Net income attributable to non-controlling interest decreased during the three months ended March 31, 2019 from the three months ended March 31, 2018 due to the decrease of non-controlling interest as a result of our merger with Cheniere Holdings in September 2018, in which all publicly-held shares of Cheniere Holdings were canceled and the non-controlling interest in Cheniere Holdings was reduced to zero. This decrease was partially offset by an increase in consolidated net income recognized by Cheniere Partners in which the non-controlling interests are held. The consolidated net income recognized by Cheniere Partners increased from $335 million in the three months ended March 31, 2018 to $385 million in the three months ended March 31, 2019, primarily as a result of the commencement of operations of Train 5 of the SPL Project in March 2019.
Off-Balance Sheet Arrangements
As of March 31, 2019, we had no transactions that met the definition of off-balance sheet arrangements that may have a current or future material effect on our consolidated financial position or operating results.
Summary of Critical Accounting Estimates
The preparation of our Consolidated Financial Statements in conformity with GAAP requires management to make certain estimates and assumptions that affect the amounts reported in the Consolidated Financial Statements and the accompanying notes. There have been no significant changes to our critical accounting estimates from those disclosed in our annual report on Form 10-K for the year ended December 31, 2018.
Recent Accounting Standards
ITEM 3. QUANTITATIVE AND QUALITATIVE DISCLOSURES ABOUT MARKET RISK
Cash Investments
We have cash investments that we manage based on internal investment guidelines that emphasize liquidity and preservation of capital. Such cash investments are stated at historical cost, which approximates fair market value on our Consolidated Balance Sheets.
Marketing and Trading Commodity Price Risk
We have entered into commodity derivatives consisting of natural gas supply contracts for the commissioning and operation of the SPL Project and the CCL Project (“Liquefaction Supply Derivatives”). We have also entered into financial derivatives to hedge the exposure to the commodity markets in which we have contractual arrangements to purchase or sell physical LNG (“LNG Trading Derivatives”). In order to test the sensitivity of the fair value of the Liquefaction Supply Derivatives and the LNG Trading Derivatives to changes in underlying commodity prices, management modeled a 10% change in the commodity price for natural gas for each delivery location and a 10% change in the commodity price for LNG, respectively, as follows (in millions):
|
| | | | | | | | | | | | | | | |
| March 31, 2019 | | December 31, 2018 |
| Fair Value | | Change in Fair Value | | Fair Value | | Change in Fair Value |
Liquefaction Supply Derivatives | $ | 35 |
| | $ | 4 |
| | $ | (42 | ) | | $ | 6 |
|
LNG Trading Derivatives | 34 |
| | 14 |
| | (24 | ) | | 9 |
|
Interest Rate Risk
We are exposed to interest rate risk primarily when we incur debt related to project financing. Interest rate risk is managed in part by replacing outstanding floating-rate debt with fixed-rate debt with varying maturities. CCH has also entered into interest rate swaps to hedge the exposure to volatility in a portion of the floating-rate interest payments under the CCH Credit Facility (“CCH Interest Rate Derivatives”). In order to test the sensitivity of the fair value of the CCH Interest Rate Derivatives to changes in interest rates, management modeled a 10% change in the forward 1-month LIBOR curve across the remaining terms of the CCH Interest Rate Derivatives as follows (in millions):
|
| | | | | | | | | | | | | | | |
| March 31, 2019 | | December 31, 2018 |
| Fair Value | | Change in Fair Value | | Fair Value | | Change in Fair Value |
CCH Interest Rate Derivatives | $ | (19 | ) | | $ | 33 |
| | $ | 18 |
| | $ | 37 |
|
Foreign Currency Exchange Risk
We have entered into foreign currency exchange (“FX”) contracts to hedge exposure to currency risk associated with operations in countries outside of the United States (“FX Derivatives”). In order to test the sensitivity of the fair value of the FX Derivatives to changes in FX rates, management modeled a 10% change in FX rate between the U.S. dollar and the applicable foreign currencies as follows (in millions):
|
| | | | | | | | | | | | | | | |
| March 31, 2019 | | December 31, 2018 |
| Fair Value | | Change in Fair Value | | Fair Value | | Change in Fair Value |
FX Derivatives | $ | 23 |
| | $ | 2 |
| | $ | 15 |
| | $ | 1 |
|
| |
ITEM 4. | CONTROLS AND PROCEDURES |
We maintain a set of disclosure controls and procedures that are designed to ensure that information required to be disclosed by us in the reports filed by us under the Exchange Act, is recorded, processed, summarized and reported within the time periods specified in the SEC’s rules and forms. As of the end of the period covered by this report, we evaluated, under the supervision and with the participation of our management, including our Chief Executive Officer and our Chief Financial Officer, the effectiveness of our disclosure controls and procedures pursuant to Rule 13a-15 of the Exchange Act. Based on that evaluation, our Chief Executive Officer and our Chief Financial Officer concluded that our disclosure controls and procedures are effective.
During the most recent fiscal quarter, there have been no changes in our internal control over financial reporting that have materially affected, or are reasonably likely to materially affect, our internal control over financial reporting.
PART II. OTHER INFORMATION
ITEM 1. LEGAL PROCEEDINGS
We may in the future be involved as a party to various legal proceedings, which are incidental to the ordinary course of business. We regularly analyze current information and, as necessary, provide accruals for probable liabilities on the eventual disposition of these matters. There have been no material changes to the legal proceedings disclosed in our annual report on Form 10-K for the year ended December 31, 2018.
| |
ITEM 2. | UNREGISTERED SALES OF EQUITY SECURITIES AND USE OF PROCEEDS |
Purchase of Equity Securities by the Issuer and Affiliated Purchasers
The following table summarizes stock repurchases for the three months ended March 31, 2019: |
| | | | | | | | |
Period | | Total Number of Shares Purchased (1) | | Average Price Paid Per Share (2) | | Total Number of Shares Purchased as a Part of Publicly Announced Plans | | Maximum Number of Units That May Yet Be Purchased Under the Plans |
January 1 - 31, 2019 | | 6,944 | | $62.12 | | — | | — |
February 1 - 28, 2019 | | 178,512 | | $66.10 | | — | | — |
March 1 - 31, 2019 | | 4,794 | | $64.95 | | — | | — |
| |
(1) | Represents shares surrendered to us by participants in our share-based compensation plans to settle the participants’ personal tax liabilities that resulted from the lapsing of restrictions on shares awarded to the participants under these plans. |
| |
(2) | The price paid per share was based on the closing trading price of our common stock on the dates on which we repurchased shares from the participants under our share-based compensation plans. |
|
| | |
Exhibit No. | | Description |
10.1* | | |
10.2* | | Change orders to the Amended and Restated Fixed Price Separated Turnkey Agreement for the Engineering, Procurement and Construction of the Corpus Christi Stage 2 Liquefaction Facility, dated as of December 12, 2017, between CCL and Bechtel Oil, Gas and Chemicals, Inc.: (i) the Change Order CO-000010 OSHA Handrail Requirement Changes Impact, dated January 25, 2019, (ii) the Change Order CO-00011 Differing Soil Conditions - Train 3, dated March 7, 2019 and (iii) the Change Order CO-00012 Tank B Logo Deletion, dated March 25, 2019 (Portions of this exhibit have been omitted.) |
31.1* | | |
31.2* | | |
32.1** | | |
32.2** | | |
101.INS* | | XBRL Instance Document - the instance document does not appear in the Interactive Data File because its XBRL tags are embedded within the Inline XBRL document. |
101.SCH* | | XBRL Taxonomy Extension Schema Document |
101.CAL* | | XBRL Taxonomy Extension Calculation Linkbase Document |
101.DEF* | | XBRL Taxonomy Extension Definition Linkbase Document |
101.LAB* | | XBRL Taxonomy Extension Labels Linkbase Document |
101.PRE* | | XBRL Taxonomy Extension Presentation Linkbase Document |
|
| |
* | Filed herewith. |
** | Furnished herewith. |
Pursuant to the requirements of the Securities Exchange Act of 1934, the registrant has duly caused this report to be signed on its behalf by the undersigned, thereunto duly authorized.
|
| | | |
| | CHENIERE ENERGY, INC. |
| | | |
Date: | May 8, 2019 | By: | /s/ Michael J. Wortley |
| | | Michael J. Wortley |
| | | Executive Vice President and Chief Financial Officer |
| | | (on behalf of the registrant and
as principal financial officer) |
| | | |
Date: | May 8, 2019 | By: | /s/ Leonard E. Travis |
| | | Leonard E. Travis |
| | | Vice President and Chief Accounting Officer |
| | | (on behalf of the registrant and
as principal accounting officer) |