CHENIERE ENERGY, INC. March 2018 CHENIERE ENERGY, INC. NYSE American: LNG CORPORATE PRESENTATION May 2018
Safe Harbor Statements Forward-Looking Statements This presentation contains certain statements that are, or may be deemed to be, “forward-looking statements” within the meaning of Section 27A of the Securities Act of 1933, as amended, and Section 21E of the Securities Exchange Act of 1934, as amended. All statements, other than statements of historical or present facts or conditions, included or incorporated by reference herein are “forward-looking statements.” Included among “forward-looking statements” are, among other things: • statements regarding the ability of Cheniere Energy Partners, L.P. to pay distributions to its unitholders or Cheniere Energy Partners LP Holdings, LLC or Cheniere Energy, Inc. to pay dividends to its shareholders or participate in share or unit buybacks; • statements regarding Cheniere Energy, Inc.’s, Cheniere Energy Partners LP Holdings, LLC’s or Cheniere Energy Partners, L.P.’s expected receipt of cash distributions from their respective subsidiaries; • statements that Cheniere Energy Partners, L.P. expects to commence or complete construction of its proposed liquefied natural gas (“LNG”) terminals, liquefaction facilities, pipeline facilities or other projects, or any expansions or portions thereof, by certain dates or at all; • statements that Cheniere Energy, Inc. expects to commence or complete construction of its proposed LNG terminals, liquefaction facilities, pipeline facilities or other projects, or any expansions or portions then of, by certain dates or at all; • statements regarding future levels of domestic and international natural gas production, supply or consumption or future levels of LNG imports into or exports from North America and other countries worldwide, or purchases of natural gas, regardless of the source of such information, or the transportation or other infrastructure, or demand for and prices related to natural gas, LNG or other hydrocarbon products; • statements regarding any financing transactions or arrangements, or ability to enter into such transactions; • statements relating to the construction of our proposed liquefaction facilities and natural gas liquefaction trains (“Trains”) and the construction of the Corpus Christi Pipeline, including statements concerning the engagement of any engineering, procurement and construction ("EPC") contractor or other contractor and the anticipated terms and provisions of any agreement with any EPC or other contractor, and anticipated costs related thereto; • statements regarding any agreement to be entered into or performed substantially in the future, including any revenues anticipated to be received and the anticipated timing thereof, and statements regarding the amounts of total LNG regasification, natural gas, liquefaction or storage capacities that are, or may become, subject to contracts; • statements regarding counterparties to our commercial contracts, construction contracts and other contracts; • statements regarding our planned development and construction of additional Trains or pipelines, including the financing of such Trains or pipelines; • statements that our Trains, when completed, will have certain characteristics, including amounts of liquefaction capacities; • statements regarding our business strategy, our strengths, our business and operation plans or any other plans, forecasts, projections or objectives, including anticipated revenues, capital expenditures, maintenance and operating costs, run-rate SG&A estimates, cash flows, EBITDA, Adjusted EBITDA, distributable cash flow, distributable cash flow per share and unit, deconsolidated debt outstanding, and deconsolidated contracted EBITDA, any or all of which are subject to change; • statements regarding projections of revenues, expenses, earnings or losses, working capital or other financial items; • statements regarding legislative, governmental, regulatory, administrative or other public body actions, approvals, requirements, permits, applications, filings, investigations, proceedings or decisions; • statements regarding our anticipated LNG and natural gas marketing activities; and • any other statements that relate to non-historical or future information. These forward-looking statements are often identified by the use of terms and phrases such as “achieve,” “anticipate,” “believe,” “contemplate,” “develop,” “estimate,” “example,” “expect,” “forecast,” “goals,” ”guidance,” “opportunities,” “plan,” “potential,” “project,” “propose,” “subject to,” “strategy,” “target,” and similar terms and phrases, or by use of future tense. Although we believe that the expectations reflected in these forward-looking statements are reasonable, they do involve assumptions, risks and uncertainties, and these expectations may prove to be incorrect. You should not place undue reliance on these forward-looking statements, which speak only as of the date of this presentation. Our actual results could differ materially from those anticipated in these forward-looking statements as a result of a variety of factors, including those discussed in “Risk Factors” in the Cheniere Energy, Inc., Cheniere Energy Partners, L.P. and Cheniere Energy Partners LP Holdings, LLC Annual Reports on Form 10-K filed with the SEC on February 21, 2018, which are incorporated by reference into this presentation. All forward-looking statements attributable to us or persons acting on our behalf are expressly qualified in their entirety by these ”Risk Factors.” These forward-looking statements are made as of the date of this presentation, and other than as required by law, we undertake no obligation to update or revise any forward-looking statement or provide reasons why actual results may differ, whether as a result of new information, future events or otherwise. Reconciliation to U.S. GAAP Financial Information The following presentation includes certain “non-GAAP financial measures” as defined in Regulation G under the Securities Exchange Act of 1934, as amended. Schedules are included in the appendix hereto that reconcile the non-GAAP financial measures included in the following presentation to the most directly comparable financial measures calculated and presented in accordance with U.S. GAAP. 2
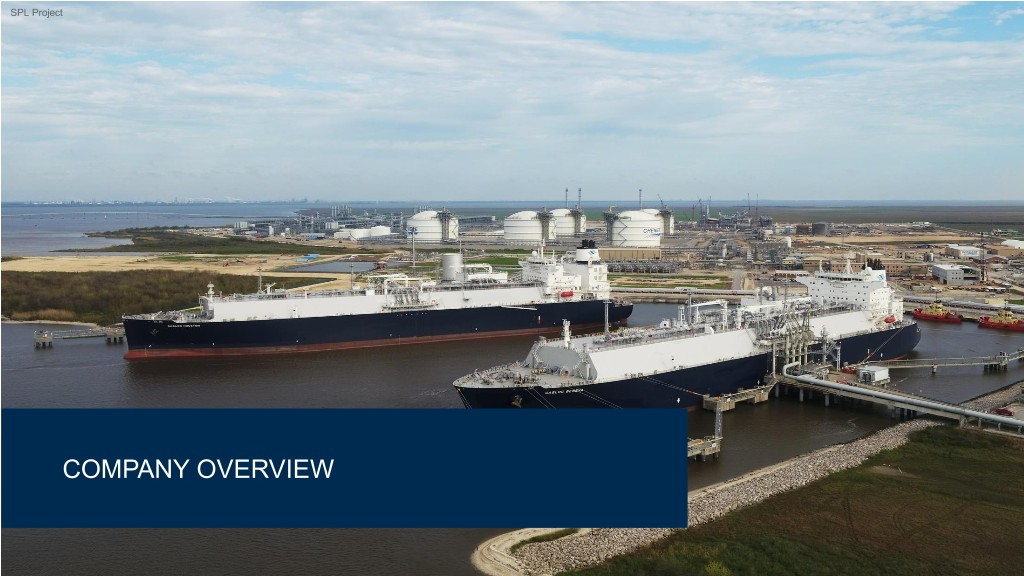
SPL Project CHENIERE OVERVIEW COMPANY OVERVIEW
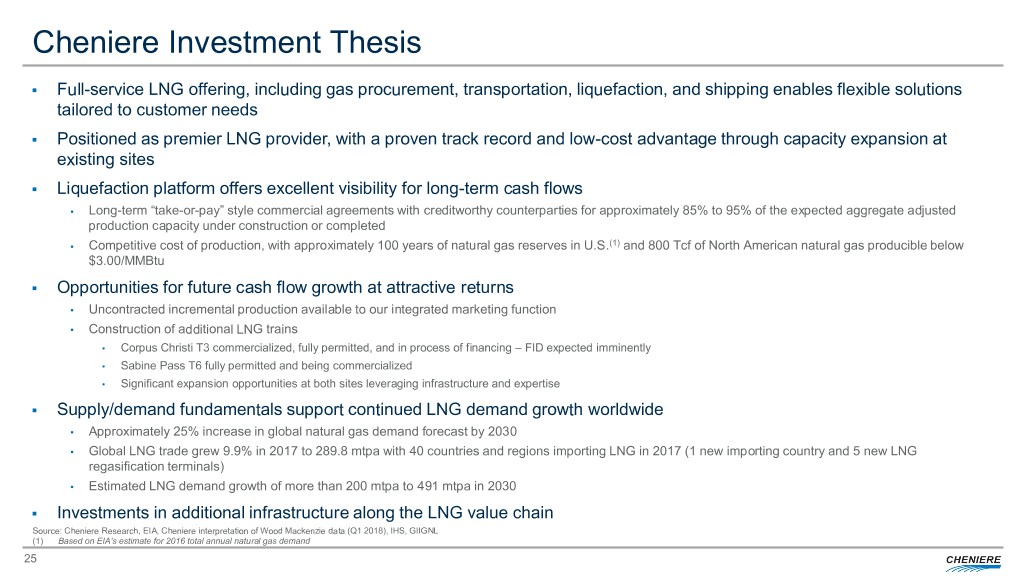
Cheniere Investment Thesis . Full-service LNG offering, including gas procurement, transportation, liquefaction, and shipping enables flexible solutions tailored to customer needs . Positioned as premier LNG provider, with a proven track record and low-cost advantage through capacity expansion at existing sites . Liquefaction platform offers excellent visibility for long-term cash flows • Long-term “take-or-pay” style commercial agreements with creditworthy counterparties for approximately 85% to 95% of the expected aggregate adjusted production capacity under construction or completed • Competitive cost of production, with approximately 100 years of natural gas reserves in U.S.(1) and 800 Tcf of North American natural gas producible below $3.00/MMBtu . Opportunities for future cash flow growth at attractive returns • Uncontracted incremental production available to our integrated marketing function • Construction of additional LNG trains • Corpus Christi T3 commercialized, fully permitted, and in process of financing – FID expected imminently • Sabine Pass T6 fully permitted and being commercialized • Significant expansion opportunities at both sites leveraging infrastructure and expertise . Supply/demand fundamentals support continued LNG demand growth worldwide • Approximately 25% increase in global natural gas demand forecast by 2030 • Global LNG trade grew 9.9% in 2017 to 289.8 mtpa with 40 countries and regions importing LNG in 2017 (1 new importing country and 5 new LNG regasification terminals) • Estimated LNG demand growth of more than 200 mtpa to 491 mtpa in 2030 . Investments in additional infrastructure along the LNG value chain Source: Cheniere Research, EIA, Cheniere interpretation of Wood Mackenzie data (Q1 2018), IHS, GIIGNL (1) Based on EIA’s estimate for 2016 total annual natural gas demand 4
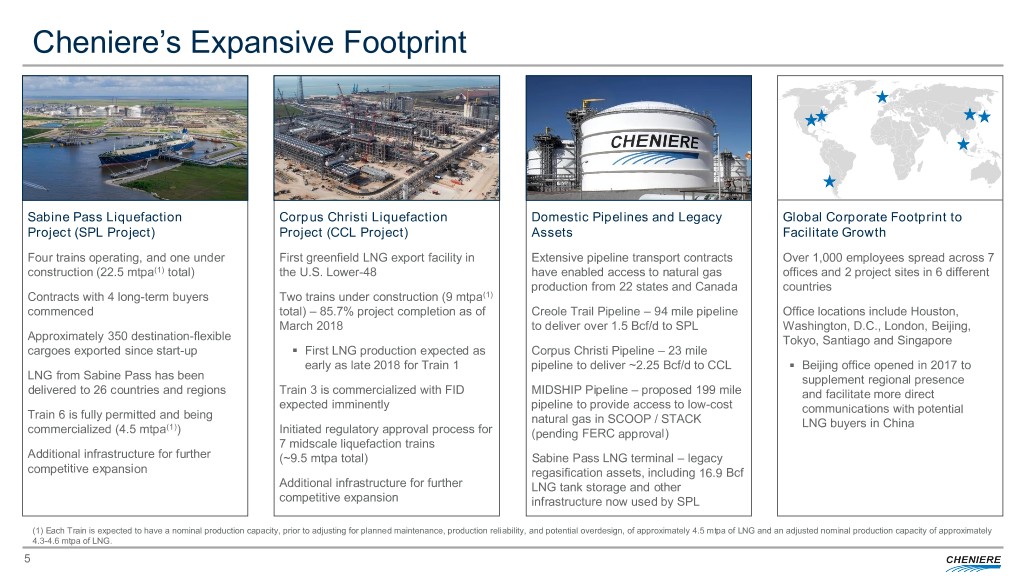
Cheniere’s Expansive Footprint Sabine Pass Liquefaction Corpus Christi Liquefaction Domestic Pipelines and Legacy Global Corporate Footprint to Project (SPL Project) Project (CCL Project) Assets Facilitate Growth Four trains operating, and one under First greenfield LNG export facility in Extensive pipeline transport contracts Over 1,000 employees spread across 7 construction (22.5 mtpa(1) total) the U.S. Lower-48 have enabled access to natural gas offices and 2 project sites in 6 different production from 22 states and Canada countries (1) Contracts with 4 long-term buyers Two trains under construction (9 mtpa commenced total) – 85.7% project completion as of Creole Trail Pipeline – 94 mile pipeline Office locations include Houston, March 2018 to deliver over 1.5 Bcf/d to SPL Washington, D.C., London, Beijing, Approximately 350 destination-flexible . Tokyo, Santiago and Singapore cargoes exported since start-up First LNG production expected as Corpus Christi Pipeline – 23 mile early as late 2018 for Train 1 pipeline to deliver ~2.25 Bcf/d to CCL . Beijing office opened in 2017 to LNG from Sabine Pass has been supplement regional presence delivered to 26 countries and regions Train 3 is commercialized with FID MIDSHIP Pipeline – proposed 199 mile and facilitate more direct expected imminently pipeline to provide access to low-cost communications with potential Train 6 is fully permitted and being natural gas in SCOOP / STACK commercialized (4.5 mtpa(1)) Initiated regulatory approval process for LNG buyers in China (pending FERC approval) 7 midscale liquefaction trains Additional infrastructure for further (~9.5 mtpa total) Sabine Pass LNG terminal – legacy competitive expansion regasification assets, including 16.9 Bcf Additional infrastructure for further LNG tank storage and other competitive expansion infrastructure now used by SPL (1) Each Train is expected to have a nominal production capacity, prior to adjusting for planned maintenance, production reliability, and potential overdesign, of approximately 4.5 mtpa of LNG and an adjusted nominal production capacity of approximately 4.3-4.6 mtpa of LNG. 5
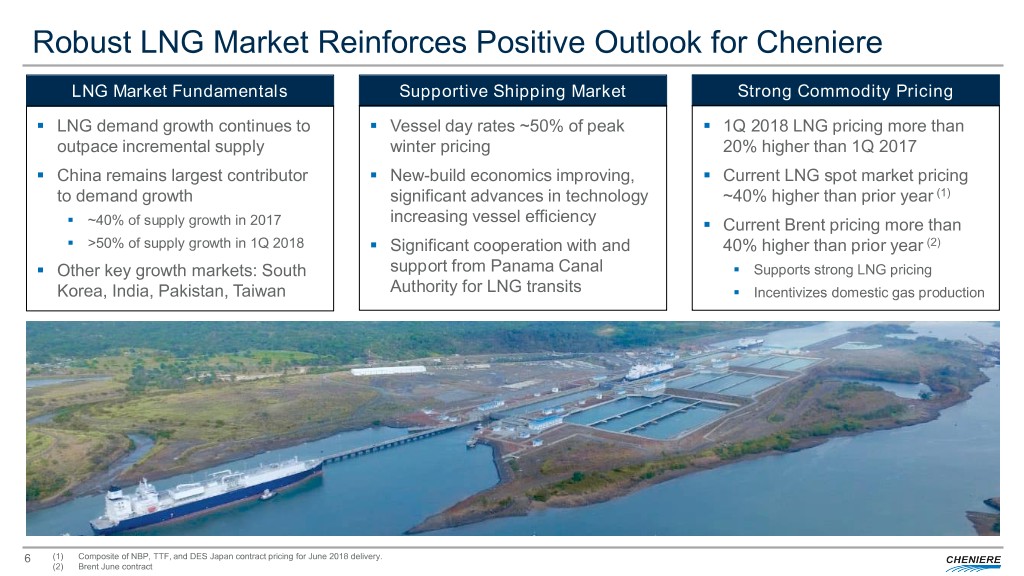
Robust LNG Market Reinforces Positive Outlook for Cheniere LNG Market Fundamentals Supportive Shipping Market Strong Commodity Pricing . LNG demand growth continues to . Vessel day rates ~50% of peak . 1Q 2018 LNG pricing more than outpace incremental supply winter pricing 20% higher than 1Q 2017 . China remains largest contributor . New-build economics improving, . Current LNG spot market pricing to demand growth significant advances in technology ~40% higher than prior year (1) . ~40% of supply growth in 2017 increasing vessel efficiency . Current Brent pricing more than . >50% of supply growth in 1Q 2018 . Significant cooperation with and 40% higher than prior year (2) . Other key growth markets: South support from Panama Canal . Supports strong LNG pricing Korea, India, Pakistan, Taiwan Authority for LNG transits . Incentivizes domestic gas production 6 (1) Composite of NBP, TTF, and DES Japan contract pricing for June 2018 delivery. (2) Brent June contract
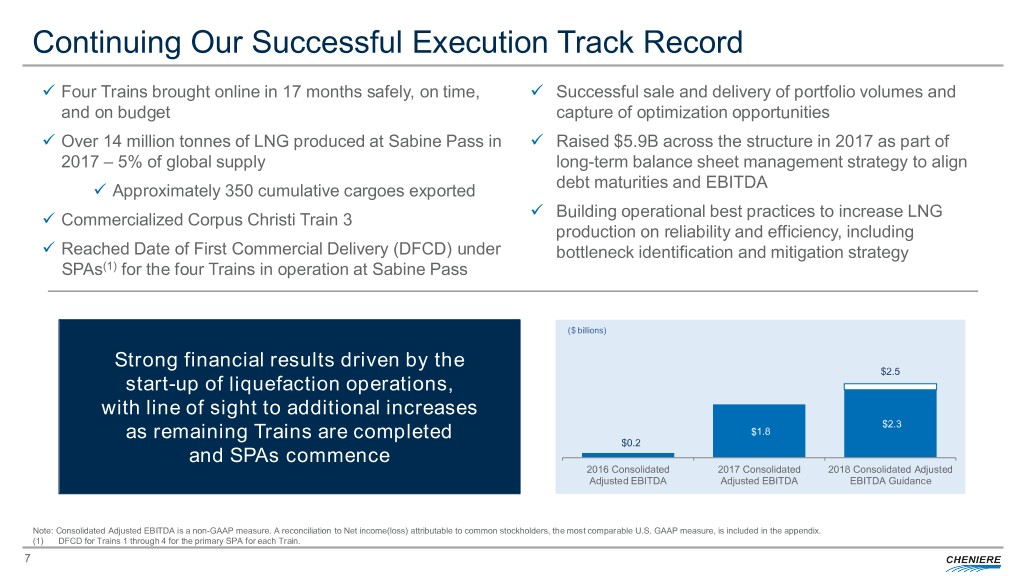
Continuing Our Successful Execution Track Record Four Trains brought online in 17 months safely, on time, Successful sale and delivery of portfolio volumes and and on budget capture of optimization opportunities Over 14 million tonnes of LNG produced at Sabine Pass in Raised $5.9B across the structure in 2017 as part of 2017 – 5% of global supply long-term balance sheet management strategy to align Approximately 350 cumulative cargoes exported debt maturities and EBITDA Commercialized Corpus Christi Train 3 Building operational best practices to increase LNG production on reliability and efficiency, including Reached Date of First Commercial Delivery (DFCD) under bottleneck identification and mitigation strategy SPAs(1) for the four Trains in operation at Sabine Pass ($ billions) Strong financial results driven by the $2.5 start-up of liquefaction operations, with line of sight to additional increases $2.3 as remaining Trains are completed $1.8 $0.2 and SPAs commence 2016 Consolidated 2017 Consolidated 2018 Consolidated Adjusted Adjusted EBITDA Adjusted EBITDA EBITDA Guidance Note: Consolidated Adjusted EBITDA is a non-GAAP measure. A reconciliation to Net income(loss) attributable to common stockholders, the most comparable U.S. GAAP measure, is included in the appendix. (1) DFCD for Trains 1 through 4 for the primary SPA for each Train. 7
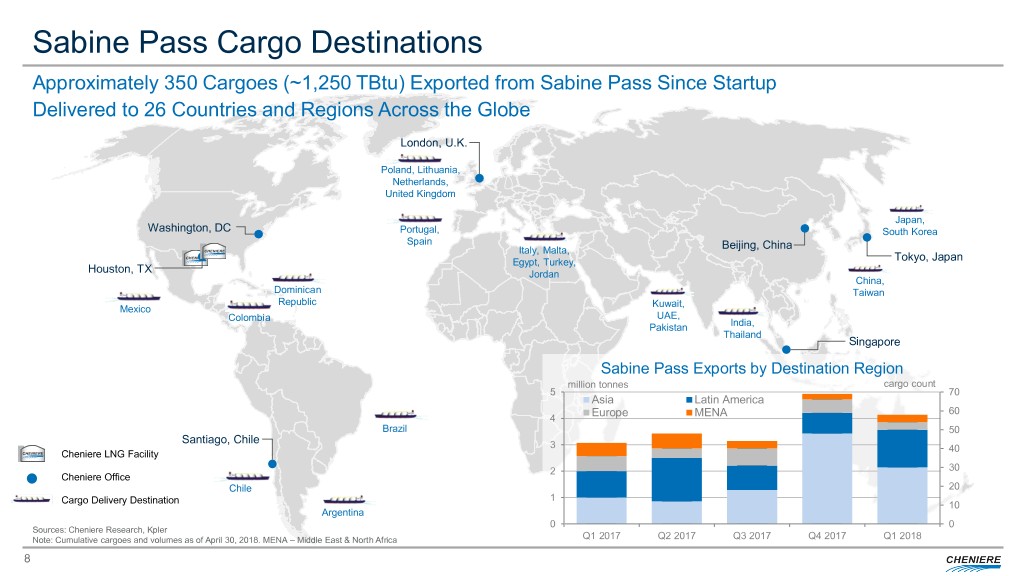
Sabine Pass Cargo Destinations Approximately 350 Cargoes (~1,250 TBtu) Exported from Sabine Pass Since Startup Delivered to 26 Countries and Regions Across the Globe London, U.K. Poland, Lithuania, Netherlands, United Kingdom Japan, Washington, DC Portugal, South Korea Spain Italy, Malta, Beijing, China Egypt, Turkey, Tokyo, Japan Houston, TX Jordan China, Dominican Taiwan Republic Kuwait, Mexico Colombia UAE, Pakistan India, Thailand Singapore Sabine Pass Exports by Destination Region million tonnes cargo count 5 70 Asia Latin America Europe MENA 60 4 Brazil 50 Santiago, Chile 3 40 Cheniere LNG Facility 2 30 Cheniere Office Chile 20 1 Cargo Delivery Destination 10 Argentina 0 0 Sources: Cheniere Research, Kpler Note: Cumulative cargoes and volumes as of April 30, 2018. MENA – Middle East & North Africa Q1 2017 Q2 2017 Q3 2017 Q4 2017 Q1 2018 8
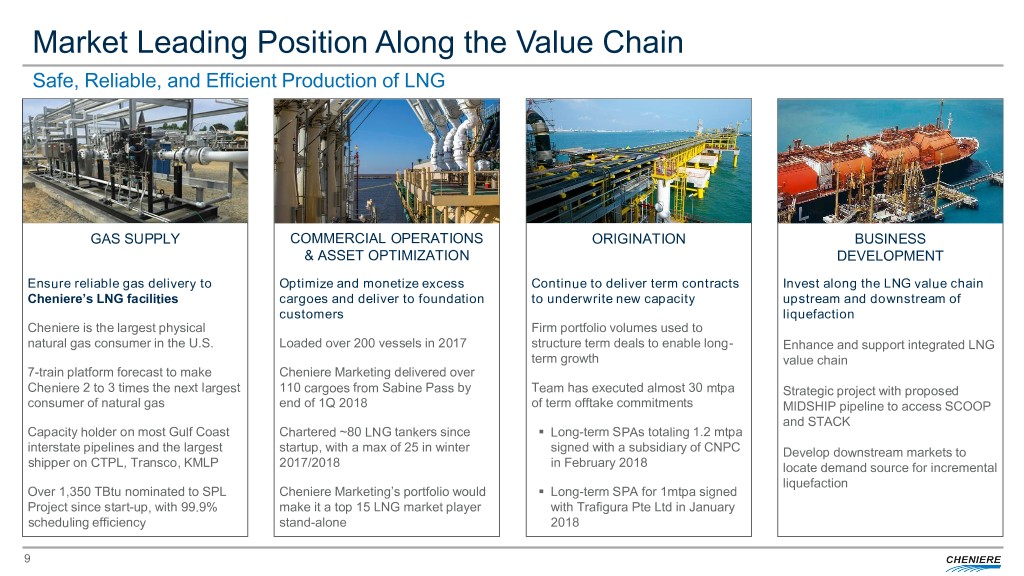
Market Leading Position Along the Value Chain Safe, Reliable, and Efficient Production of LNG GAS SUPPLY COMMERCIAL OPERATIONS ORIGINATION BUSINESS & ASSET OPTIMIZATION DEVELOPMENT Ensure reliable gas delivery to Optimize and monetize excess Continue to deliver term contracts Invest along the LNG value chain Cheniere’s LNG facilities cargoes and deliver to foundation to underwrite new capacity upstream and downstream of customers liquefaction Cheniere is the largest physical Firm portfolio volumes used to natural gas consumer in the U.S. Loaded over 200 vessels in 2017 structure term deals to enable long- Enhance and support integrated LNG term growth value chain 7-train platform forecast to make Cheniere Marketing delivered over Cheniere 2 to 3 times the next largest 110 cargoes from Sabine Pass by Team has executed almost 30 mtpa Strategic project with proposed consumer of natural gas end of 1Q 2018 of term offtake commitments MIDSHIP pipeline to access SCOOP . and STACK Capacity holder on most Gulf Coast Chartered ~80 LNG tankers since Long-term SPAs totaling 1.2 mtpa interstate pipelines and the largest startup, with a max of 25 in winter signed with a subsidiary of CNPC Develop downstream markets to shipper on CTPL, Transco, KMLP 2017/2018 in February 2018 locate demand source for incremental liquefaction Over 1,350 TBtu nominated to SPL Cheniere Marketing’s portfolio would . Long-term SPA for 1mtpa signed Project since start-up, with 99.9% make it a top 15 LNG market player with Trafigura Pte Ltd in January scheduling efficiency stand-alone 2018 9
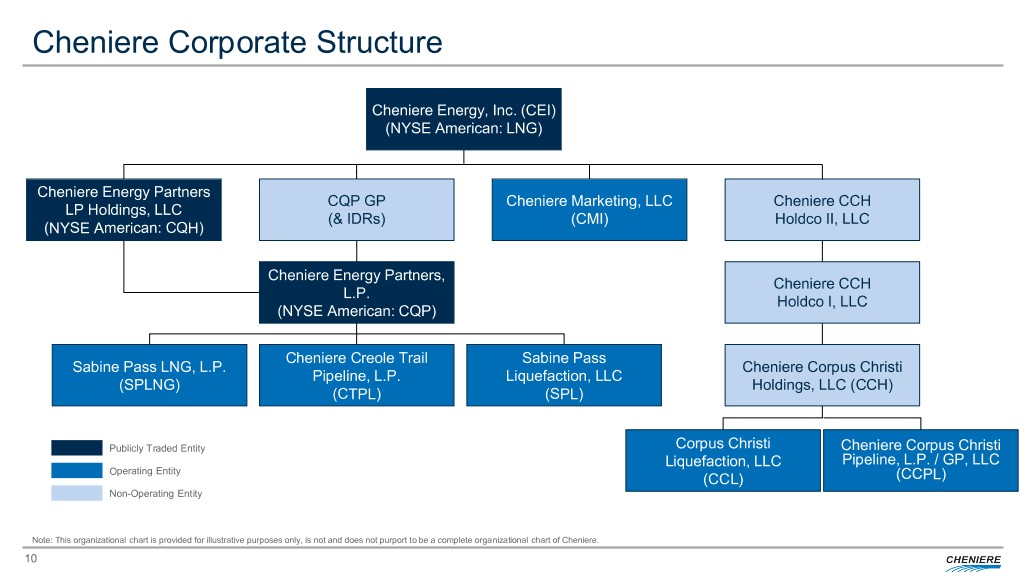
Cheniere Corporate Structure Cheniere Energy, Inc. (CEI) (NYSE American: LNG) Cheniere Energy Partners CQP GP Cheniere Marketing, LLC Cheniere CCH LP Holdings, LLC (& IDRs) (CMI) Holdco II, LLC (NYSE American: CQH) Cheniere Energy Partners, Cheniere CCH L.P. Holdco I, LLC (NYSE American: CQP) Cheniere Creole Trail Sabine Pass Sabine Pass LNG, L.P. Cheniere Corpus Christi Pipeline, L.P. Liquefaction, LLC (SPLNG) Holdings, LLC (CCH) (CTPL) (SPL) Publicly Traded Entity Corpus Christi Cheniere Corpus Christi Liquefaction, LLC Pipeline, L.P. / GP, LLC Operating Entity (CCL) (CCPL) Non-Operating Entity Note: This organizational chart is provided for illustrative purposes only, is not and does not purport to be a complete organizational chart of Cheniere. 10
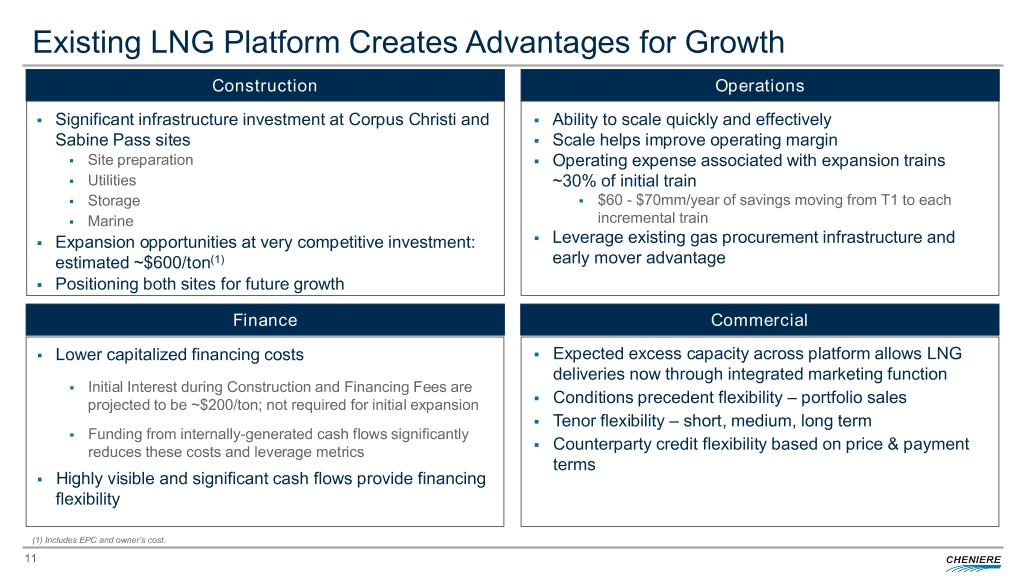
Existing LNG Platform Creates Advantages for Growth Construction Operations . Significant infrastructure investment at Corpus Christi and . Ability to scale quickly and effectively Sabine Pass sites . Scale helps improve operating margin . Site preparation . Operating expense associated with expansion trains . Utilities ~30% of initial train . Storage . $60 - $70mm/year of savings moving from T1 to each . Marine incremental train . . Expansion opportunities at very competitive investment: Leverage existing gas procurement infrastructure and estimated ~$600/ton(1) early mover advantage . Positioning both sites for future growth Finance Commercial . Lower capitalized financing costs . Expected excess capacity across platform allows LNG deliveries now through integrated marketing function . Initial Interest during Construction and Financing Fees are . projected to be ~$200/ton; not required for initial expansion Conditions precedent flexibility – portfolio sales . Tenor flexibility – short, medium, long term . Funding from internally-generated cash flows significantly . reduces these costs and leverage metrics Counterparty credit flexibility based on price & payment terms . Highly visible and significant cash flows provide financing flexibility (1) Includes EPC and owner’s cost. 11
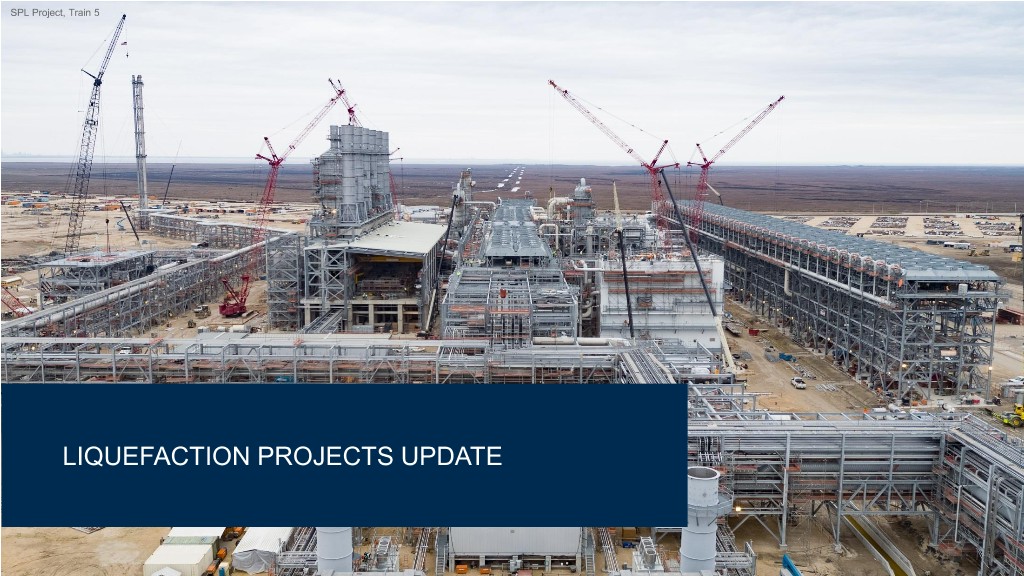
SPL Project, Train 5 CHENIERE OVERVIEW LIQUEFACTION PROJECTS UPDATE
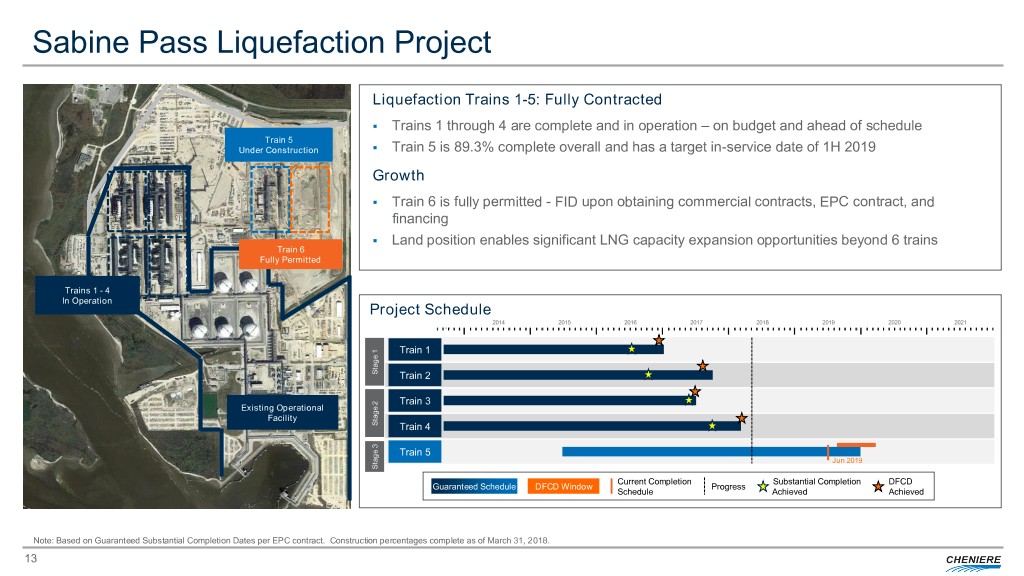
Sabine Pass Liquefaction Project Liquefaction Trains 1-5: Fully Contracted . Trains 1 through 4 are complete and in operation – on budget and ahead of schedule Train 5 . Under Construction Train 5 is 89.3% complete overall and has a target in-service date of 1H 2019 Growth . Train 6 is fully permitted - FID upon obtaining commercial contracts, EPC contract, and financing . Land position enables significant LNG capacity expansion opportunities beyond 6 trains Train 6 Fully Permitted Trains 1 - 4 In Operation Project Schedule … 2014 2015 2016 2017 2018 2019 2020 2021 Train 1 Stage 1 Stage Train 2 Train 3 Existing Operational Facility Stage 2 Stage Train 4 Train 5 Jun 2019 Stage 3 Stage Current Completion Substantial Completion DFCD Guaranteed Schedule DFCD Window Progress Schedule Achieved Achieved Note: Based on Guaranteed Substantial Completion Dates per EPC contract. Construction percentages complete as of March 31, 2018. 13
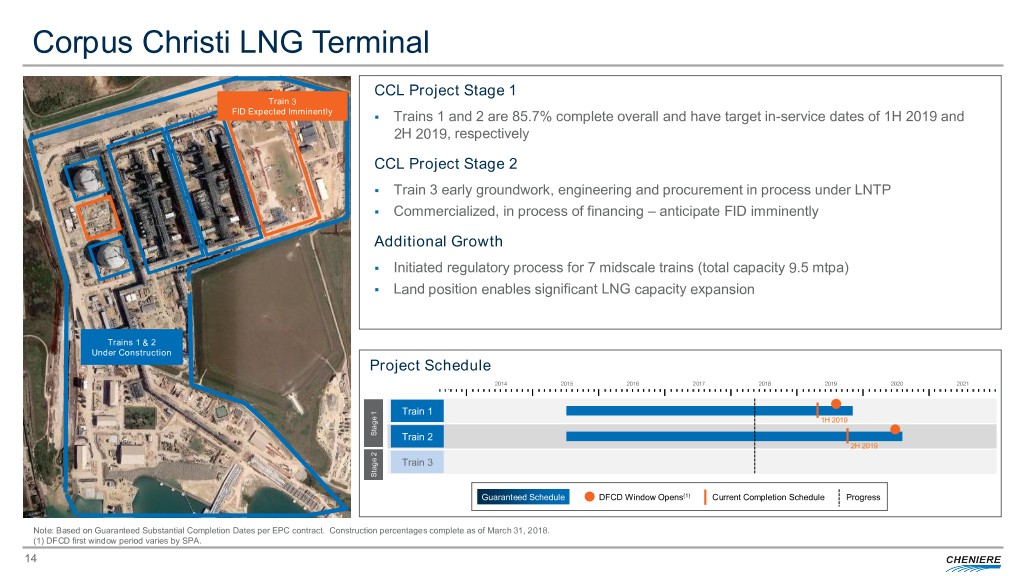
Corpus Christi LNG Terminal CCL Project Stage 1 Train 3 FID Expected Imminently . Trains 1 and 2 are 85.7% complete overall and have target in-service dates of 1H 2019 and 2H 2019, respectively CCL Project Stage 2 . Train 3 early groundwork, engineering and procurement in process under LNTP . Commercialized, in process of financing – anticipate FID imminently Additional Growth . Initiated regulatory process for 7 midscale trains (total capacity 9.5 mtpa) . Land position enables significant LNG capacity expansion Trains 1 & 2 Under Construction Project Schedule … 2014 2015 2016 2017 2018 2019 2020 2021 Train 1 1H 2019 Stage 1 Stage Train 2 2H 2019 Train 3 Stage 2 Stage Guaranteed Schedule DFCD Window Opens(1) Current Completion Schedule Progress Note: Based on Guaranteed Substantial Completion Dates per EPC contract. Construction percentages complete as of March 31, 2018. (1) DFCD first window period varies by SPA. 14
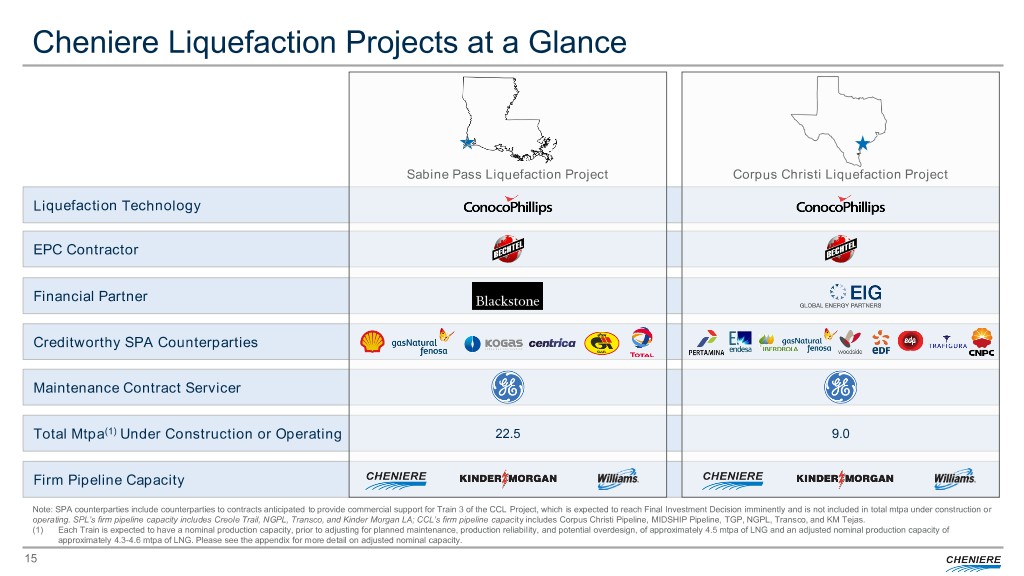
Cheniere Liquefaction Projects at a Glance Sabine Pass Liquefaction Project Corpus Christi Liquefaction Project Liquefaction Technology EPC Contractor Financial Partner Creditworthy SPA Counterparties Maintenance Contract Servicer Total Mtpa(1) Under Construction or Operating 22.5 9.0 Firm Pipeline Capacity Note: SPA counterparties include counterparties to contracts anticipated to provide commercial support for Train 3 of the CCL Project, which is expected to reach Final Investment Decision imminently and is not included in total mtpa under construction or operating. SPL’s firm pipeline capacity includes Creole Trail, NGPL, Transco, and Kinder Morgan LA; CCL’s firm pipeline capacity includes Corpus Christi Pipeline, MIDSHIP Pipeline, TGP, NGPL, Transco, and KM Tejas. (1) Each Train is expected to have a nominal production capacity, prior to adjusting for planned maintenance, production reliability, and potential overdesign, of approximately 4.5 mtpa of LNG and an adjusted nominal production capacity of approximately 4.3-4.6 mtpa of LNG. Please see the appendix for more detail on adjusted nominal capacity. 15
CHENIERE OVERVIEW LNG MARKET OUTLOOK
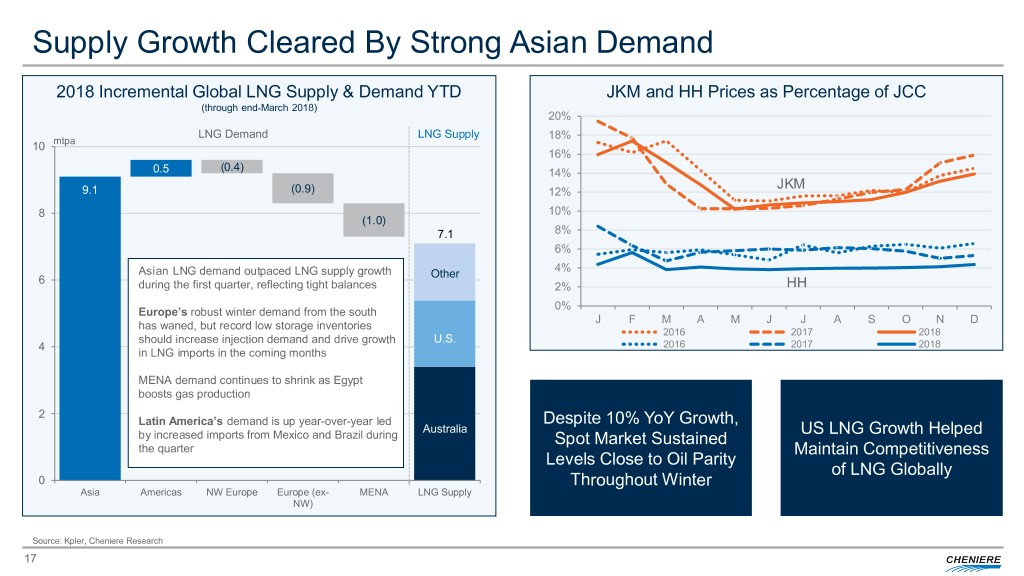
Supply Growth Cleared By Strong Asian Demand 2018 Incremental Global LNG Supply & Demand YTD JKM and HH Prices as Percentage of JCC (through end-March 2018) 20% LNG Demand LNG Supply 18% 10 mtpa 16% (0.4) 0.5 14% JKM 9.1 (0.9) 12% 8 10% (1.0) 7.1 8% 6% 4% Asian LNG demand outpaced LNG supply growth Other 6 during the first quarter, reflecting tight balances 2% HH 0% Europe’s robust winter demand from the south J F M A M J J A S O N D has waned, but record low storage inventories 2016 2017 2018 should increase injection demand and drive growth U.S. 4 2016 2017 2018 in LNG imports in the coming months MENA demand continues to shrink as Egypt boosts gas production 2 Latin America’s demand is up year-over-year led Despite 10% YoY Growth, Australia US LNG Growth Helped by increased imports from Mexico and Brazil during Spot Market Sustained the quarter Maintain Competitiveness Levels Close to Oil Parity of LNG Globally 0 Throughout Winter Asia Americas NW Europe Europe (ex- MENA LNG Supply NW) Source: Kpler, Cheniere Research 17
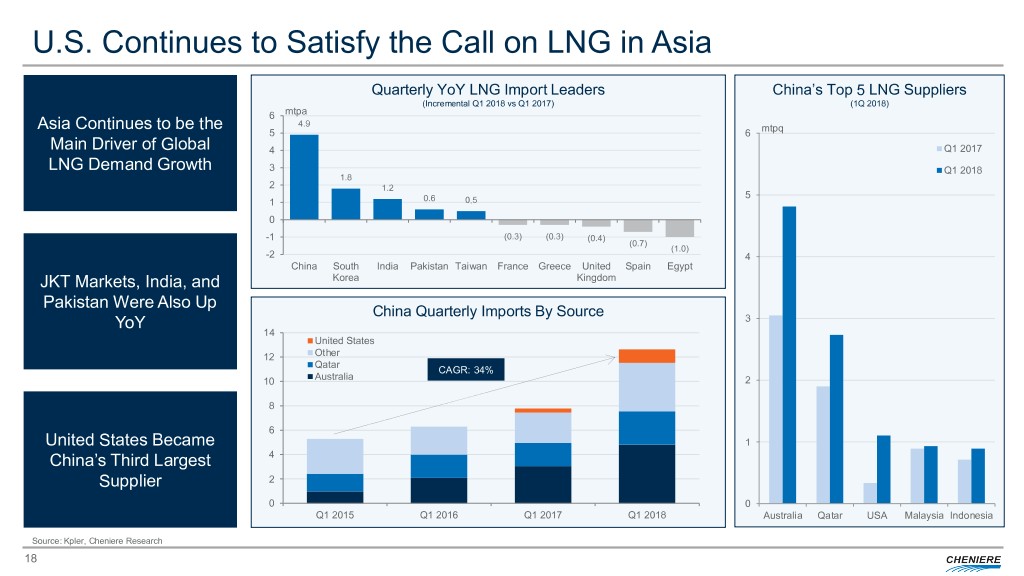
U.S. Continues to Satisfy the Call on LNG in Asia Quarterly YoY LNG Import Leaders China’s Top 5 LNG Suppliers (Incremental Q1 2018 vs Q1 2017) (1Q 2018) 6 mtpa Asia Continues to be the 4.9 5 6 mtpq Main Driver of Global 4 Q1 2017 LNG Demand Growth 3 Q1 2018 1.8 2 1.2 5 1 0.6 0.5 0 -1 (0.3) (0.3) (0.4) (0.7) (1.0) -2 4 China South India Pakistan Taiwan France Greece United Spain Egypt JKT Markets, India, and Korea Kingdom Pakistan Were Also Up China Quarterly Imports By Source YoY 3 14 United States 12 Other Qatar CAGR: 34% 10 Australia 2 8 6 United States Became 1 China’s Third Largest 4 Supplier 2 0 0 Q1 2015 Q1 2016 Q1 2017 Q1 2018 Australia Qatar USA Malaysia Indonesia Source: Kpler, Cheniere Research 18
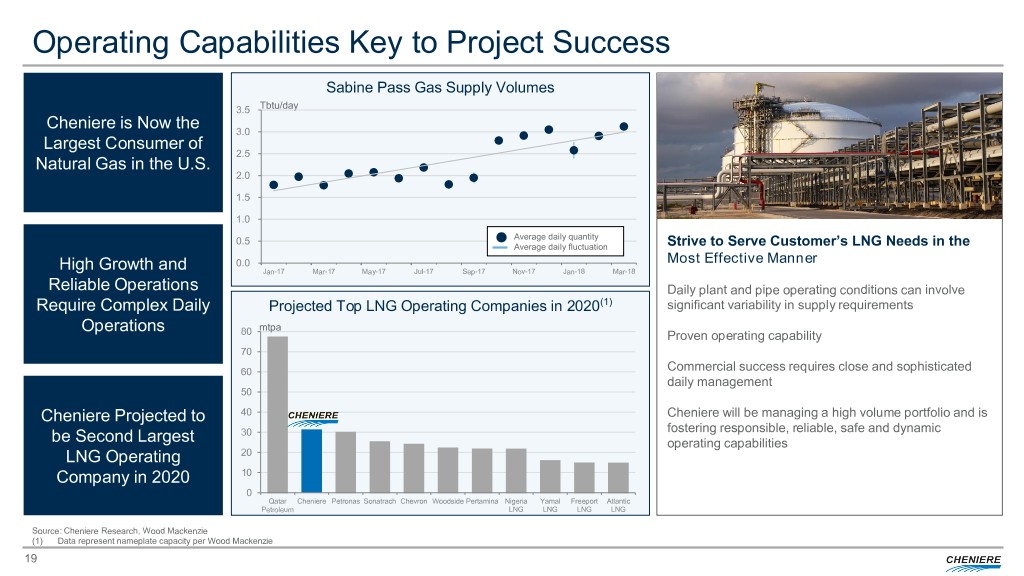
Operating Capabilities Key to Project Success Sabine Pass Gas Supply Volumes 3.5 Tbtu/day Cheniere is Now the 3.0 Largest Consumer of 2.5 Natural Gas in the U.S. 2.0 1.5 1.0 0.5 Average daily quantity Average daily fluctuation Strive to Serve Customer’s LNG Needs in the High Growth and 0.0 Most Effective Manner Jan-17 Mar-17 May-17 Jul-17 Sep-17 Nov-17 Jan-18 Mar-18 Reliable Operations Daily plant and pipe operating conditions can involve Require Complex Daily Projected Top LNG Operating Companies in 2020(1) significant variability in supply requirements Operations mtpa 80 Proven operating capability 70 60 Commercial success requires close and sophisticated daily management 50 Cheniere Projected to 40 Cheniere will be managing a high volume portfolio and is 30 fostering responsible, reliable, safe and dynamic be Second Largest operating capabilities LNG Operating 20 Company in 2020 10 0 Qatar Cheniere Petronas Sonatrach Chevron Woodside Pertamina Nigeria Yamal Freeport Atlantic Petroleum LNG LNG LNG LNG Source: Cheniere Research, Wood Mackenzie (1) Data represent nameplate capacity per Wood Mackenzie 19
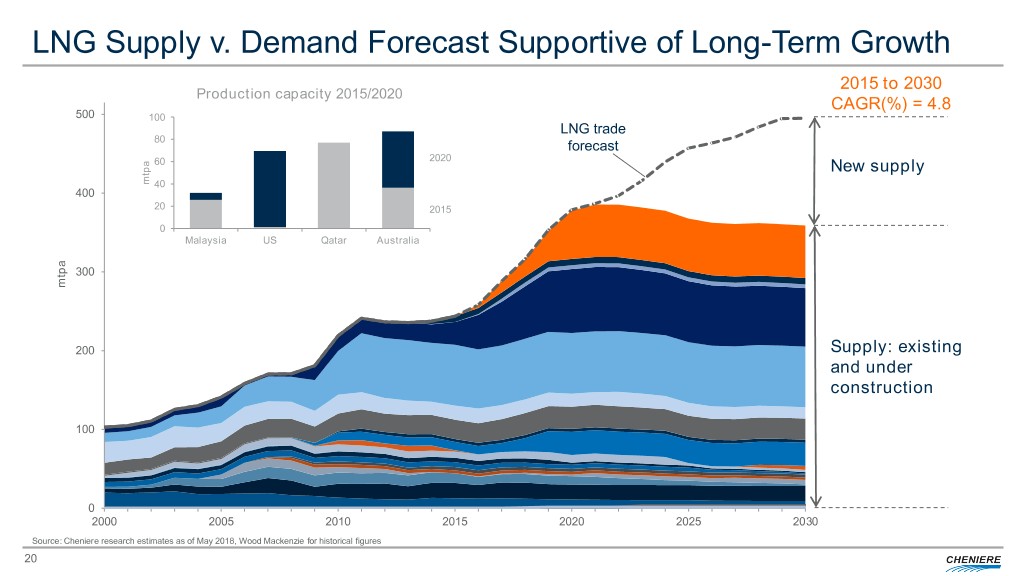
LNG Supply v. Demand Forecast Supportive of Long-Term Growth 2015 to 2030 Production capacity 2015/2020 CAGR(%) = 4.8 500 100 LNG trade 80 forecast 60 2020 New supply mtpa 40 400 20 2015 0 Malaysia US Qatar Australia 300 mtpa 200 Supply: existing and under construction 100 0 2000 2005 2010 2015 2020 2025 2030 Source: Cheniere research estimates as of May 2018, Wood Mackenzie for historical figures 20
SPL Project CHENIERE OVERVIEW FINANCIAL UPDATE
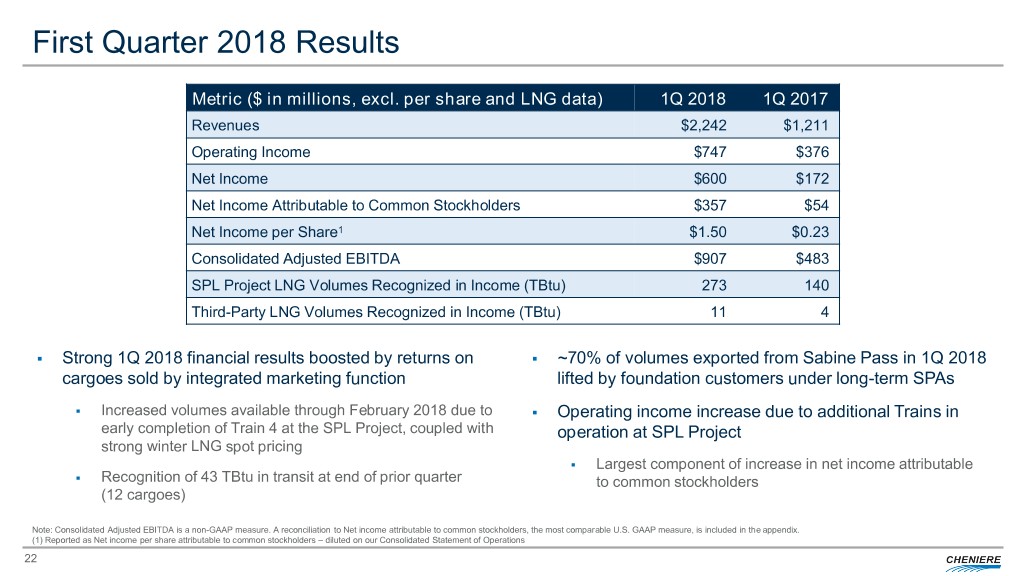
First Quarter 2018 Results Metric ($ in millions, excl. per share and LNG data) 1Q 2018 1Q 2017 Revenues $2,242 $1,211 Operating Income $747 $376 Net Income $600 $172 Net Income Attributable to Common Stockholders $357 $54 Net Income per Share1 $1.50 $0.23 Consolidated Adjusted EBITDA $907 $483 SPL Project LNG Volumes Recognized in Income (TBtu) 273 140 Third-Party LNG Volumes Recognized in Income (TBtu) 11 4 . Strong 1Q 2018 financial results boosted by returns on . ~70% of volumes exported from Sabine Pass in 1Q 2018 cargoes sold by integrated marketing function lifted by foundation customers under long-term SPAs . Increased volumes available through February 2018 due to . Operating income increase due to additional Trains in early completion of Train 4 at the SPL Project, coupled with operation at SPL Project strong winter LNG spot pricing . Largest component of increase in net income attributable . Recognition of 43 TBtu in transit at end of prior quarter to common stockholders (12 cargoes) Note: Consolidated Adjusted EBITDA is a non-GAAP measure. A reconciliation to Net income attributable to common stockholders, the most comparable U.S. GAAP measure, is included in the appendix. (1) Reported as Net income per share attributable to common stockholders – diluted on our Consolidated Statement of Operations 22
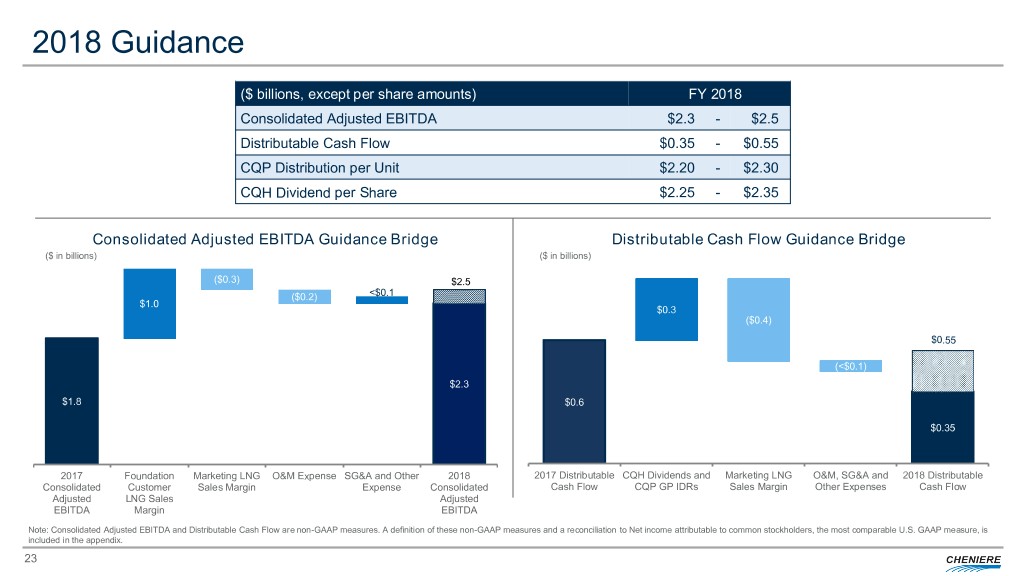
2018 Guidance ($ billions, except per share amounts) FY 2018 Consolidated Adjusted EBITDA $2.3 - $2.5 Distributable Cash Flow $0.35 - $0.55 CQP Distribution per Unit $2.20 - $2.30 CQH Dividend per Share $2.25 - $2.35 Consolidated Adjusted EBITDA Guidance Bridge Distributable Cash Flow Guidance Bridge ($ in billions) ($ in billions) ($0.3) $2.5 ($0.2) <$0.1 $1.0 $0.3 ($0.4) $0.55 (<$0.1) $2.3 $1.8 $0.6 $0.35 2017 Foundation Marketing LNG O&M Expense SG&A and Other 2018 2017 Distributable CQH Dividends and Marketing LNG O&M, SG&A and 2018 Distributable Consolidated Customer Sales Margin Expense Consolidated Cash Flow CQP GP IDRs Sales Margin Other Expenses Cash Flow Adjusted LNG Sales Adjusted EBITDA Margin EBITDA Note: Consolidated Adjusted EBITDA and Distributable Cash Flow are non-GAAP measures. A definition of these non-GAAP measures and a reconciliation to Net income attributable to common stockholders, the most comparable U.S. GAAP measure, is included in the appendix. 23
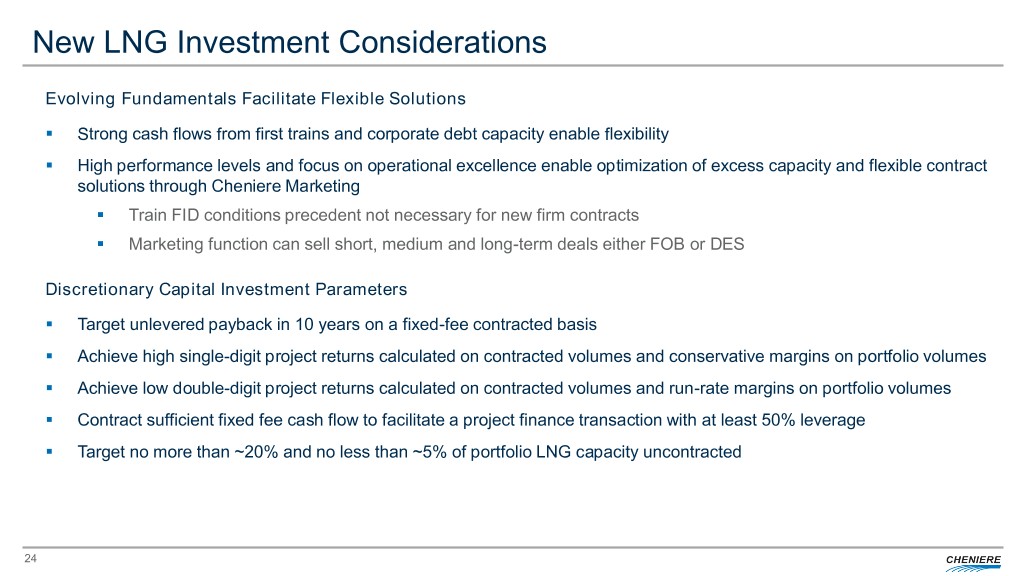
New LNG Investment Considerations Evolving Fundamentals Facilitate Flexible Solutions . Strong cash flows from first trains and corporate debt capacity enable flexibility . High performance levels and focus on operational excellence enable optimization of excess capacity and flexible contract solutions through Cheniere Marketing . Train FID conditions precedent not necessary for new firm contracts . Marketing function can sell short, medium and long-term deals either FOB or DES Discretionary Capital Investment Parameters . Target unlevered payback in 10 years on a fixed-fee contracted basis . Achieve high single-digit project returns calculated on contracted volumes and conservative margins on portfolio volumes . Achieve low double-digit project returns calculated on contracted volumes and run-rate margins on portfolio volumes . Contract sufficient fixed fee cash flow to facilitate a project finance transaction with at least 50% leverage . Target no more than ~20% and no less than ~5% of portfolio LNG capacity uncontracted 24
Cheniere Investment Thesis . Full-service LNG offering, including gas procurement, transportation, liquefaction, and shipping enables flexible solutions tailored to customer needs . Positioned as premier LNG provider, with a proven track record and low-cost advantage through capacity expansion at existing sites . Liquefaction platform offers excellent visibility for long-term cash flows • Long-term “take-or-pay” style commercial agreements with creditworthy counterparties for approximately 85% to 95% of the expected aggregate adjusted production capacity under construction or completed • Competitive cost of production, with approximately 100 years of natural gas reserves in U.S.(1) and 800 Tcf of North American natural gas producible below $3.00/MMBtu . Opportunities for future cash flow growth at attractive returns • Uncontracted incremental production available to our integrated marketing function • Construction of additional LNG trains • Corpus Christi T3 commercialized, fully permitted, and in process of financing – FID expected imminently • Sabine Pass T6 fully permitted and being commercialized • Significant expansion opportunities at both sites leveraging infrastructure and expertise . Supply/demand fundamentals support continued LNG demand growth worldwide • Approximately 25% increase in global natural gas demand forecast by 2030 • Global LNG trade grew 9.9% in 2017 to 289.8 mtpa with 40 countries and regions importing LNG in 2017 (1 new importing country and 5 new LNG regasification terminals) • Estimated LNG demand growth of more than 200 mtpa to 491 mtpa in 2030 . Investments in additional infrastructure along the LNG value chain Source: Cheniere Research, EIA, Cheniere interpretation of Wood Mackenzie data (Q1 2018), IHS, GIIGNL (1) Based on EIA’s estimate for 2016 total annual natural gas demand 25
CHENIERE OVERVIEW APPENDIX
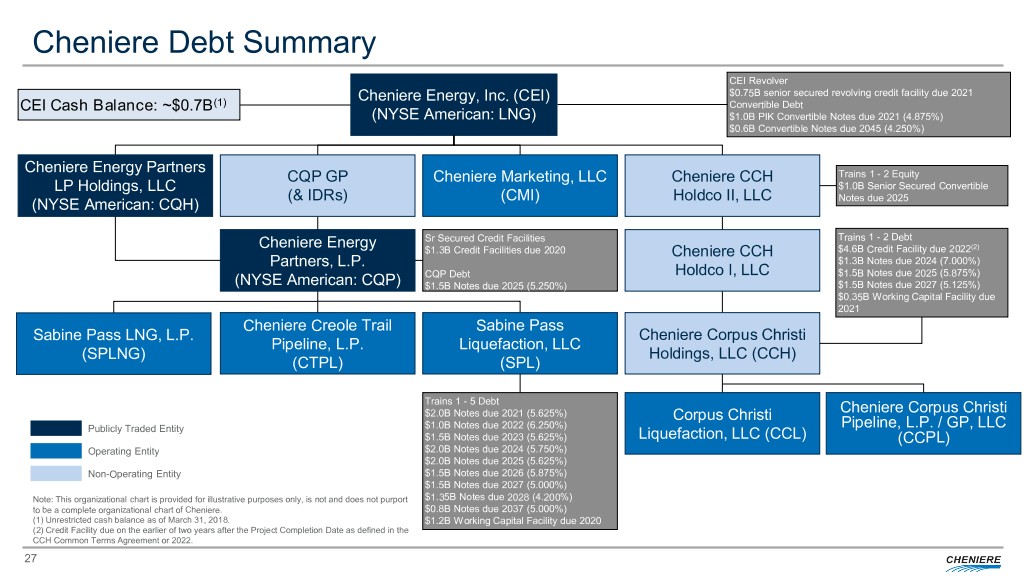
Cheniere Debt Summary CEI Revolver Cheniere Energy, Inc. (CEI) $0.75B senior secured revolving credit facility due 2021 CEI Cash Balance: ~$0.7B(1) Convertible Debt (NYSE American: LNG) $1.0B PIK Convertible Notes due 2021 (4.875%) $0.6B Convertible Notes due 2045 (4.250%) Cheniere Energy Partners CQP GP Cheniere Marketing, LLC Cheniere CCH Trains 1 - 2 Equity LP Holdings, LLC $1.0B Senior Secured Convertible (& IDRs) (CMI) Holdco II, LLC Notes due 2025 (NYSE American: CQH) Sr Secured Credit Facilities Trains 1 - 2 Debt Cheniere Energy (2) $1.3B Credit Facilities due 2020 Cheniere CCH $4.6B Credit Facility due 2022 Partners, L.P. $1.3B Notes due 2024 (7.000%) CQP Debt Holdco I, LLC $1.5B Notes due 2025 (5.875%) (NYSE American: CQP) $1.5B Notes due 2025 (5.250%) $1.5B Notes due 2027 (5.125%) $0.35B Working Capital Facility due 2021 Cheniere Creole Trail Sabine Pass Sabine Pass LNG, L.P. Cheniere Corpus Christi Pipeline, L.P. Liquefaction, LLC (SPLNG) Holdings, LLC (CCH) (CTPL) (SPL) Trains 1 - 5 Debt Cheniere Corpus Christi $2.0B Notes due 2021 (5.625%) Corpus Christi $1.0B Notes due 2022 (6.250%) Pipeline, L.P. / GP, LLC Publicly Traded Entity $1.5B Notes due 2023 (5.625%) Liquefaction, LLC (CCL) (CCPL) Operating Entity $2.0B Notes due 2024 (5.750%) $2.0B Notes due 2025 (5.625%) Non-Operating Entity $1.5B Notes due 2026 (5.875%) $1.5B Notes due 2027 (5.000%) Note: This organizational chart is provided for illustrative purposes only, is not and does not purport $1.35B Notes due 2028 (4.200%) to be a complete organizational chart of Cheniere. $0.8B Notes due 2037 (5.000%) (1) Unrestricted cash balance as of March 31, 2018. $1.2B Working Capital Facility due 2020 (2) Credit Facility due on the earlier of two years after the Project Completion Date as defined in the CCH Common Terms Agreement or 2022. 27
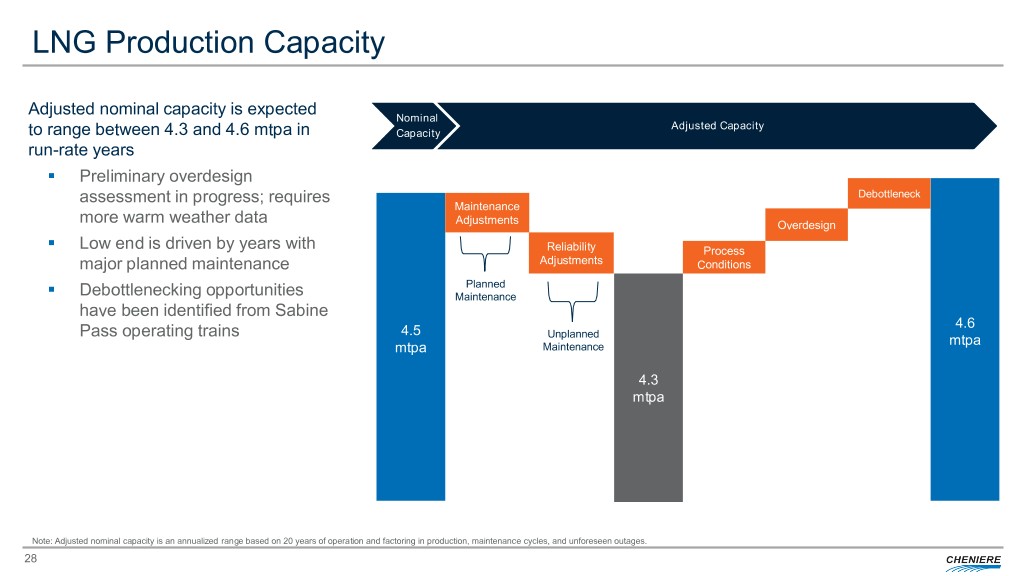
LNG Production Capacity Adjusted nominal capacity is expected Nominal Adjusted Capacity to range between 4.3 and 4.6 mtpa in Capacity run-rate years . Preliminary overdesign assessment in progress; requires Debottleneck Maintenance more warm weather data Adjustments Overdesign . Low end is driven by years with Reliability Process major planned maintenance Adjustments Conditions . Planned Debottlenecking opportunities Maintenance have been identified from Sabine 4.6 Pass operating trains 4.5 Unplanned mtpa mtpa Maintenance 4.3 mtpa Note: Adjusted nominal capacity is an annualized range based on 20 years of operation and factoring in production, maintenance cycles, and unforeseen outages. 28
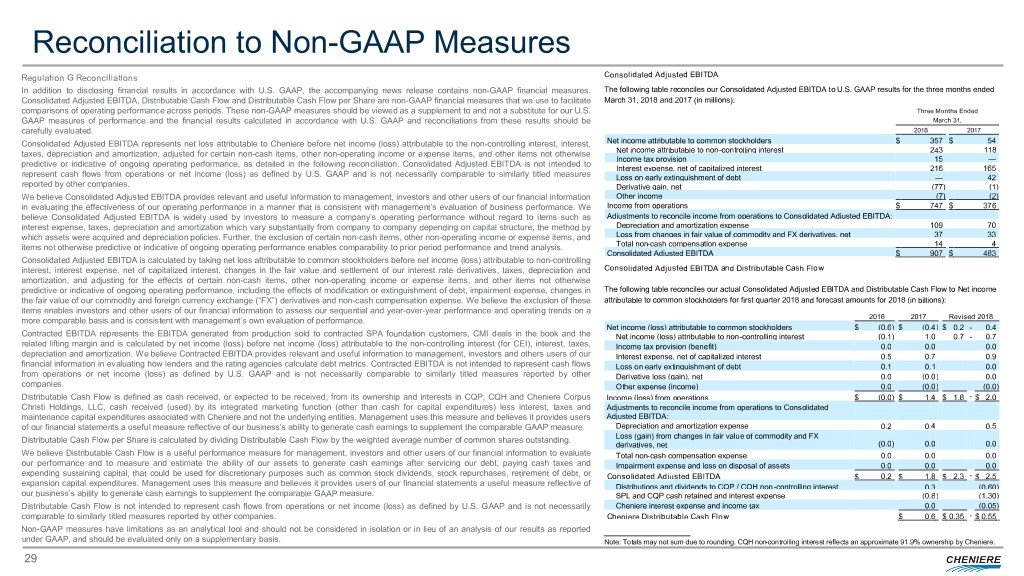
Reconciliation to Non-GAAP Measures Regulation G Reconciliations Consolidated Adjusted EBITDA In addition to disclosing financial results in accordance with U.S. GAAP, the accompanying news release contains non-GAAP financial measures. The following table reconciles our Consolidated Adjusted EBITDA to U.S. GAAP results for the three months ended Consolidated Adjusted EBITDA, Distributable Cash Flow and Distributable Cash Flow per Share are non-GAAP financial measures that we use to facilitate March 31, 2018 and 2017 (in millions): comparisons of operating performance across periods. These non-GAAP measures should be viewed as a supplement to and not a substitute for our U.S. Three Months Ended GAAP measures of performance and the financial results calculated in accordance with U.S. GAAP and reconciliations from these results should be March 31, carefully evaluated. 2018 2017 Consolidated Adjusted EBITDA represents net loss attributable to Cheniere before net income (loss) attributable to the non-controlling interest, interest, Net income attributable to common stockholders $ 357 $ 54 taxes, depreciation and amortization, adjusted for certain non-cash items, other non-operating income or expense items, and other items not otherwise Net income attributable to non-controlling interest 243 118 Income tax provision 15 — predictive or indicative of ongoing operating performance, as detailed in the following reconciliation. Consolidated Adjusted EBITDA is not intended to Interest expense, net of capitalized interest 216 165 represent cash flows from operations or net income (loss) as defined by U.S. GAAP and is not necessarily comparable to similarly titled measures Loss on early extinguishment of debt — 42 reported by other companies. Derivative gain, net (77) (1) We believe Consolidated Adjusted EBITDA provides relevant and useful information to management, investors and other users of our financial information Other income (7) (2) in evaluating the effectiveness of our operating performance in a manner that is consistent with management’s evaluation of business performance. We Income from operations $ 747 $ 376 believe Consolidated Adjusted EBITDA is widely used by investors to measure a company’s operating performance without regard to items such as Adjustments to reconcile income from operations to Consolidated Adjusted EBITDA: interest expense, taxes, depreciation and amortization which vary substantially from company to company depending on capital structure, the method by Depreciation and amortization expense 109 70 which assets were acquired and depreciation policies. Further, the exclusion of certain non-cash items, other non-operating income or expense items, and Loss from changes in fair value of commodity and FX derivatives, net 37 33 items not otherwise predictive or indicative of ongoing operating performance enables comparability to prior period performance and trend analysis. Total non-cash compensation expense 14 4 Consolidated Adjusted EBITDA $ 907 $ 483 Consolidated Adjusted EBITDA is calculated by taking net loss attributable to common stockholders before net income (loss) attributable to non-controlling interest, interest expense, net of capitalized interest, changes in the fair value and settlement of our interest rate derivatives, taxes, depreciation and Consolidated Adjusted EBITDA and Distributable Cash Flow amortization, and adjusting for the effects of certain non-cash items, other non-operating income or expense items, and other items not otherwise predictive or indicative of ongoing operating performance, including the effects of modification or extinguishment of debt, impairment expense, changes in The following table reconciles our actual Consolidated Adjusted EBITDA and Distributable Cash Flow to Net income the fair value of our commodity and foreign currency exchange (“FX”) derivatives and non-cash compensation expense. We believe the exclusion of these attributable to common stockholders for first quarter 2018 and forecast amounts for 2018 (in billions): items enables investors and other users of our financial information to assess our sequential and year-over-year performance and operating trends on a more comparable basis and is consistent with management’s own evaluation of performance. 2016 2017 Revised 2018 Net income (loss) attributable to common stockholders $ (0.6 ) $ (0.4 ) $ 0.2 - 0.4 Contracted EBITDA represents the EBITDA generated from production sold to contracted SPA foundation customers, CMI deals in the book and the Net income (loss) attributable to non-controlling interest (0.1 ) 1.0 0.7 - 0.7 related lifting margin and is calculated by net income (loss) before net income (loss) attributable to the non-controlling interest (for CEI), interest, taxes, Income tax provision (benefit) 0.0 0.0 0.0 depreciation and amortization. We believe Contracted EBITDA provides relevant and useful information to management, investors and others users of our Interest expense, net of capitalized interest 0.5 0.7 0.9 financial information in evaluating how lenders and the rating agencies calculate debt metrics. Contracted EBITDA is not intended to represent cash flows Loss on early extinguishment of debt 0.1 0.1 0.0 from operations or net income (loss) as defined by U.S. GAAP and is not necessarily comparable to similarly titled measures reported by other Derivative loss (gain), net 0.0 (0.0 ) 0.0 companies. Other expense (income) 0.0 (0.0 ) (0.0) Distributable Cash Flow is defined as cash received, or expected to be received, from its ownership and interests in CQP, CQH and Cheniere Corpus Income (loss) from operations $ (0.0 ) $ 1.4 $ 1.8 - $ 2.0 Christi Holdings, LLC, cash received (used) by its integrated marketing function (other than cash for capital expenditures) less interest, taxes and Adjustments to reconcile income from operations to Consolidated maintenance capital expenditures associated with Cheniere and not the underlying entities. Management uses this measure and believes it provides users Adjusted EBITDA: of our financial statements a useful measure reflective of our business’s ability to generate cash earnings to supplement the comparable GAAP measure. Depreciation and amortization expense 0.2 0.4 0.5 Distributable Cash Flow per Share is calculated by dividing Distributable Cash Flow by the weighted average number of common shares outstanding. Loss (gain) from changes in fair value of commodity and FX derivatives, net (0.0 ) 0.0 0.0 We believe Distributable Cash Flow is a useful performance measure for management, investors and other users of our financial information to evaluate Total non-cash compensation expense 0.0 0.0 0.0 our performance and to measure and estimate the ability of our assets to generate cash earnings after servicing our debt, paying cash taxes and Impairment expense and loss on disposal of assets 0.0 0.0 0.0 expending sustaining capital, that could be used for discretionary purposes such as common stock dividends, stock repurchases, retirement of debt, or Consolidated Adjusted EBITDA $ 0.2 $ 1.8 $ 2.3 - $ 2.5 expansion capital expenditures. Management uses this measure and believes it provides users of our financial statements a useful measure reflective of Distributions and dividends to CQP / CQH non-controlling interest 0.3 (0.60) our business’s ability to generate cash earnings to supplement the comparable GAAP measure. SPL and CQP cash retained and interest expense (0.8 ) (1.30) Distributable Cash Flow is not intended to represent cash flows from operations or net income (loss) as defined by U.S. GAAP and is not necessarily Cheniere interest expense and income tax 0.0 (0.05) comparable to similarly titled measures reported by other companies. Cheniere Distributable Cash Flow $ 0.6 $ 0.35 - $ 0.55 Non-GAAP measures have limitations as an analytical tool and should not be considered in isolation or in lieu of an analysis of our results as reported under GAAP, and should be evaluated only on a supplementary basis. Note: Totals may not sum due to rounding. CQH non-controlling interest reflects an approximate 91.9% ownership by Cheniere. 29
CHENIERE ENERGY, INC. INVESTOR RELATIONS CONTACTS Randy Bhatia Vice President, Investor Relations – (713) 375-5479, randy.bhatia@cheniere.com Megan Light Manager, Investor Relations – (713) 375-5492, megan.light@cheniere.com