UNITED STATES
SECURITIES AND EXCHANGE COMMISSION
Washington, D.C. 20549
FORM 10-Q
x QUARTERLY REPORT PURSUANT TO SECTION 13 OR 15(d) OF THE SECURITIES EXCHANGE ACT OF 1934
For the quarterly period ended March 31, 2017
OR
¨ TRANSITION REPORT PURSUANT TO SECTION 13 OR 15(d) OF THE SECURITIES EXCHANGE ACT OF 1934
For the transition period from to
CHENIERE ENERGY, INC.
(Exact name of registrant as specified in its charter)
|
| | |
Delaware | 001-16383 | 95-4352386 |
(State or other jurisdiction of incorporation or organization) | (Commission File Number) | (I.R.S. Employer Identification No.) |
| | |
700 Milam Street, Suite 1900 | | |
Houston, Texas | | 77002 |
(Address of principal executive offices) | | (Zip code) |
(713) 375-5000
(Registrant’s telephone number, including area code)
Indicate by check mark whether the registrant (1) has filed all reports required to be filed by Section 13 or 15(d) of the Securities Exchange Act of 1934 during the preceding 12 months (or for such shorter period that the registrant was required to file such reports), and (2) has been subject to such filing requirements for the past 90 days. Yes x No ¨
Indicate by check mark whether the registrant has submitted electronically and posted on its corporate Web site, if any, every Interactive Data File required to be submitted and posted pursuant to Rule 405 of Regulation S-T (§232.405 of this chapter) during the preceding 12 months (or for such shorter period that the registrant was required to submit and post such files). Yes x No ¨
Indicate by check mark whether the registrant is a large accelerated filer, an accelerated filer, a non-accelerated filer, a smaller reporting company, or an emerging growth company. See the definitions of “large accelerated filer,” “accelerated filer,” “smaller reporting company” and “emerging growth company” in Rule 12b-2 of the Exchange Act. (Check one):
|
| | | | | |
Large accelerated filer x | Accelerated filer ¨ |
Non-accelerated filer ¨ | (Do not check if a smaller reporting company) |
| | | Smaller reporting company ¨ |
| | | Emerging growth company ¨ |
If an emerging growth company, indicate by check mark if the registrant has elected not to use the extended transition period for complying with any new or revised financial accounting standards provided pursuant to Section 13(a) of the Exchange Act. ¨
Indicate by check mark whether the registrant is a shell company (as defined in Rule 12b-2 of the Exchange Act). Yes ¨ No x
As of April 28, 2017, the issuer had 237,881,592 shares of Common Stock outstanding.
CHENIERE ENERGY, INC.
TABLE OF CONTENTS
DEFINITIONS
As used in this quarterly report, the terms listed below have the following meanings:
Common Industry and Other Terms
|
| | |
Bcf | | billion cubic feet |
Bcf/d | | billion cubic feet per day |
Bcf/yr | | billion cubic feet per year |
Bcfe | | billion cubic feet equivalent |
DOE | | U.S. Department of Energy |
EPC | | engineering, procurement and construction |
FERC | | Federal Energy Regulatory Commission |
FTA countries | | countries with which the United States has a free trade agreement providing for national treatment for trade in natural gas |
GAAP | | generally accepted accounting principles in the United States |
Henry Hub | | the final settlement price (in USD per MMBtu) for the New York Mercantile Exchange’s Henry Hub natural gas futures contract for the month in which a relevant cargo’s delivery window is scheduled to begin |
LIBOR | | London Interbank Offered Rate |
LNG | | liquefied natural gas, a product of natural gas that, through a refrigeration process, has been cooled to a liquid state, which occupies a volume that is approximately 1/600th of its gaseous state |
MMBtu | | million British thermal units, an energy unit |
mtpa | | million tonnes per annum |
non-FTA countries | | countries with which the United States does not have a free trade agreement providing for national treatment for trade in natural gas and with which trade is permitted |
SEC | | Securities and Exchange Commission |
SPA | | LNG sale and purchase agreement |
Train | | an industrial facility comprised of a series of refrigerant compressor loops used to cool natural gas into LNG |
TUA | | terminal use agreement |
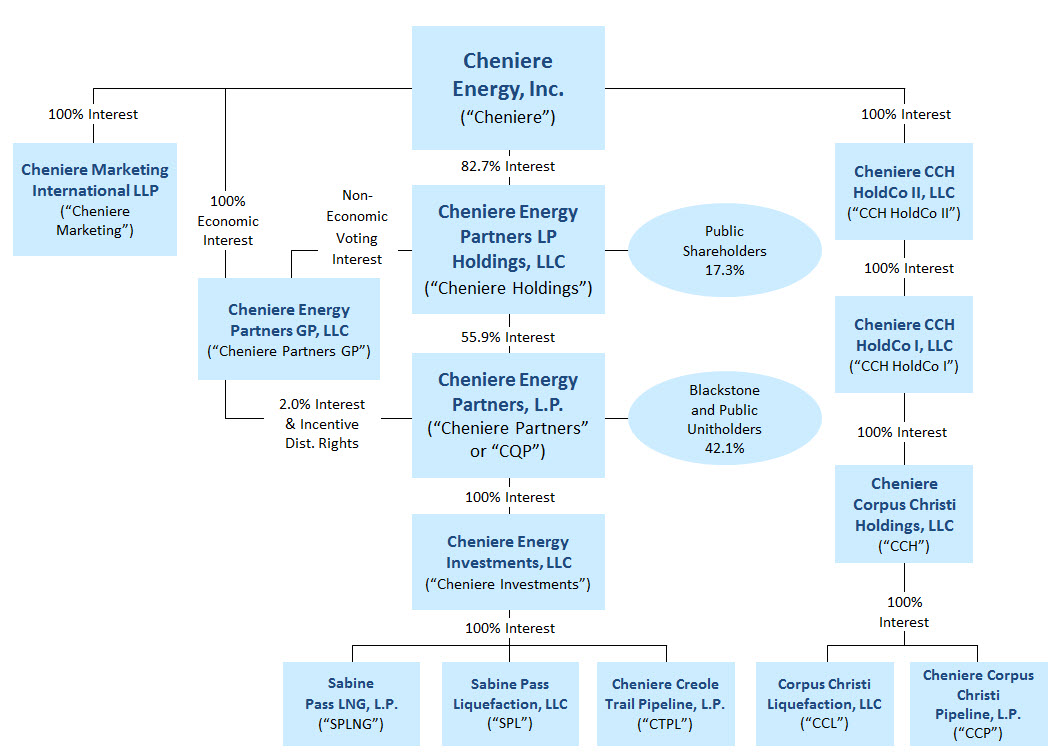
Abbreviated Organizational Structure
The following diagram depicts our abbreviated organizational structure as of March 31, 2017, including our ownership of certain subsidiaries, and the references to these entities used in this quarterly report:
Unless the context requires otherwise, references to “Cheniere,” the “Company,” “we,” “us” and “our” refer to Cheniere Energy, Inc. (NYSE MKT: LNG) and its consolidated subsidiaries, including our publicly traded subsidiaries, Cheniere Partners (NYSE MKT: CQP) and Cheniere Holdings (NYSE MKT: CQH).
Unless the context requires otherwise, references to the “CCH Group” refer to CCH HoldCo II, CCH HoldCo I, CCH, CCL and CCP, collectively. References to the “CCL Stage III entities” refer to Corpus Christi Liquefaction Stage III, LLC and Cheniere Corpus Christi Pipeline Stage III, LLC.
| |
PART I. | FINANCIAL INFORMATION |
| |
ITEM 1. | CONSOLIDATED FINANCIAL STATEMENTS |
CHENIERE ENERGY, INC. AND SUBSIDIARIES
CONSOLIDATED BALANCE SHEETS
(in millions, except share data)
|
| | | | | | | |
| March 31, | | December 31, |
| 2017 | | 2016 |
ASSETS | (unaudited) | | |
Current assets | | | |
Cash and cash equivalents | $ | 923 |
| | $ | 876 |
|
Restricted cash | 1,000 |
| | 860 |
|
Accounts and other receivables | 290 |
| | 218 |
|
Inventory | 113 |
| | 160 |
|
Derivative assets | 19 |
| | 24 |
|
Other current assets | 74 |
| | 100 |
|
Total current assets | 2,419 |
| | 2,238 |
|
| | | |
Non-current restricted cash | 1,018 |
| | 91 |
|
Property, plant and equipment, net | 22,016 |
| | 20,635 |
|
Debt issuance costs, net | 244 |
| | 277 |
|
Non-current derivative assets | 44 |
| | 83 |
|
Goodwill | 77 |
| | 77 |
|
Other non-current assets, net | 238 |
| | 302 |
|
Total assets | $ | 26,056 |
| | $ | 23,703 |
|
| | | |
LIABILITIES AND STOCKHOLDERS’ EQUITY | |
| | |
|
Current liabilities | |
| | |
|
Accounts payable | $ | 54 |
| | $ | 49 |
|
Accrued liabilities | 683 |
| | 637 |
|
Current debt, net | 24 |
| | 247 |
|
Deferred revenue | 63 |
| | 73 |
|
Derivative liabilities | 47 |
| | 71 |
|
Total current liabilities | 871 |
| | 1,077 |
|
| | | |
Long-term debt, net | 24,088 |
| | 21,688 |
|
Non-current deferred revenue | 5 |
| | 5 |
|
Non-current derivative liabilities | 38 |
| | 45 |
|
Other non-current liabilities | 59 |
| | 49 |
|
| | | |
Commitments and contingencies (see Note 15) |
|
| |
|
|
| | | |
Stockholders’ equity | |
| | |
|
Preferred stock, $0.0001 par value, 5.0 million shares authorized, none issued | — |
| | — |
|
Common stock, $0.003 par value | | | |
|
Authorized: 480.0 million shares at March 31, 2017 and December 31, 2016 | | | |
Issued: 250.1 million shares at March 31, 2017 and December 31, 2016 |
|
| |
|
|
Outstanding: 237.9 million shares and 238.0 million shares at March 31, 2017 and December 31, 2016, respectively | 1 |
| | 1 |
|
Treasury stock: 12.2 million shares at March 31, 2017 and December 31, 2016, at cost | (375 | ) | | (374 | ) |
Additional paid-in-capital | 3,218 |
| | 3,211 |
|
Accumulated deficit | (4,180 | ) | | (4,234 | ) |
Total stockholders’ deficit | (1,336 | ) | | (1,396 | ) |
Non-controlling interest | 2,331 |
| | 2,235 |
|
Total equity | 995 |
| | 839 |
|
Total liabilities and equity | $ | 26,056 |
| | $ | 23,703 |
|
CHENIERE ENERGY, INC. AND SUBSIDIARIES
CONSOLIDATED STATEMENTS OF OPERATIONS
(in millions, except per share data)
(unaudited)
|
| | | | | | | |
| Three Months Ended March 31, |
| 2017 | | 2016 |
Revenues | | | |
LNG revenues | $ | 1,143 |
| | $ | 3 |
|
Regasification revenues | 68 |
| | 65 |
|
Other revenues | — |
| | 1 |
|
Total revenues | 1,211 |
| | 69 |
|
| | | |
Operating costs and expenses | | | |
Cost of sales (excluding depreciation and amortization expense shown separately below) | 624 |
| | 15 |
|
Operating and maintenance expense | 78 |
| | 36 |
|
Development expense | 3 |
| | 2 |
|
Selling, general and administrative expense | 54 |
| | 66 |
|
Depreciation and amortization expense | 70 |
| | 24 |
|
Restructuring expense | 6 |
| | 7 |
|
Impairment expense | — |
| | 10 |
|
Total operating costs and expenses | 835 |
| | 160 |
|
| | | |
Income (loss) from operations | 376 |
| | (91 | ) |
| | | |
Other income (expense) | | | |
Interest expense, net of capitalized interest | (165 | ) | | (76 | ) |
Loss on early extinguishment of debt | (42 | ) | | (1 | ) |
Derivative gain (loss), net | 1 |
| | (181 | ) |
Other income | 2 |
| | 1 |
|
Total other expense | (204 | ) | | (257 | ) |
| | | |
Income (loss) before income taxes and non-controlling interest | 172 |
|
| (348 | ) |
Income tax provision | — |
|
| (1 | ) |
Net income (loss) | 172 |
|
| (349 | ) |
Less: net income (loss) attributable to non-controlling interest | 118 |
|
| (28 | ) |
Net income (loss) attributable to common stockholders | $ | 54 |
|
| $ | (321 | ) |
|
|
|
|
|
|
Net income (loss) per share attributable to common stockholders—basic and diluted | $ | 0.23 |
|
| $ | (1.41 | ) |
|
|
|
|
|
|
Weighted average number of common shares outstanding—basic | 232.4 |
|
| 228.1 |
|
Weighted average number of common shares outstanding—diluted | 232.7 |
| | 228.1 |
|
The accompanying notes are an integral part of these consolidated financial statements.
4
CHENIERE ENERGY, INC. AND SUBSIDIARIES
CONSOLIDATED STATEMENT OF STOCKHOLDERS’ EQUITY
(in millions)
(unaudited)
|
| | | | | | | | | | | | | | | | | | | | | | | | | | | | | |
| Total Stockholders’ Equity | | | |
| Common Stock | | Treasury Stock | | Additional Paid-in Capital | | Accumulated Deficit | | Non-controlling Interest | | Total Equity |
| Shares | | Par Value Amount | | Shares | | Amount | | | | |
Balance at December 31, 2016 | 238.0 |
| | $ | 1 |
| | 12.2 |
| | $ | (374 | ) | | $ | 3,211 |
| | $ | (4,234 | ) | | $ | 2,235 |
| | $ | 839 |
|
Issuance of stock to acquire additional interest in Cheniere Holdings | — |
| | — |
| | — |
| | — |
| | 2 |
| | — |
| | (2 | ) | | — |
|
Forfeitures of restricted stock | (0.1 | ) | | — |
| | — |
| | — |
| | — |
| | — |
| | — |
| | — |
|
Share-based compensation | — |
| | — |
| | — |
| | — |
| | 5 |
| | — |
| | — |
| | 5 |
|
Shares repurchased related to share-based compensation | — |
| | — |
| | — |
| | (1 | ) | | — |
| | — |
| | — |
| | (1 | ) |
Net income attributable to non-controlling interest | — |
| | — |
| | — |
| | — |
| | — |
| | — |
| | 118 |
| | 118 |
|
Distributions to non-controlling interest | — |
| | — |
| | — |
| | — |
| | — |
| | — |
| | (20 | ) | | (20 | ) |
Net income | — |
| | — |
| | — |
| | — |
| | — |
| | 54 |
| | — |
| | 54 |
|
Balance at March 31, 2017 | 237.9 |
| | $ | 1 |
| | 12.2 |
| | $ | (375 | ) | | $ | 3,218 |
| | $ | (4,180 | ) | | $ | 2,331 |
| | $ | 995 |
|
The accompanying notes are an integral part of these consolidated financial statements.
5
CHENIERE ENERGY, INC. AND SUBSIDIARIES
CONSOLIDATED STATEMENTS OF CASH FLOWS
(in millions)
(unaudited)
|
| | | | | | | |
| Three Months Ended March 31, |
| 2017 | | 2016 |
Cash flows from operating activities | | | |
Net income (loss) | $ | 172 |
| | $ | (349 | ) |
Adjustments to reconcile net income (loss) to net cash provided by (used in) operating activities: | | | |
Depreciation and amortization expense | 70 |
| | 24 |
|
Share-based compensation expense | 24 |
| | 16 |
|
Non-cash interest expense | 20 |
| | 17 |
|
Amortization of debt issuance costs, deferred commitment fees, premium and discount | 17 |
| | 13 |
|
Loss on early extinguishment of debt | 42 |
| | 1 |
|
Total losses on derivatives, net | 44 |
| | 182 |
|
Net cash used for settlement of derivative instruments | (29 | ) | | (9 | ) |
Impairment expense | — |
| | 10 |
|
Other | — |
| | 1 |
|
Changes in operating assets and liabilities: | | | |
Accounts and other receivables | (6 | ) | | 1 |
|
Inventory | 54 |
| | (2 | ) |
Accounts payable and accrued liabilities | (76 | ) | | (28 | ) |
Deferred revenue | (11 | ) | | (1 | ) |
Other, net | (12 | ) | | (7 | ) |
Net cash provided by (used in) operating activities | 309 |
| | (131 | ) |
| | | |
Cash flows from investing activities | | | |
Property, plant and equipment, net | (1,319 | ) | | (1,150 | ) |
Other | 29 |
| | (18 | ) |
Net cash used in investing activities | (1,290 | ) | | (1,168 | ) |
| | | |
Cash flows from financing activities | | | |
Proceeds from issuances of debt | 2,862 |
| | 1,908 |
|
Repayments of debt | (703 | ) | | (415 | ) |
Debt issuance and deferred financing costs | (43 | ) | | (49 | ) |
Distributions and dividends to non-controlling interest | (20 | ) | | (20 | ) |
Payments related to tax withholdings for share-based compensation | (1 | ) | | (1 | ) |
Net cash provided by financing activities | 2,095 |
| | 1,423 |
|
| | | |
Net increase in cash, cash equivalents and restricted cash | 1,114 |
| | 124 |
|
Cash, cash equivalents and restricted cash—beginning of period | 1,827 |
| | 1,736 |
|
Cash, cash equivalents and restricted cash—end of period | $ | 2,941 |
| | $ | 1,860 |
|
Balances per Consolidated Balance Sheets:
|
| | | | | | | |
| March 31, |
| 2017 | | 2016 |
Cash and cash equivalents | $ | 923 |
| | $ | 1,095 |
|
Restricted cash | 1,000 |
| | 733 |
|
Non-current restricted cash | 1,018 |
| | 32 |
|
Total cash, cash equivalents and restricted cash | $ | 2,941 |
| | $ | 1,860 |
|
The accompanying notes are an integral part of these consolidated financial statements.
6
CHENIERE ENERGY, INC. AND SUBSIDIARIES
NOTES TO CONSOLIDATED FINANCIAL STATEMENTS
(unaudited)
NOTE 1—NATURE OF OPERATIONS AND BASIS OF PRESENTATION
We are currently developing and constructing two natural gas liquefaction and export facilities. The Sabine Pass LNG terminal is located in Cameron Parish, Louisiana, on the Sabine-Neches Waterway less than four miles from the Gulf Coast. Cheniere Partners is developing, constructing and operating natural gas liquefaction facilities (the “SPL Project”) at the Sabine Pass LNG terminal adjacent to the existing regasification facilities through a wholly owned subsidiary, SPL. Cheniere Partners plans to construct up to six Trains, which are in various stages of development, construction and operations. Trains 1 through 3 have commenced commercial operations, Train 4 is undergoing commissioning, Train 5 is under construction and Train 6 is being commercialized and has all necessary regulatory approvals in place. The Sabine Pass LNG terminal has operational regasification facilities owned by Cheniere Partners’ wholly owned subsidiary, SPLNG, and a 94-mile pipeline that interconnects the Sabine Pass LNG terminal with a number of large interstate pipelines through a wholly owned subsidiary, CTPL.
In the second quarter of 2016, we started production at the SPL Project and began recognizing LNG revenues, which include fees that are received pursuant to our SPAs and our integrated LNG marketing activities. We also recognize regasification revenues, which include LNG regasification capacity reservation fees that are received pursuant to our TUAs and tug services fees that are received by Sabine Pass Tug Services, LLC, a wholly owned subsidiary of SPLNG.
We are developing and constructing a second natural gas liquefaction and export facility at the Corpus Christi LNG terminal, which is on nearly 2,000 acres of land that we own or control near Corpus Christi, Texas, and a pipeline facility (collectively, the “CCL Project”) through wholly owned subsidiaries CCL and CCP, respectively. The CCL Project is being developed in two stages for up to three Trains.
The CCL Stage III entities, our wholly owned subsidiaries, are also developing two additional Trains and one LNG storage tank at the Corpus Christi LNG terminal adjacent to the CCL Project, along with a second natural gas pipeline. We are also in various stages of developing other projects which, among other things, will require acceptable commercial and financing arrangements before we make a final investment decision (“FID”).
Basis of Presentation
The accompanying unaudited Consolidated Financial Statements of Cheniere have been prepared in accordance with GAAP for interim financial information and with Rule 10-01 of Regulation S-X. Accordingly, they do not include all of the information and footnotes required by GAAP for complete financial statements and should be read in conjunction with the Consolidated Financial Statements and accompanying notes included in our annual report on Form 10-K for the year ended December 31, 2016. In our opinion, all adjustments, consisting only of normal recurring adjustments necessary for a fair presentation, have been included. Certain reclassifications have been made to conform prior period information to the current presentation. The reclassifications had no effect on our overall consolidated financial position, results of operations or cash flows.
Results of operations for the three months ended March 31, 2017 are not necessarily indicative of the results of operations that will be realized for the year ending December 31, 2017.
CHENIERE ENERGY, INC. AND SUBSIDIARIES
NOTES TO CONSOLIDATED FINANCIAL STATEMENTS—CONTINUED
(unaudited)
NOTE 2—RESTRICTED CASH
Restricted cash consists of funds that are contractually restricted as to usage or withdrawal and have been presented separately from cash and cash equivalents on our Consolidated Balance Sheets. As of March 31, 2017 and December 31, 2016, restricted cash consisted of the following (in millions):
|
| | | | | | | | |
| | March 31, | | December 31, |
| | 2017 | | 2016 |
Current restricted cash | | | | |
SPL Project | | $ | 531 |
| | $ | 358 |
|
CQP and cash held by guarantor subsidiaries | | 225 |
| | 247 |
|
CCL Project | | 143 |
| | 197 |
|
Cash held by our subsidiaries restricted to Cheniere | | 101 |
| | 58 |
|
Total current restricted cash | | $ | 1,000 |
| | $ | 860 |
|
| | | | |
Non-current restricted cash | | | | |
SPL Project | | $ | 1,000 |
| | $ | — |
|
CCL Project | | — |
| | 73 |
|
Other | | 18 |
| | 18 |
|
Total non-current restricted cash | | $ | 1,018 |
| | $ | 91 |
|
NOTE 3—ACCOUNTS AND OTHER RECEIVABLES
As of March 31, 2017 and December 31, 2016, accounts and other receivables consisted of the following (in millions):
|
| | | | | | | | |
| | March 31, | | December 31, |
| | 2017 | | 2016 |
Trade receivables | | | | |
SPL | | $ | 92 |
| | $ | 88 |
|
Cheniere Marketing | | 185 |
| | 121 |
|
Other accounts receivable | | 13 |
| | 9 |
|
Total accounts and other receivables | | $ | 290 |
| | $ | 218 |
|
Pursuant to the accounts agreement entered into with the collateral trustee for the benefit of SPL’s debt holders, SPL is required to deposit all cash received into reserve accounts controlled by the collateral trustee. The usage or withdrawal of such cash is restricted to the payment of liabilities related to the SPL Project and other restricted payments.
NOTE 4—INVENTORY
As of March 31, 2017 and December 31, 2016, inventory consisted of the following (in millions):
|
| | | | | | | | |
| | March 31, | | December 31, |
| | 2017 | | 2016 |
Natural gas | | $ | 19 |
| | $ | 15 |
|
LNG | | 28 |
| | 50 |
|
LNG in-transit | | 20 |
| | 58 |
|
Materials and other | | 46 |
| | 37 |
|
Total inventory | | $ | 113 |
| | $ | 160 |
|
CHENIERE ENERGY, INC. AND SUBSIDIARIES
NOTES TO CONSOLIDATED FINANCIAL STATEMENTS—CONTINUED
(unaudited)
NOTE 5—PROPERTY, PLANT AND EQUIPMENT
Property, plant and equipment, net consists of LNG terminal costs and fixed assets and other, as follows (in millions):
|
| | | | | | | | |
| | March 31, | | December 31, |
| | 2017 | | 2016 |
LNG terminal costs | | | | |
LNG terminal | | $ | 10,414 |
| | $ | 7,978 |
|
LNG terminal construction-in-process | | 11,972 |
| | 12,995 |
|
LNG site and related costs | | 77 |
| | 41 |
|
Accumulated depreciation | | (618 | ) | | (555 | ) |
Total LNG terminal costs, net | | 21,845 |
| | 20,459 |
|
Fixed assets and other | | |
| | |
|
Computer and office equipment | | 13 |
| | 13 |
|
Furniture and fixtures | | 17 |
| | 17 |
|
Computer software | | 86 |
| | 85 |
|
Leasehold improvements | | 42 |
| | 43 |
|
Land | | 61 |
| | 61 |
|
Other | | 21 |
| | 22 |
|
Accumulated depreciation | | (69 | ) | | (65 | ) |
Total fixed assets and other, net | | 171 |
| | 176 |
|
Property, plant and equipment, net | | $ | 22,016 |
| | $ | 20,635 |
|
Depreciation expense during the three months ended March 31, 2017 and 2016 was $70 million and $24 million, respectively.
During the three months ended March 31, 2017 and 2016, we realized offsets to LNG terminal costs of $131 million and $14 million, respectively, that were related to the sale of commissioning cargoes because these amounts were earned prior to the start of commercial operations, during the testing phase for the construction of the SPL Project.
NOTE 6—DERIVATIVE INSTRUMENTS
We have entered into the following derivative instruments that are reported at fair value:
| |
• | interest rate swaps to hedge the exposure to volatility in a portion of the floating-rate interest payments under certain of our credit facilities (“Interest Rate Derivatives”); |
| |
• | commodity derivatives consisting of natural gas supply contracts for the commissioning and operation of the SPL Project (“Physical Liquefaction Supply Derivatives”) and associated economic hedges (collectively, the “Liquefaction Supply Derivatives”); |
| |
• | financial derivatives to hedge the exposure to the commodity markets in which we have contractual arrangements to purchase or sell physical LNG (“LNG Trading Derivatives”); and |
| |
• | foreign currency exchange (“FX”) contracts to hedge exposure to currency risk associated with operations in countries outside of the United States (“FX Derivatives”). |
None of our derivative instruments are designated as cash flow hedging instruments, and changes in fair value are recorded within our Consolidated Statements of Operations.
CHENIERE ENERGY, INC. AND SUBSIDIARIES
NOTES TO CONSOLIDATED FINANCIAL STATEMENTS—CONTINUED
(unaudited)
The following table (in millions) shows the fair value of our derivative instruments that are required to be measured at fair value on a recurring basis as of March 31, 2017 and December 31, 2016, which are classified as derivative assets, non-current derivative assets, derivative liabilities or non-current derivative liabilities in our Consolidated Balance Sheets.
|
| | | | | | | | | | | | | | | | | | | | | | | | | | | | | | | |
| Fair Value Measurements as of |
| March 31, 2017 | | December 31, 2016 |
| Quoted Prices in Active Markets
(Level 1) | | Significant Other Observable Inputs
(Level 2) | | Significant Unobservable Inputs
(Level 3) | | Total | | Quoted Prices in Active Markets
(Level 1) | | Significant Other Observable Inputs
(Level 2) | | Significant Unobservable Inputs
(Level 3) | | Total |
SPL Interest Rate Derivatives liability | $ | — |
| | $ | — |
| | $ | — |
| | $ | — |
| | $ | — |
| | $ | (6 | ) | | $ | — |
| | $ | (6 | ) |
CQP Interest Rate Derivatives asset | — |
| | 16 |
| | — |
| | 16 |
| | — |
| | 13 |
| | — |
| | 13 |
|
CCH Interest Rate Derivatives liability | — |
| | (75 | ) | | — |
| | (75 | ) | | — |
| | (86 | ) | | — |
| | (86 | ) |
Liquefaction Supply Derivatives asset (liability) | (2 | ) | | — |
| | 41 |
| | 39 |
| | (4 | ) | | (2 | ) | | 79 |
| | 73 |
|
LNG Trading Derivatives asset (liability) | — |
| | (3 | ) | | — |
| | (3 | ) | | 2 |
| | (5 | ) | | — |
| | (3 | ) |
FX Derivatives asset | — |
| | 1 |
| | — |
| | 1 |
| | — |
| | — |
| | — |
| | — |
|
There have been no changes to our evaluation of and accounting for our derivative positions designated as Level 1 during the three months ended March 31, 2017. See Note 7—Derivative Instruments of our Notes to Consolidated Financial Statements in our annual report on Form 10-K for the year ended December 31, 2016 for additional information.
We value our Interest Rate Derivatives using valuations based on the initial trade prices. Using an income-based approach, subsequent valuations are based on observable inputs to the valuation model including interest rate curves, risk adjusted discount rates, credit spreads and other relevant data. The estimated fair values of our economic hedges related to the LNG Trading Derivatives are the amounts at which the instruments could be exchanged currently between willing parties. We value these derivatives using observable commodity price curves and other relevant data. We estimate the fair values of our FX Derivatives with a market approach using observable FX rates and other relevant data.
The fair value of our Physical Liquefaction Supply Derivatives is predominantly driven by market commodity basis prices and our assessment of the associated conditions precedent, including evaluating whether the respective market is available as pipeline infrastructure is developed. Upon the completion and placement into service of relevant pipeline infrastructure to accommodate marketable physical gas flow, we recognize a gain or loss based on the fair value of the respective natural gas supply contracts as of the reporting date.
The fair value of substantially all of our Physical Liquefaction Supply Derivatives is developed through the use of internal models which are impacted by inputs that are unobservable in the marketplace. As a result, the fair value of our Physical Liquefaction Supply Derivatives is designated as Level 3 within the valuation hierarchy. The curves used to generate the fair value of our Physical Liquefaction Supply Derivatives are based on basis adjustments applied to forward curves for a liquid trading point. In addition, there may be observable liquid market basis information in the near term, but terms of a particular Physical Liquefaction Supply Derivatives contract may exceed the period for which such information is available, resulting in a Level 3 classification. In these instances, the fair value of the contract incorporates extrapolation assumptions made in the determination of the market basis price for future delivery periods in which applicable commodity basis prices were either not observable or lacked corroborative market data. Internal fair value models include conditions precedent to the respective long-term natural gas supply contracts. As of March 31, 2017 and December 31, 2016, some of our Physical Liquefaction Supply Derivatives existed within markets for which the pipeline infrastructure is under development to accommodate marketable physical gas flow.
CHENIERE ENERGY, INC. AND SUBSIDIARIES
NOTES TO CONSOLIDATED FINANCIAL STATEMENTS—CONTINUED
(unaudited)
The following table includes quantitative information for the unobservable inputs for our Level 3 Physical Liquefaction Supply Derivatives as of March 31, 2017:
|
| | | | | | | | |
| | Net Fair Value Asset (in millions) | | Valuation Technique | | Significant Unobservable Input | | Significant Unobservable Inputs Range |
Physical Liquefaction Supply Derivatives | | $41 | | Income Approach | | Basis Spread | | $(0.345) - $0.081 |
The following table (in millions) shows the changes in the fair value of our Level 3 Physical Liquefaction Supply Derivatives during the three months ended March 31, 2017 and 2016:
|
| | | | | | | | |
| | Three Months Ended March 31, |
| | 2017 | | 2016 |
Balance, beginning of period | | $ | 79 |
| | $ | 32 |
|
Realized and mark-to-market losses: | | | | |
Included in cost of sales (1) | | (41 | ) | | (2 | ) |
Purchases and settlements: | | | | |
Purchases | | 4 |
| | — |
|
Settlements (1) | | (1 | ) | | — |
|
Balance, end of period | | $ | 41 |
| | $ | 30 |
|
Change in unrealized gains relating to instruments still held at end of period | | $ | (41 | ) | | $ | (2 | ) |
| |
(1) | Does not include the decrease in fair value of $1 million related to the realized gains capitalized during the three months ended March 31, 2016. |
Derivative assets and liabilities arising from our derivative contracts with the same counterparty are reported on a net basis, as all counterparty derivative contracts provide for net settlement. The use of derivative instruments exposes us to counterparty credit risk, or the risk that a counterparty will be unable to meet its commitments in instances when our derivative instruments are in an asset position. Our derivative instruments are subject to contractual provisions which provide for the unconditional right of set-off for all derivative assets and liabilities with a given counterparty in the event of default.
Interest Rate Derivatives
SPL had entered into interest rate swaps (“SPL Interest Rate Derivatives”) to protect against volatility of future cash flows and hedge a portion of the variable interest payments on the credit facilities it entered into in June 2015 (the “2015 SPL Credit Facilities”). In March 2017, SPL settled the SPL Interest Rate Derivatives and recognized a derivative loss of $7 million in conjunction with the termination of approximately $1.6 billion of commitments under the 2015 SPL Credit Facilities, as discussed in Note 10—Debt.
During the three months ended March 31, 2017 there were no changes to the terms of the interest rate swaps (“CQP Interest Rate Derivatives”) entered into by CQP to hedge a portion of the variable interest payments on the credit facilities it entered into in February 2016 (the “2016 CQP Credit Facilities”) or the interest rate swaps (“CCH Interest Rate Derivatives”) entered into by CCH to hedge a portion of the variable interest payments on its credit facility (the “2015 CCH Credit Facility”). See Note 7—Derivative Instruments of our Notes to Consolidated Financial Statements in our annual report on Form 10-K for the year ended December 31, 2016 for additional information.
As of March 31, 2017, we had the following Interest Rate Derivatives outstanding:
|
| | | | | | | | | | | | |
| | Initial Notional Amount | | Maximum Notional Amount | | Effective Date | | Maturity Date | | Weighted Average Fixed Interest Rate Paid | | Variable Interest Rate Received |
CQP Interest Rate Derivatives | | $225 million | | $1.3 billion | | March 22, 2016 | | February 29, 2020 | | 1.19% | | One-month LIBOR |
CCH Interest Rate Derivatives | | $29 million | | $5.5 billion | | May 20, 2015 | | May 31, 2022 | | 2.29% | | One-month LIBOR |
CHENIERE ENERGY, INC. AND SUBSIDIARIES
NOTES TO CONSOLIDATED FINANCIAL STATEMENTS—CONTINUED
(unaudited)
The following table (in millions) shows the fair value and location of our Interest Rate Derivatives on our Consolidated Balance Sheets:
|
| | | | | | | | | | | | | | | | | | | | | | | | | | | | | | | | |
| | March 31, 2017 | | December 31, 2016 |
| | SPL Interest Rate Derivatives | | CQP Interest Rate Derivatives | | CCH Interest Rate Derivatives | | Total | | SPL Interest Rate Derivatives | | CQP Interest Rate Derivatives | | CCH Interest Rate Derivatives | | Total |
Balance Sheet Location | | | | | | | | | | | | | | | | |
Non-current derivative assets | | $ | — |
| | $ | 16 |
| | $ | — |
| | $ | 16 |
| | $ | — |
| | $ | 16 |
| | $ | — |
| | $ | 16 |
|
| | | | | | | | | | | | | | | | |
Derivative liabilities | | — |
| | — |
| | (38 | ) | | (38 | ) | | (4 | ) | | (3 | ) | | (43 | ) | | (50 | ) |
Non-current derivative liabilities | | — |
| | — |
| | (37 | ) | | (37 | ) | | (2 | ) | | — |
| | (43 | ) | | (45 | ) |
Total derivative liabilities | | — |
| | — |
| | (75 | ) | | (75 | ) | | (6 | ) | | (3 | ) | | (86 | ) | | (95 | ) |
| | | | | | | | | | | | | | | | |
Derivative asset (liability), net | | $ | — |
| | $ | 16 |
| | $ | (75 | ) | | $ | (59 | ) | | $ | (6 | ) | | $ | 13 |
| | $ | (86 | ) | | $ | (79 | ) |
The following table (in millions) shows the changes in the fair value and settlements of our Interest Rate Derivatives recorded in derivative gain (loss), net on our Consolidated Statements of Operations during the three months ended March 31, 2017 and 2016:
|
| | | | | | | | |
| | Three Months Ended March 31, |
| | 2017 | | 2016 |
SPL Interest Rate Derivatives loss | | $ | (2 | ) | | $ | (11 | ) |
CQP Interest Rate Derivatives gain (loss) | | 2 |
| | (10 | ) |
CCH Interest Rate Derivatives gain (loss) | | 1 |
| | (160 | ) |
Commodity Derivatives
The following table (in millions) shows the fair value and location of our Liquefaction Supply Derivatives and LNG Trading Derivatives (collectively, “Commodity Derivatives”) on our Consolidated Balance Sheets:
|
| | | | | | | | | | | | | | | | | | | | | | | |
| March 31, 2017 | | December 31, 2016 |
| Liquefaction Supply Derivatives (1) | | LNG Trading Derivatives (2) | | Total | | Liquefaction Supply Derivatives (1) | | LNG Trading Derivatives (2) | | Total |
Balance Sheet Location | | | | | | | | | | | |
Derivative assets | $ | 16 |
| | $ | 2 |
| | $ | 18 |
| | $ | 13 |
| | $ | 7 |
| | $ | 20 |
|
Non-current derivative assets | 28 |
| | — |
| | 28 |
| | 67 |
| | — |
| | 67 |
|
Total derivative assets | 44 |
| | 2 |
| | 46 |
| | 80 |
| | 7 |
| | 87 |
|
| | | | | | | | | | | |
Derivative liabilities | (4 | ) | | (5 | ) | | (9 | ) | | (7 | ) | | (10 | ) | | (17 | ) |
Non-current derivative liabilities | (1 | ) | | — |
| | (1 | ) | | — |
| | — |
| | — |
|
Total derivative liabilities | (5 | ) | | (5 | ) | | (10 | ) | | (7 | ) | | (10 | ) | | (17 | ) |
| | | | | | | | | | | |
Derivative asset (liability), net | $ | 39 |
| | $ | (3 | ) | | $ | 36 |
| | $ | 73 |
| | $ | (3 | ) | | $ | 70 |
|
| | | | | | | | | | | |
Notional amount (in million MMBtu) (3) | 1,214 |
| | 6 |
| | | | 1,117 |
| | — |
| | |
| |
(1) | Does not include collateral of $5 million and $6 million deposited for such contracts, which is included in other current assets in our Consolidated Balance Sheets as of March 31, 2017 and December 31, 2016, respectively. |
| |
(2) | Does not include collateral of $11 million and $10 million deposited for such contracts, which are included in other current assets in our Consolidated Balance Sheets as of March 31, 2017 and December 31, 2016, respectively. |
CHENIERE ENERGY, INC. AND SUBSIDIARIES
NOTES TO CONSOLIDATED FINANCIAL STATEMENTS—CONTINUED
(unaudited)
| |
(3) | SPL had secured up to approximately 2,051 million MMBtu and 1,994 million MMBtu of natural gas feedstock through natural gas supply contracts as of March 31, 2017 and December 31, 2016, respectively. |
The following table (in millions) shows the changes in the fair value, settlements and location of our Commodity Derivatives recorded on our Consolidated Statements of Operations during the three months ended March 31, 2017 and 2016:
|
| | | | | | | | | |
| | | Three Months Ended March 31, |
| Statement of Operations Location (1) | | 2017 | | 2016 |
LNG Trading Derivatives gain (loss) | LNG revenues | | $ | (6 | ) | | $ | 5 |
|
Liquefaction Supply Derivatives loss (2) | Cost of sales | | 39 |
| | 4 |
|
| |
(1) | Fair value fluctuations associated with commodity derivative activities are classified and presented consistently with the item economically hedged and the nature and intent of the derivative instrument. |
(2) Does not include the realized value associated with derivative instruments that settle through physical delivery.
FX Derivatives
The following table (in millions) shows the fair value and location of our FX Derivatives on our Consolidated Balance Sheets:
|
| | | | | | | | | | |
| | | | Fair Value Measurements as of |
| Balance Sheet Location | | March 31, 2017 | | December 31, 2016 |
FX Derivatives | Derivative assets | | $ | 1 |
| | $ | 4 |
|
FX Derivatives | Derivative liabilities | | — |
| | (4 | ) |
The total notional amount of our FX Derivatives was $3 million and $11 million as of March 31, 2017 and December 31, 2016, respectively.
The following table (in millions) shows the changes in the fair value of our FX Derivatives recorded on our Consolidated Statements of Operations during the three months ended March 31, 2017 and 2016:
|
| | | | | | | | | | |
| | | | Three Months Ended March 31, |
| | Statement of Operations Location | | 2017 | | 2016 |
FX Derivatives loss | | LNG revenues | | $ | — |
| | $ | (2 | ) |
CHENIERE ENERGY, INC. AND SUBSIDIARIES
NOTES TO CONSOLIDATED FINANCIAL STATEMENTS—CONTINUED
(unaudited)
Balance Sheet Presentation
Our derivative instruments are presented on a net basis on our Consolidated Balance Sheets as described above. The following table (in millions) shows the fair value of our derivatives outstanding on a gross and net basis:
|
| | | | | | | | | | | | |
| | Gross Amounts Recognized | | Gross Amounts Offset in the Consolidated Balance Sheets | | Net Amounts Presented in the Consolidated Balance Sheets |
Offsetting Derivative Assets (Liabilities) | | | |
As of March 31, 2017 | | | | | | |
CQP Interest Rate Derivatives | | $ | 17 |
| | $ | (1 | ) | | $ | 16 |
|
CCH Interest Rate Derivatives | | (82 | ) | | 7 |
| | (75 | ) |
Liquefaction Supply Derivatives | | 48 |
| | (4 | ) | | 44 |
|
Liquefaction Supply Derivatives | | 2 |
| | (7 | ) | | (5 | ) |
LNG Trading Derivatives | | 7 |
| | (5 | ) | | 2 |
|
LNG Trading Derivatives | | 4 |
| | (9 | ) | | (5 | ) |
FX Derivatives | | 1 |
| | — |
| | 1 |
|
As of December 31, 2016 | | | | | |
|
|
SPL Interest Rate Derivatives | | $ | (6 | ) | | $ | — |
| | $ | (6 | ) |
CQP Interest Rate Derivatives | | 16 |
| | — |
| | 16 |
|
CQP Interest Rate Derivatives | | (3 | ) | | — |
| | (3 | ) |
CCH Interest Rate Derivatives | | (95 | ) | | 9 |
| | (86 | ) |
Liquefaction Supply Derivatives | | 82 |
| | (2 | ) | | 80 |
|
Liquefaction Supply Derivatives | | (11 | ) | | 4 |
| | (7 | ) |
LNG Trading Derivatives | | 21 |
| | (15 | ) | | 6 |
|
LNG Trading Derivatives | | (17 | ) | | 8 |
| | (9 | ) |
FX Derivatives | | 5 |
| | (1 | ) | | 4 |
|
FX Derivatives | | (4 | ) | | — |
| | (4 | ) |
NOTE 7—OTHER NON-CURRENT ASSETS
As of March 31, 2017 and December 31, 2016, other non-current assets consisted of the following (in millions):
|
| | | | | | | | |
| | March 31, | | December 31, |
| | 2017 | | 2016 |
Advances made under EPC and non-EPC contracts | | $ | 20 |
| | $ | 69 |
|
Advances made to municipalities for water system enhancements | | 99 |
| | 99 |
|
Advances and other asset conveyances to third parties to support LNG terminals | | 46 |
| | 53 |
|
Tax-related payments and receivables | | 28 |
| | 31 |
|
Equity method investments | | 10 |
| | 10 |
|
Cost method investments | | 5 |
| | 5 |
|
Other | | 30 |
| | 35 |
|
Total other non-current assets, net | | $ | 238 |
| | $ | 302 |
|
Our cost method investments consist of interests in privately-held companies without a readily determinable fair value. The Company’s cost method investments are assessed for impairment quarterly. We determined that it is not practicable to estimate the fair value of these investments on a regular basis and do not reassess the fair value of cost method investments if there are no identified events or changes in circumstances that may have a significant adverse effect on the fair value of the investment. We did not identify events or changes in circumstances that may have a significant adverse effect on the fair value of these investments during the three months ended March 31, 2017.
CHENIERE ENERGY, INC. AND SUBSIDIARIES
NOTES TO CONSOLIDATED FINANCIAL STATEMENTS—CONTINUED
(unaudited)
NOTE 8—NON-CONTROLLING INTEREST
As of March 31, 2017 and December 31, 2016, we owned 82.7% and 82.6%, respectively, of Cheniere Holdings as well as the director voting share, with the remaining non-controlling interest held by the public. Cheniere Holdings owns a 55.9% limited partner interest in Cheniere Partners in the form of 12.0 million common units, 45.3 million Class B units and 135.4 million subordinated units, with the remaining non-controlling interest held by Blackstone CQP Holdco LP and the public. We also own 100% of the general partner interest and the incentive distribution rights in Cheniere Partners. Both Cheniere Holdings and Cheniere Partners are accounted for as variable interest entities. For further information regarding variable interest entities, refer to our Notes to Consolidated Financial Statements in our annual report on Form 10-K for the year ended December 31, 2016.
NOTE 9—ACCRUED LIABILITIES
As of March 31, 2017 and December 31, 2016, accrued liabilities consisted of the following (in millions):
|
| | | | | | | | |
| | March 31, | | December 31, |
| | 2017 | | 2016 |
Interest costs and related debt fees | | $ | 198 |
| | $ | 273 |
|
Compensation and benefits | | 52 |
| | 56 |
|
LNG terminals and related pipeline costs | | 408 |
| | 284 |
|
Other accrued liabilities | | 25 |
| | 24 |
|
Total accrued liabilities | | $ | 683 |
| | $ | 637 |
|
CHENIERE ENERGY, INC. AND SUBSIDIARIES
NOTES TO CONSOLIDATED FINANCIAL STATEMENTS—CONTINUED
(unaudited)
NOTE 10—DEBT
As of March 31, 2017 and December 31, 2016, our debt consisted of the following (in millions):
|
| | | | | | | | |
| | March 31, | | December 31, |
| | 2017 | | 2016 |
Long-term debt: | | | | |
SPL | | | |
|
|
5.625% Senior Secured Notes due 2021 (“2021 SPL Senior Notes”), net of unamortized premium of $7 and $7 | | $ | 2,007 |
| | $ | 2,007 |
|
6.25% Senior Secured Notes due 2022 (“2022 SPL Senior Notes”) | | 1,000 |
| | 1,000 |
|
5.625% Senior Secured Notes due 2023 (“2023 SPL Senior Notes”), net of unamortized premium of $5 and $6 | | 1,505 |
| | 1,506 |
|
5.75% Senior Secured Notes due 2024 (“2024 SPL Senior Notes”) | | 2,000 |
| | 2,000 |
|
5.625% Senior Secured Notes due 2025 (“2025 SPL Senior Notes”) | | 2,000 |
| | 2,000 |
|
5.875% Senior Secured Notes due 2026 (“2026 SPL Senior Notes”) | | 1,500 |
| | 1,500 |
|
5.00% Senior Secured Notes due 2027 (“2027 SPL Senior Notes”) | | 1,500 |
| | 1,500 |
|
4.200% Senior Secured Notes due 2028 (“2028 SPL Senior Notes”), net of unamortized discount of $1 and zero | | 1,349 |
| | — |
|
5.00% Senior Secured Notes due 2037 (“2037 SPL Senior Notes”) | | 800 |
| | — |
|
2015 SPL Credit Facilities | | — |
| | 314 |
|
Cheniere Partners | | | | |
2016 CQP Credit Facilities | | 2,560 |
| | 2,560 |
|
CCH | | | | |
7.000% Senior Secured Notes due 2024 (“2024 CCH Senior Notes”) | | 1,250 |
| | 1,250 |
|
5.875% Senior Secured Notes due 2025 (“2025 CCH Senior Notes”) | | 1,500 |
| | 1,500 |
|
2015 CCH Credit Facility | | 2,929 |
| | 2,381 |
|
CCH HoldCo II | | | | |
11.0% Convertible Senior Notes due 2025 (“2025 CCH HoldCo II Convertible Senior Notes”) | | 1,203 |
| | 1,171 |
|
Cheniere | | | | |
4.875% Convertible Unsecured Notes due 2021 (“2021 Cheniere Convertible Unsecured Notes”), net of unamortized discount of $140 and $146 | | 966 |
| | 960 |
|
4.25% Convertible Senior Notes due 2045 (“2045 Cheniere Convertible Senior Notes”), net of unamortized discount of $316 and $317 | | 309 |
| | 308 |
|
$750 million Cheniere Revolving Credit Facility (“Cheniere Revolving Credit Facility”) | | — |
| | — |
|
Unamortized debt issuance costs | | (290 | ) | | (269 | ) |
Total long-term debt, net | | 24,088 |
| | 21,688 |
|
| | | | |
Current debt: | | | | |
$1.2 billion SPL Working Capital Facility (“SPL Working Capital Facility”) | | — |
| | 224 |
|
$350 million CCH Working Capital Facility (“CCH Working Capital Facility”) | | — |
| | — |
|
Cheniere Marketing trade finance facilities | | 24 |
| | 23 |
|
Total current debt, net | | 24 |
| | 247 |
|
| | | | |
Total debt, net | | $ | 24,112 |
| | $ | 21,935 |
|
2017 Debt Issuances and Redemptions
Senior Notes
In February 2017, SPL issued an aggregate principal amount of $800 million of the 2037 SPL Senior Notes on a private placement basis in reliance on the exemption from registration provided for under Section 4(a)(2) of the Securities Act of 1933, as amended. In March 2017, SPL issued an aggregate principal amount of $1.35 billion, before discount, of the 2028 SPL Senior Notes. Net proceeds of the offerings of the 2037 SPL Senior Notes and the 2028 SPL Senior Notes were $789 million and $1.33 billion, respectively, after deducting the initial purchasers’ commissions (for the 2028 SPL Senior Notes) and estimated fees and
CHENIERE ENERGY, INC. AND SUBSIDIARIES
NOTES TO CONSOLIDATED FINANCIAL STATEMENTS—CONTINUED
(unaudited)
expenses. The net proceeds of the 2037 SPL Senior Notes were used to repay the then outstanding borrowings of $369 million under the 2015 SPL Credit Facilities and, along with the net proceeds of the 2028 SPL Senior Notes, the remainder is being used to pay a portion of the capital costs in connection with the construction of Trains 1 through 5 of the SPL Project in lieu of the terminated portion of the commitments under the 2015 SPL Credit Facilities.
In connection with the issuance of the 2037 SPL Senior Notes and the 2028 SPL Senior Notes, SPL terminated the remaining available balance of $1.6 billion under the 2015 SPL Credit Facilities, resulting in a write-off of debt issuance costs associated with the 2015 SPL Credit Facilities of $42 million during the three months ended March 31, 2017.
The 2037 SPL Senior Notes and the 2028 SPL Senior Notes accrue interest at fixed rates of 5.00% and 4.200%, respectively, and interest is payable semi-annually in arrears. The terms of the 2037 SPL Senior Notes are governed by an indenture which contains customary terms and events of default and certain covenants that, among other things, limit SPL’s ability and the ability of SPL’s restricted subsidiaries to incur additional indebtedness or issue preferred stock, make certain investments or pay dividends or distributions on capital stock or subordinated indebtedness or purchase, redeem or retire capital stock, sell or transfer assets, including capital stock of SPL’s restricted subsidiaries, restrict dividends or other payments by restricted subsidiaries, incur liens, enter into transactions with affiliates, dissolve, liquidate, consolidate, merge, sell or lease all or substantially all of SPL’s assets and enter into certain LNG sales contracts. The 2028 SPL Senior Notes are governed by the same common indenture as the other senior notes, which also contains customary terms and events of default, covenants and redemption terms.
At any time prior to six months before the respective dates of maturity of the 2037 SPL Senior Notes and the 2028 SPL Senior Notes, SPL may redeem all or part of such notes at a redemption price equal to the “optional redemption” price for the 2037 SPL Senior Notes or the “make-whole” price for the 2028 SPL Senior Notes, as set forth in the respective indentures governing the notes, plus accrued and unpaid interest, if any, to the date of redemption. SPL may also, at any time within six months of the respective maturity dates for the 2037 SPL Senior Notes and the 2028 SPL Senior Notes, redeem all or part of such notes at a redemption price equal to 100% of the principal amount of such notes to be redeemed, plus accrued and unpaid interest, if any, to the date of redemption.
In connection with the issuance of the 2028 SPL Senior Notes, SPL entered into a registration rights agreement (the “SPL Registration Rights Agreement”). Under the terms of the SPL Registration Rights Agreement, SPL has agreed, and any future guarantors will agree, to use commercially reasonable efforts to file with the SEC and cause to become effective a registration statement relating to an offer to exchange any and all of the 2028 SPL Senior Notes for a like aggregate principal amount of debt securities of SPL with terms identical in all material respects to the 2028 SPL Senior Notes sought to be exchanged (other than with respect to restrictions on transfer or to any increase in annual interest rate), within 360 days after March 6, 2017. Under specified circumstances, SPL has also agreed, and any future guarantors will also agree, to use commercially reasonable efforts to cause to become effective a shelf registration statement relating to resales of the 2028 SPL Senior Notes. SPL will be obligated to pay additional interest on the 2028 SPL Senior Notes if it fails to comply with its obligation to register them within the specified time period.
Cheniere Revolving Credit Facility
In March 2017, we entered into the Cheniere Revolving Credit Facility that may be used to fund, through loans and letters of credit, equity capital contributions to CCH HoldCo II and its subsidiaries for the development of the CCL Project and, provided that certain conditions are met, for general corporate purposes. No advances or letters of credit under the Cheniere Revolving Credit Facility are available until either (1) Cheniere’s unrestricted cash and cash equivalents are less than $500 million or (2) Train 4 of the SPL Project has achieved substantial completion. We incurred $16 million of debt issuance costs related to the Cheniere Revolving Credit Facility during the three months ended March 31, 2017.
Loans under the Cheniere Revolving Credit Facility accrue interest at a variable rate per annum equal to LIBOR or the base rate (equal to the highest of (1) the prime rate, (2) the federal funds rate plus 0.50% and (3) one month LIBOR plus 1.00%), plus the applicable margin. The applicable margin for LIBOR loans is 3.25% per annum, and the applicable margin for base rate loans is 2.25% per annum. Interest on LIBOR loans is due and payable at the end of each LIBOR period, and interest on base rate loans is due and payable at the end of each calendar quarter. We will also pay (1) a commitment fee on the average daily amount of undrawn commitments at an annual rate of 0.75%, payable quarterly in arrears, and (2) a letter of credit fee at an annual rate equal to the applicable margin for LIBOR loans on the undrawn portion of all letters of credit issued under the Cheniere Revolving Credit Facility. Draws on any letters of credit will accrue interest at an annual rate equal to the base rate plus 2.0%.
CHENIERE ENERGY, INC. AND SUBSIDIARIES
NOTES TO CONSOLIDATED FINANCIAL STATEMENTS—CONTINUED
(unaudited)
The Cheniere Revolving Credit Facility matures on March 2, 2021 and contains representations, warranties and affirmative and negative covenants customary for companies like Cheniere with lenders of the type participating in the Cheniere Revolving Credit Facility that limit our ability to make restricted payments, including distributions, unless certain conditions are satisfied, as well as limitations on indebtedness, guarantees, hedging, liens, investments and affiliate transactions. Under the terms of the Cheniere Revolving Credit Facility, we are required to ensure that the sum of our unrestricted cash and the amount of undrawn commitments under the Cheniere Revolving Credit Facility is at least equal to the lesser of (1) 20% of the commitments under the Cheniere Revolving Credit Facility and (2) $100 million.
The Cheniere Revolving Credit Facility is secured by a first priority security interest (subject to permitted liens and other customary exceptions) in substantially all of our assets, including our interests in our direct subsidiaries (excluding CCH HoldCo II).
Credit Facilities
Below is a summary (in millions) of our credit facilities outstanding as of March 31, 2017:
|
| | | | | | | | | | | | | | | | | | | | |
| | SPL Working Capital Facility | | 2016 CQP Credit Facilities | | 2015 CCH Credit Facility | | CCH Working Capital Facility | | Cheniere Revolving Credit Facility |
Original facility size | | $ | 1,200 |
| | $ | 2,800 |
| | $ | 8,404 |
| | $ | 350 |
| | $ | 750 |
|
Outstanding balance | | — |
| | 2,560 |
| | 2,929 |
| | — |
| | — |
|
Commitments prepaid or terminated | | — |
| | — |
| | 2,420 |
| | — |
| | — |
|
Letters of credit issued | | 377 |
| | 50 |
| | — |
| | 82 |
| | — |
|
Available commitment |
| $ | 823 |
|
| $ | 190 |
|
| $ | 3,055 |
|
| $ | 268 |
|
| $ | 750 |
|
| | | | | | | | | | |
Interest rate | | LIBOR plus 1.75% or base rate plus 0.75% | | LIBOR plus 2.25% or base rate plus 1.25% (1) | | LIBOR plus 2.25% or base rate plus 1.25% (2) | | LIBOR plus 1.50% - 2.00% or base rate plus 0.50% - 1.00% | | LIBOR plus 3.25% or base rate plus 2.25% |
Maturity date | | December 31, 2020, with various terms for underlying loans | | February 25, 2020, with principals due quarterly commencing on February 19, 2019 | | Earlier of May 13, 2022 or second anniversary of CCL Trains 1 and 2 completion date | | December 14, 2021, with various terms for underlying loans | | March 2, 2021 |
| |
(1) | There is a 0.50% step-up for both LIBOR and base rate loans beginning on February 25, 2019. |
| |
(2) | There is a 0.25% step-up for both LIBOR and base rate loans following completion of the first two Trains of the CCL Project. |
CHENIERE ENERGY, INC. AND SUBSIDIARIES
NOTES TO CONSOLIDATED FINANCIAL STATEMENTS—CONTINUED
(unaudited)
Convertible Notes
Below is a summary (in millions) of our convertible notes outstanding as of March 31, 2017:
|
| | | | | | | | | | | | |
| | 2021 Cheniere Convertible Unsecured Notes | | 2025 CCH HoldCo II Convertible Senior Notes | | 2045 Cheniere Convertible Senior Notes |
Aggregate original principal | | $ | 1,000 |
| | $ | 1,000 |
| | $ | 625 |
|
Debt component, net of discount | | $ | 966 |
| | $ | 1,203 |
| | $ | 309 |
|
Equity component | | $ | 205 |
| | $ | — |
| | $ | 194 |
|
Interest payment method | | Paid-in-kind |
| | Paid-in-kind (1) |
| | Cash |
|
Conversion by us (2) | | — |
| | (3) |
| | (4) |
|
Conversion by holders (2) | | (5) |
| | (6) |
| | (7) |
|
Conversion basis | | Cash and/or stock |
| | Stock |
| | Cash and/or stock |
|
Conversion value in excess of principal | | $ | — |
| | $ | — |
| | $ | — |
|
Maturity date | | May 28, 2021 |
| | March 1, 2025 |
| | March 15, 2045 |
|
Contractual interest rate | | 4.875 | % | | 11.0 | % | | 4.25 | % |
Effective interest rate | | 8.3 | % | | 11.9 | % | | 9.4 | % |
Remaining debt discount and debt issuance costs amortization period (8) | | 4.2 years |
| | 3.5 years |
| | 28.0 years |
|
| |
(1) | Prior to the substantial completion of Train 2 of the CCL Project, interest will be paid entirely in kind. Following this date, the interest generally must be paid in cash; however, a portion of the interest may be paid in kind under certain specified circumstances. |
| |
(2) | Conversion is subject to various limitations and conditions. |
| |
(3) | Convertible on or after the later of March 1, 2020 and the substantial completion of Train 2 of the CCL Project, provided that our market capitalization is not less than $10.0 billion (“Eligible Conversion Date”). The conversion price is the lower of (1) a 10% discount to the average of the daily volume-weighted average price (“VWAP”) of our common stock for the 90 trading day period prior to the date notice is provided, and (2) a 10% discount to the closing price of our common stock on the trading day preceding the date notice is provided. |
| |
(4) | Redeemable at any time after March 15, 2020 at a redemption price payable in cash equal to the accreted amount of the 2045 Cheniere Convertible Senior Notes to be redeemed, plus accrued and unpaid interest, if any, to such redemption date. |
| |
(5) | Initially convertible at $93.64 (subject to adjustment upon the occurrence of certain specified events), provided that the closing price of our common stock is greater than or equal to the conversion price on the conversion date. |
| |
(6) | Convertible on or after the six-month anniversary of the Eligible Conversion Date, provided that our total market capitalization is not less than $10.0 billion, at a price equal to the average of the daily VWAP of our common stock for the 90 trading day period prior to the date on which notice of conversion is provided. |
| |
(7) | Prior to December 15, 2044, convertible only under certain circumstances as specified in the indenture; thereafter, holders may convert their notes regardless of these circumstances. The conversion rate will initially equal 7.2265 shares of our common stock per $1,000 principal amount of the 2045 Cheniere Convertible Senior Notes, which corresponds to an initial conversion price of approximately $138.38 per share of our common stock (subject to adjustment upon the occurrence of certain specified events). |
| |
(8) | We amortize any debt discount and debt issuance costs using the effective interest over the period through contractual maturity except for the 2025 CCH HoldCo II Convertible Senior Notes, which are amortized through the date they are first convertible by holders into our common stock. |
CHENIERE ENERGY, INC. AND SUBSIDIARIES
NOTES TO CONSOLIDATED FINANCIAL STATEMENTS—CONTINUED
(unaudited)
Interest Expense
Total interest expense, including interest expense related to our convertible notes, consisted of the following (in millions):
|
| | | | | | | |
| Three Months Ended March 31, |
| 2017 | | 2016 |
Interest cost on convertible notes: | | | |
Interest per contractual rate | $ | 53 |
| | $ | 49 |
|
Amortization of debt discount | 7 |
| | 9 |
|
Amortization of debt issuance costs | 2 |
| | 1 |
|
Total interest cost related to convertible notes | 62 |
| | 59 |
|
Interest cost on debt excluding convertible notes | 292 |
|
| 234 |
|
Total interest cost | 354 |
| | 293 |
|
Capitalized interest | (189 | ) | | (217 | ) |
Total interest expense, net | $ | 165 |
| | $ | 76 |
|
Fair Value Disclosures
The following table (in millions) shows the carrying amount and estimated fair value of our debt:
|
| | | | | | | | | | | | | | | | |
| | March 31, 2017 | | December 31, 2016 |
| | Carrying
Amount | | Estimated
Fair Value | | Carrying
Amount | | Estimated
Fair Value |
Senior notes, net of premium or discount (1) | | $ | 15,611 |
| | $ | 16,738 |
| | $ | 14,263 |
| | $ | 15,210 |
|
2037 SPL Senior Notes (2) | | 800 |
| | 826 |
| | — |
| | — |
|
Credit facilities (3) | | 5,513 |
| | 5,513 |
| | 5,502 |
| | 5,502 |
|
2021 Cheniere Convertible Unsecured Notes, net of discount (2) | | 966 |
| | 1,025 |
| | 960 |
| | 983 |
|
2025 CCH HoldCo II Convertible Senior Notes (2) | | 1,203 |
| | 1,398 |
| | 1,171 |
| | 1,328 |
|
2045 Cheniere Convertible Senior Notes, net of discount (4) | | 309 |
| | 422 |
| | 308 |
| | 375 |
|
| |
(1) | Includes 2021 SPL Senior Notes, 2022 SPL Senior Notes, 2023 SPL Senior Notes, 2024 SPL Senior Notes, 2025 SPL Senior Notes, 2026 SPL Senior Notes, 2027 SPL Senior Notes, 2028 SPL Senior Notes, 2024 CCH Senior Notes and 2025 CCH Senior Notes. The Level 2 estimated fair value was based on quotes obtained from broker-dealers or market makers of these senior notes and other similar instruments. |
| |
(2) | The Level 3 estimated fair value was calculated based on inputs that are observable in the market or that could be derived from, or corroborated with, observable market data, including our stock price and interest rates based on debt issued by parties with comparable credit ratings to us and inputs that are not observable in the market. |
| |
(3) | Includes 2015 SPL Credit Facilities, SPL Working Capital Facility, 2016 CQP Credit Facilities, 2015 CCH Credit Facility, CCH Working Capital Facility, Cheniere Revolving Credit Facility and Cheniere Marketing trade finance facilities. The Level 3 estimated fair value approximates the principal amount because the interest rates are variable and reflective of market rates and the debt may be repaid, in full or in part, at any time without penalty. |
| |
(4) | The Level 1 estimated fair value was based on unadjusted quoted prices in active markets for identical liabilities that we had the ability to access at the measurement date. |
NOTE 11—RESTRUCTURING EXPENSE
During 2015 and 2016, we initiated and implemented certain organizational changes to simplify our corporate structure, improve our operational efficiencies and implement a strategy for sustainable, long-term stockholder value creation through financially disciplined development, construction, operation and investment. As a result of these efforts, we recorded $6 million and $7 million of restructuring charges and other costs associated with restructuring and operational efficiency initiatives during the three months ended March 31, 2017 and 2016, respectively, for which the majority of these charges required, or will require, cash expenditure. Included in these amounts are $3 million and $6 million for share-based compensation during the three months ended March 31, 2017 and 2016, respectively. All charges were recorded within the line item entitled “restructuring expense” on our Consolidated Statements of Operations and substantially all related to severance and other employee-related costs. As of both
CHENIERE ENERGY, INC. AND SUBSIDIARIES
NOTES TO CONSOLIDATED FINANCIAL STATEMENTS—CONTINUED
(unaudited)
March 31, 2017 and December 31, 2016, we had $6 million of accrued restructuring charges and other costs that were recorded as part of accrued liabilities on our Consolidated Balance Sheets. Organizational initiatives have been completed as of March 31, 2017.
NOTE 12—INCOME TAXES
We are not presently a taxpayer for federal or state income tax purposes and have not recorded a provision for federal or state income taxes in any of the periods included in the accompanying Consolidated Financial Statements. The net provision was immaterial for the three months ended March 31, 2017 for foreign income taxes. We have recorded a net provision of $1 million for the three months ended March 31, 2016 for foreign income taxes.
We experienced an ownership change within the provisions of Internal Revenue Code (“IRC”) Section 382 in 2008, 2010 and 2012. An analysis of the annual limitation on the utilization of our net operating losses (“NOLs”) was performed in accordance with IRC Section 382. It was determined that IRC Section 382 will not limit the use of our NOLs in full over the carryover period. We will continue to monitor trading activity in our shares which may cause an additional ownership change which could ultimately affect our ability to fully utilize our existing NOL carryforwards.
NOTE 13—SHARE-BASED COMPENSATION
We have granted stock, restricted stock, restricted stock units, performance stock units, phantom units and options to purchase common stock to employees, outside directors and a consultant under the Amended and Restated 2003 Stock Incentive Plan, as amended, 2011 Incentive Plan, as amended (the “2011 Plan”), the 2015 Long-Term Cash Incentive Plan and the 2015 Employee Inducement Incentive Plan.
In January 2017, the issuance of awards with respect to 7.8 million shares of common stock available for issuance under the 2011 Plan was approved at a special meeting of our shareholders. In February 2017, our Board of Directors approved the award of 0.9 million restricted stock units and 0.2 million target performance stock units under the 2011 Plan to certain employees as part of the Long-Term Incentive program implemented in 2017. Restricted stock unit awards vest ratably over a three-year service period on each of the first, second and third anniversaries of the grant date, subject to forfeiture upon termination except in certain events and acceleration upon certain events including death or disability. Performance stock units provide for three-year cliff vesting with payouts based on the Company’s cumulative distributable cash flow per share from January 1, 2018 through December 31, 2019 compared to a pre-established performance target. The number of shares that may be earned at the end of the vesting period ranges from 50 to 200 percent of the target award amount if the threshold performance is met. Both restricted stock units and performance stock units will be settled in Cheniere common stock and are classified as equity awards.
Total share-based compensation consisted of the following (in millions):
|
| | | | | | | | | | | | | | | | | | | | | | | | |
| | Three Months Ended March 31, 2017 | | Three Months Ended March 31, 2016 |
| | Equity Awards | | Liability Awards | | Total Awards | | Equity Awards | | Liability Awards | | Total Awards |
Total share-based compensation | | $ | 5 |
| | $ | 27 |
| | $ | 32 |
| | $ | 13 |
| | $ | 4 |
| | $ | 17 |
|
Capitalized share-based compensation | | (1 | ) | | (7 | ) | | (8 | ) | | (1 | ) | | — |
| | (1 | ) |
Total share-based compensation expense | | $ | 4 |
| | $ | 20 |
| | $ | 24 |
| | $ | 12 |
|
| $ | 4 |
| | $ | 16 |
|
For a further discussion of the Cheniere’s Equity Incentive Plans, see Note 15—Share-Based Compensation of our Notes to Consolidated Financial Statements in our annual report on Form 10-K for the year ended December 31, 2016.
CHENIERE ENERGY, INC. AND SUBSIDIARIES
NOTES TO CONSOLIDATED FINANCIAL STATEMENTS—CONTINUED
(unaudited)
NOTE 14—NET INCOME (LOSS) PER SHARE ATTRIBUTABLE TO COMMON STOCKHOLDERS
Basic net income (loss) per share attributable to common stockholders (“EPS”) excludes dilution and is computed by dividing net income (loss) attributable to common stockholders by the weighted average number of common shares outstanding during the period. Diluted EPS reflects potential dilution and is computed by dividing net income (loss) attributable to common stockholders by the weighted average number of common shares outstanding during the period increased by the number of additional common shares that would have been outstanding if the potential common shares had been issued. The dilutive effect of stock options and unvested stock is calculated using the treasury-stock method and the dilutive effect of convertible securities is calculated using the if-converted method.
The following table (in millions, except per share data) reconciles basic and diluted weighted average common shares outstanding for the three months ended March 31, 2017 and 2016:
|
| | | | | | | | |
| | Three Months Ended March 31, |
| | 2017 | | 2016 |
Weighted average common shares outstanding: | | | | |
Basic | | 232.4 |
| | 228.1 |
|
Dilutive unvested stock | | 0.3 |
| | — |
|
Diluted | | 232.7 |
| | 228.1 |
|
| | | | |
Basic and diluted net income (loss) per share attributable to common stockholders | | $ | 0.23 |
| | $ | (1.41 | ) |
Potentially dilutive securities that were not included in the diluted net income (loss) per share computations because their effect would have been anti-dilutive were as follows (in millions):
|
| | | | | | |
| | Three Months Ended March 31, |
| | 2017 | | 2016 |
Stock options and unvested stock (1) | | 1.2 |
| | 2.0 |
|
Convertible notes (2) | | 16.5 |
| | 16.0 |
|
Total potentially dilutive common shares | | 17.7 |
| | 18.0 |
|
| |
(1) | Does not include 5.1 million shares and 5.4 million shares for the three months ended March 31, 2017 and 2016, respectively, of unvested stock because the performance conditions had not yet been satisfied as of March 31, 2017 and 2016. |
| |
(2) | Includes number of shares in aggregate issuable upon conversion of the 2021 Cheniere Convertible Unsecured Notes and the 2045 Cheniere Convertible Senior Notes. There were no shares included in the computation of diluted net income (loss) per share for the 2025 CCH HoldCo II Convertible Senior Notes because substantive non-market-based contingencies underlying the eligible conversion date have not been met as of March 31, 2017. |
NOTE 15—COMMITMENTS AND CONTINGENCIES
We have various contractual obligations which are recorded as liabilities in our Consolidated Financial Statements. Other items, such as certain purchase commitments and other executed contracts which do not meet the definition of a liability as of March 31, 2017, are not recognized as liabilities.
Obligations under Certain Guarantee Contracts
Cheniere and certain of its subsidiaries enter into guarantee arrangements in the normal course of business to facilitate transactions with third parties. These arrangements include financial guarantees, letters of credit and debt guarantees. As of March 31, 2017 and December 31, 2016, there were no liabilities recognized under these guarantee arrangements.
CHENIERE ENERGY, INC. AND SUBSIDIARIES
NOTES TO CONSOLIDATED FINANCIAL STATEMENTS—CONTINUED
(unaudited)
Legal Proceedings
We may in the future be involved as a party to various legal proceedings, which are incidental to the ordinary course of business. We regularly analyze current information and, as necessary, provide accruals for probable liabilities on the eventual disposition of these matters. In the opinion of management, as of March 31, 2017, there were no pending legal matters that would reasonably be expected to have a material impact on our operating results, financial position or cash flows.
NOTE 16—BUSINESS SEGMENT INFORMATION
During the first quarter of 2017, we finalized our organizational changes to simplify our corporate structure, improve our operational efficiencies and implement a strategy for sustainable, long-term stockholder value creation through financially disciplined development, construction, operation and investment. As a result of these efforts, we revised the way we manage our business, which resulted in a change to our reportable segments. We previously had two reportable segments: LNG terminal segment and LNG and natural gas marketing segment. We have now determined that we operate as a single operating and reportable segment. Our chief operating decision maker makes resource allocation decisions and assesses performance based on financial information presented on a consolidated basis in the delivery of an integrated source of LNG to our customers.
Customer Concentration
The following table shows customers with revenues of 10% or greater of total revenues and customers with accounts receivable balances of 10% or greater of total accounts receivables:
|
| | | | | | | | |
| | Percentage of Total Revenues | | Percentage of Accounts Receivable |
| | Three Months Ended March 31, | | March 31, | | December 31, |
| | 2017 | | 2016 | | 2017 | | 2016 |
Customer A | | 33% | | —% | | 28% | | 34% |
Customer B | | 13% | | —% | | 14% | | 21% |
Customer C | | 10% | | —% | | 24% | | 28% |
Customer D | | 19% | | —% | | 16% | | —% |
Customer E | | —% | | —% | | —% | | 12% |
NOTE 17—SUPPLEMENTAL CASH FLOW INFORMATION
The following table (in millions) provides supplemental disclosure of cash flow information:
|
| | | | | | | | |
| | Three Months Ended March 31, |
| | 2017 | | 2016 |
Cash paid during the period for interest, net of amounts capitalized | | $ | 163 |
| | $ | 15 |
|
The balance in property, plant and equipment, net funded with accounts payable and accrued liabilities was $503 million and $577 million as of March 31, 2017 and 2016, respectively.
CHENIERE ENERGY, INC. AND SUBSIDIARIES
NOTES TO CONSOLIDATED FINANCIAL STATEMENTS—CONTINUED
(unaudited)
NOTE 18—RECENT ACCOUNTING STANDARDS
The following table provides a brief description of recent accounting standards that had not been adopted by the Company as of March 31, 2017:
|
| | | | | | |
Standard | | Description | | Expected Date of Adoption | | Effect on our Consolidated Financial Statements or Other Significant Matters |
ASU 2014-09, Revenue from Contracts with Customers (Topic 606), and subsequent amendments thereto | | This standard provides a single, comprehensive revenue recognition model which replaces and supersedes most existing revenue recognition guidance and requires an entity to recognize revenue to depict the transfer of promised goods or services to customers in an amount that reflects the consideration to which the entity expects to be entitled in exchange for those goods or services. The standard requires that the costs to obtain and fulfill contracts with customers should be recognized as assets and amortized to match the pattern of transfer of goods or services to the customer if expected to be recoverable. The standard also requires enhanced disclosures. This guidance may be adopted either retrospectively to each prior reporting period presented subject to allowable practical expedients (“full retrospective approach”) or as a cumulative-effect adjustment as of the date of adoption (“modified retrospective approach”). | | January 1, 2018 | | We continue to evaluate the effect of this standard on our Consolidated Financial Statements. Preliminarily, we plan to adopt this standard using the full retrospective approach and we do not currently anticipate that the adoption will have a material impact upon our revenues. The Financial Accounting Standards Board has issued and may issue in the future amendments and interpretive guidance which may cause our evaluation to change. Furthermore, we routinely enter into new contracts and we cannot predict with certainty whether the accounting for any future contract under the new standard would result in a significant change from existing guidance. Because this assessment is preliminary and the accounting for revenue recognition is subject to significant judgment, this conclusion could change as we finalize our assessment. We have not yet determined the impact that recognizing fulfillment costs as assets will have on our Consolidated Financial Statements. |
ASU 2016-02, Leases (Topic 842) | | This standard requires a lessee to recognize leases on its balance sheet by recording a lease liability representing the obligation to make future lease payments and a right-of-use asset representing the right to use the underlying asset for the lease term. A lessee is permitted to make an election not to recognize lease assets and liabilities for leases with a term of 12 months or less. The standard also modifies the definition of a lease and requires expanded disclosures. This guidance may be early adopted, and must be adopted using a modified retrospective approach with certain available practical expedients. | | January 1, 2019
| | We continue to evaluate the effect of this standard on our Consolidated Financial Statements. Preliminarily, we anticipate a material impact from the requirement to recognize all leases upon our Consolidated Balance Sheets. Because this assessment is preliminary and the accounting for leases is subject to significant judgment, this conclusion could change as we finalize our assessment. We have not yet determined the impact of the adoption of this standard upon our results of operations or cash flows, whether we will elect to early adopt this standard or which, if any, practical expedients we will elect upon transition. |
ASU 2016-16, Income Taxes (Topic 740): Intra-Entity Transfers of Assets Other Than Inventory | | This standard requires the immediate recognition of the tax consequences of intercompany asset transfers other than inventory. This guidance may be early adopted, but only at the beginning of an annual period, and must be adopted using a modified retrospective approach. | | January 1, 2018
| | We are currently evaluating the impact of the provisions of this guidance on our Consolidated Financial Statements and related disclosures. |
CHENIERE ENERGY, INC. AND SUBSIDIARIES
NOTES TO CONSOLIDATED FINANCIAL STATEMENTS—CONTINUED
(unaudited)
Additionally, the following table provides a brief description of recent accounting standards that were adopted by the Company during the reporting period:
|
| | | | | | |
Standard | | Description | | Date of Adoption | | Effect on our Consolidated Financial Statements or Other Significant Matters |
ASU 2015-11, Inventory (Topic 330): Simplifying the Measurement of Inventory
| | This standard requires inventory to be measured at the lower of cost and net realizable value. Net realizable value is the estimated selling prices in the ordinary course of business, less reasonably predictable costs of completion, disposal and transportation. This guidance may be early adopted and must be adopted prospectively. | | January 1, 2017 | | The adoption of this guidance did not have a material impact on our Consolidated Financial Statements or related disclosures.
|
ASU 2016-09, Compensation - Stock Compensation (Topic 718): Improvements to Employee Share-Based Payment Accounting | | This standard primarily requires the recognition of excess tax benefits for share-based awards in the statement of operations and the classification of excess tax benefits as an operating activity within the statement of cash flows. The guidance also allows an entity to elect to account for forfeitures when they occur. This guidance may be early adopted, but all of the guidance must be adopted in the same period. | | January 1, 2017
| | Upon adoption of this guidance, we made a cumulative effect adjustment to accumulated deficit for all excess tax benefits not previously recognized, offset by the change in valuation allowance, and for our election to account for forfeitures as they occur. The adoption of this guidance did not have a material impact on our Consolidated Financial Statements or related disclosures.
|
ASU 2017-04, Intangibles - Goodwill and Other (Topic 350): Simplifying the Test for Goodwill Impairment | | This standard simplifies the measurement of goodwill impairment by eliminating the requirement for an entity to perform a hypothetical purchase price allocation. An entity will instead measure the impairment as the difference between the carrying amount and the fair value of the reporting unit. This guidance may be early adopted beginning January 1, 2017, and must be adopted prospectively. | | January 1, 2017
| | The adoption of this guidance did not have a material impact on our Consolidated Financial Statements or related disclosures.
|
| |
ITEM 2. | MANAGEMENT’S DISCUSSION AND ANALYSIS OF FINANCIAL CONDITION AND RESULTS OF OPERATIONS |
Information Regarding Forward-Looking Statements
This quarterly report contains certain statements that are, or may be deemed to be, “forward-looking statements” within the meaning of Section 27A of the Securities Act of 1933, as amended, and Section 21E of the Securities Exchange Act of 1934, as amended (the “Exchange Act”). All statements, other than statements of historical or present facts or conditions, included herein or incorporated herein by reference are “forward-looking statements.” Included among “forward-looking statements” are, among other things:
| |
• | statements that we expect to commence or complete construction of our proposed LNG terminals, liquefaction facilities, pipeline facilities or other projects, or any expansions thereof, by certain dates, or at all; |
| |
• | statements regarding future levels of domestic and international natural gas production, supply or consumption or future levels of LNG imports into or exports from North America and other countries worldwide or purchases of natural gas, regardless of the source of such information, or the transportation or other infrastructure or demand for and prices related to natural gas, LNG or other hydrocarbon products; |
| |
• | statements regarding any financing transactions or arrangements, or our ability to enter into such transactions; |
| |
• | statements relating to the construction of our Trains and pipeline, including statements concerning the engagement of any EPC contractor or other contractor and the anticipated terms and provisions of any agreement with any such EPC or other contractor, and anticipated costs related thereto; |
| |
• | statements regarding any SPA or other agreement to be entered into or performed substantially in the future, including any revenues anticipated to be received and the anticipated timing thereof, and statements regarding the amounts of total LNG regasification, natural gas liquefaction or storage capacities that are, or may become, subject to contracts; |
| |
• | statements regarding counterparties to our commercial contracts, construction contracts and other contracts; |
| |
• | statements regarding our planned development and construction of additional Trains and pipelines, including the financing of such Trains; |
| |
• | statements that our Trains, when completed, will have certain characteristics, including amounts of liquefaction capacities; |
| |
• | statements regarding our business strategy, our strengths, our business and operation plans or any other plans, forecasts, projections, or objectives, including anticipated revenues, capital expenditures, maintenance and operating costs and cash flows, any or all of which are subject to change; |
| |
• | statements regarding legislative, governmental, regulatory, administrative or other public body actions, approvals, requirements, permits, applications, filings, investigations, proceedings or decisions; and |
| |
• | any other statements that relate to non-historical or future information. |
All of these types of statements, other than statements of historical or present facts or conditions, are forward-looking statements. In some cases, forward-looking statements can be identified by terminology such as “may,” “will,” “could,” “should,” “expect,” “plan,” “project,” “intend,” “anticipate,” “believe,” “estimate,” “predict,” “potential,” “pursue,” “target,” “continue,” the negative of such terms or other comparable terminology. The forward-looking statements contained in this quarterly report are largely based on our expectations, which reflect estimates and assumptions made by our management. These estimates and assumptions reflect our best judgment based on currently known market conditions and other factors. Although we believe that such estimates are reasonable, they are inherently uncertain and involve a number of risks and uncertainties beyond our control. In addition, assumptions may prove to be inaccurate. We caution that the forward-looking statements contained in this quarterly report are not guarantees of future performance and that such statements may not be realized or the forward-looking statements or events may not occur. Actual results may differ materially from those anticipated or implied in forward-looking statements as a result of a variety of factors described in this quarterly report and in the other reports and other information that we file with the SEC. These forward-looking statements speak only as of the date made, and other than as required by law, we undertake no obligation to update or revise any forward-looking statement or provide reasons why actual results may differ, whether as a result of new information, future events or otherwise.
Our actual results could differ materially from those anticipated in these forward-looking statements as a result of a variety of factors, including those discussed under “Risk Factors” in our annual report on Form 10-K for the year ended December 31,
2016. All forward-looking statements attributable to us or persons acting on our behalf are expressly qualified in their entirety by these risk factors. Other than as required under the securities laws, we assume no obligation to update or revise these forward-looking statements or provide reasons why actual results may differ.
Introduction
The following discussion and analysis presents management’s view of our business, financial condition and overall performance and should be read in conjunction with our Consolidated Financial Statements and the accompanying notes. This information is intended to provide investors with an understanding of our past performance, current financial condition and outlook for the future. Our discussion and analysis includes the following subjects:
| |
• | Overview of Significant Events |
| |
• | Liquidity and Capital Resources |
| |
• | Off-Balance Sheet Arrangements |
| |
• | Summary of Critical Accounting Estimates |
| |
• | Recent Accounting Standards |
Overview of Business
Cheniere, a Delaware corporation, is a Houston-based energy company primarily engaged in LNG-related businesses. Our vision is to be recognized as the premier global LNG company and provide a reliable, competitive and integrated source of LNG to our customers while creating a safe, productive and rewarding work environment for our employees. We own and operate the Sabine Pass LNG terminal in Louisiana through our ownership interest in and management agreements with Cheniere Partners, which is a publicly traded limited partnership that we created in 2007. We own 100% of the general partner interest in Cheniere Partners and 82.7% of Cheniere Holdings, which is a publicly traded limited liability company formed in 2013 that owns a 55.9% limited partner interest in Cheniere Partners. We are currently developing and constructing two natural gas liquefaction and export facilities. The liquefaction of natural gas into LNG allows it to be shipped economically from areas of the world where natural gas is abundant and inexpensive to produce to other areas where natural gas demand and infrastructure exist to economically justify the use of LNG.
The Sabine Pass LNG terminal is located in Cameron Parish, Louisiana, on the Sabine-Neches Waterway less than four miles from the Gulf Coast. Cheniere Partners is developing, constructing and operating natural gas liquefaction facilities (the “SPL Project”) at the Sabine Pass LNG terminal adjacent to the existing regasification facilities through a wholly owned subsidiary, SPL. Cheniere Partners plans to construct up to six Trains, which are in various stages of development, construction and operations. Trains 1 through 3 have commenced commercial operations, Train 4 is undergoing commissioning, Train 5 is under construction and Train 6 is being commercialized and has all necessary regulatory approvals in place. Each Train is expected to have a nominal production capacity, which is prior to adjusting for planned maintenance, production reliability and potential overdesign, of approximately 4.5 mtpa of LNG. The Sabine Pass LNG terminal has operational regasification facilities owned by Cheniere Partners’ wholly owned subsidiary, SPLNG, that include existing infrastructure of five LNG storage tanks with capacity of approximately 16.9 Bcfe, two marine berths that can accommodate vessels with nominal capacity of up to 266,000 cubic meters and vaporizers with regasification capacity of approximately 4.0 Bcf/d. Cheniere Partners also owns a 94-mile pipeline that interconnects the Sabine Pass LNG terminal with a number of large interstate pipelines through a wholly owned subsidiary, CTPL.
We are developing and constructing a second natural gas liquefaction and export facility at the Corpus Christi LNG terminal, which is on nearly 2,000 acres of land that we own or control near Corpus Christi, Texas, and a pipeline facility (collectively, the “CCL Project”) through wholly owned subsidiaries CCL and CCP, respectively. The CCL Project is being developed for up to three Trains, with expected aggregate nominal production capacity, which is prior to adjusting for planned maintenance, production reliability and potential overdesign, of approximately 13.5 mtpa of LNG, three LNG storage tanks with aggregate capacity of approximately 10.1 Bcfe and two marine berths that can each accommodate vessels with nominal capacity of up to 266,000 cubic meters. The CCL Project is being developed in stages. The first stage (“Stage 1”) includes Trains 1 and 2, two LNG storage tanks, one complete marine berth and a second partial berth and all of the CCL Project’s necessary infrastructure facilities. The second
stage (“Stage 2”) includes Train 3, one LNG storage tank and the completion of the second partial berth. The CCL Project also includes a 23-mile natural gas supply pipeline that will interconnect the Corpus Christi LNG terminal with several interstate and intrastate natural gas pipelines (the “Corpus Christi Pipeline”).
The CCL Stage III entities, our wholly owned subsidiaries separate from the CCH Group, are also developing two additional Trains and one LNG storage tank at the Corpus Christi LNG terminal adjacent to the CCL Project, along with a second natural gas pipeline. We remain focused on leveraging infrastructure through the expansion of our existing sites. We are also in various stages of developing other projects, including liquefaction projects and other infrastructure projects in support of natural gas supply and LNG demand, which, among other things, will require acceptable commercial and financing arrangements before we make a final investment decision (“FID”).
Overview of Significant Events
Our significant accomplishments since January 1, 2017 and through the filing date of this Form 10-Q include the following:
Strategic
| |
• | Year to date, LNG from the SPL Project has been delivered to 6 new countries. As of April 2017, LNG from the SPL Project had reached 20 of the 39 LNG importing countries around the world. |
| |
• | We completed a land acquisition and acquired rights to obtain additional upland and waterfront land adjacent to the CCL Project aggregating more than 500 acres. |
| |
• | Midship Pipeline Company, LLC (“Midship Pipeline”) signed precedent agreements to support construction of an approximately 200-mile interstate natural gas pipeline with expected capacity of 1.0 Bcf/d, to connect new production in the Anadarko Basin to Gulf Coast markets. |
Operational
| |
• | 43 LNG cargoes (154 million MMBtu) were loaded from the SPL Project in the first quarter of 2017, and in early April 2017 we reached the milestone of 100 cumulative LNG cargoes exported from the SPL Project. |
| |
• | SPL commenced production and shipment of LNG commissioning cargoes from Train 3 of the SPL Project in January 2017 and achieved substantial completion and commenced operating activities in March 2017. |
| |
• | Commissioning activities for Train 4 of the SPL Project began in March 2017. |
Financial
| |
• | In February and March 2017, SPL issued aggregate principal amounts of $800 million of 5.00% Senior Secured Notes due 2037 (the “2037 SPL Senior Notes”) and $1.35 billion, before discount, of 4.200% Senior Secured Notes due 2028 (the “2028 SPL Senior Notes”), respectively. Net proceeds of the offerings of the 2037 SPL Senior Notes and 2028 SPL Senior Notes were $789 million and $1.33 billion, respectively, after deducting the initial purchasers’ commissions (for the 2028 SPL Senior Notes) and estimated fees and expenses. The net proceeds of the 2037 SPL Senior Notes were used to repay the outstanding borrowings under the credit facilities SPL entered into in June 2015 (the “2015 SPL Credit Facilities”) and, along with the net proceeds of the 2028 SPL Senior Notes, the remainder is being used to pay a portion of the capital costs in connection with the construction of Trains 1 through 5 of the SPL Project in lieu of the terminated portion of the commitments under the 2015 SPL Credit Facilities. |
| |
• | In March 2017, we entered into a $750 million revolving credit agreement (“Cheniere Revolving Credit Facility”) that may be used to fund the development of the CCL Project and, provided that certain conditions are met, for general corporate purposes. |
| |
• | In January 2017, Fitch Ratings assigned SPL’s senior secured debt an investment grade rating of BBB-. |
Liquidity and Capital Resources
Although results are consolidated for financial reporting, Cheniere, Cheniere Holdings, Cheniere Partners, SPL and the CCH Group operate with independent capital structures. We expect the cash needs for at least the next twelve months will be met for each of these independent capital structures as follows:
•SPL through project debt and borrowings and operating cash flows;
| |
• | Cheniere Partners through operating cash flows from SPLNG, SPL and CTPL and debt or equity offerings; |
•Cheniere Holdings through distributions from Cheniere Partners;
•CCH Group through project debt and borrowings and equity contributions from Cheniere; and
| |
• | Cheniere through project financing, existing unrestricted cash, debt and equity offerings by us or our subsidiaries, operating cash flows, services fees from Cheniere Holdings, Cheniere Partners and its other subsidiaries and distributions from our investments in Cheniere Holdings and Cheniere Partners. |
The following table (in millions) provides a summary of our liquidity position at March 31, 2017 and December 31, 2016:
|
| | | | | | | |
| March 31, | | December 31, |
| 2017 | | 2016 |
Cash and cash equivalents | $ | 923 |
| | $ | 876 |
|
Restricted cash designated for the following purposes: | | | |
SPL Project | 1,531 |
| | 358 |
|
CQP and cash held by guarantor subsidiaries | 225 |
| | 247 |
|
CCL Project | 143 |
| | 270 |
|
Other | 119 |
| | 76 |
|
Available commitments under the following credit facilities: | | | |
2015 SPL Credit Facilities | — |
| | 1,642 |
|
$1.2 billion SPL Working Capital Facility (“SPL Working Capital Facility”) | 823 |
| | 653 |
|
$2.8 billion 2016 CQP Credit Facilities (“2016 CQP Credit Facilities”) | 190 |
| | 195 |
|
2015 CCH Credit Facility (“2015 CCH Credit Facility”) | 3,055 |
| | 3,603 |
|
$350 million CCH Working Capital Facility (“CCH Working Capital Facility”) | 268 |
| | 350 |
|
Cheniere Revolving Credit Facility | 750 |
| | — |
|
For additional information regarding our debt agreements, see Note 10—Debt of our Notes to Consolidated Financial Statements.
Cheniere
Convertible Notes
In November 2014, we issued an aggregate principal amount of $1.0 billion Convertible Unsecured Notes due 2021 (the “2021 Cheniere Convertible Unsecured Notes”). The 2021 Cheniere Convertible Unsecured Notes are convertible at the option of the holder into our common stock at the then applicable conversion rate, provided that the closing price of our common stock is greater than or equal to the conversion price on the date of conversion. In March 2015, we issued the $625.0 million aggregate principal amount of 4.25% Convertible Senior Notes due 2045 (the “2045 Cheniere Convertible Senior Notes”). We have the right, at our option, at any time after March 15, 2020, to redeem all or any part of the 2045 Cheniere Convertible Senior Notes at a redemption price equal to the accreted amount of the 2045 Cheniere Convertible Senior Notes to be redeemed, plus accrued and unpaid interest, if any, to such redemption date. We have the option to satisfy the conversion obligation for the 2021 Cheniere Convertible Unsecured Notes and the 2045 Cheniere Convertible Senior Notes with cash, common stock or a combination thereof. See Note 10—Debt of our Notes to Consolidated Financial Statements in this quarterly report and Note 12—Debt of our Notes to Consolidated Financial Statements in our annual report on Form 10-K for the year ended December 31, 2016 for additional information regarding our convertible notes.
Cheniere Revolving Credit Facility
In March 2017, we entered into the Cheniere Revolving Credit Facility that may be used to fund, through loans and letters of credit, equity capital contributions to CCH HoldCo II and its subsidiaries for the development of the CCL Project and, provided that certain conditions are met, for general corporate purposes. No advances or letters of credit under the Cheniere Revolving Credit Facility are available until either (1) Cheniere’s unrestricted cash and cash equivalents are less than $500 million or (2) Train 4 of the SPL Project has achieved substantial completion.
The Cheniere Revolving Credit Facility matures on March 2, 2021 and contains representations, warranties and affirmative and negative covenants customary for companies like Cheniere with lenders of the type participating in the Cheniere Revolving
Credit Facility that limit our ability to make restricted payments, including distributions, unless certain conditions are satisfied, as well as limitations on indebtedness, guarantees, hedging, liens, investments and affiliate transactions. Under the terms of the Cheniere Revolving Credit Facility, we are required to ensure that the sum of our unrestricted cash and the amount of undrawn commitments under the Cheniere Revolving Credit Facility is at least equal to the lesser of (1) 20% of the commitments under the Cheniere Revolving Credit Facility and (2) $100 million.
The Cheniere Revolving Credit Facility is secured by a first priority security interest (subject to permitted liens and other customary exceptions) in substantially all of our assets, including our interests in our direct subsidiaries (excluding CCH HoldCo II). See Note 10—Debt of our Notes to Consolidated Financial Statements in this quarterly report.
Cash Receipts from Subsidiaries
As of March 31, 2017, we had an 82.7% direct ownership interest in Cheniere Holdings. We receive dividends on our Cheniere Holdings shares from the distributions that Cheniere Holdings receives from Cheniere Partners. During each of the three months ended March 31, 2017 and 2016, we received $4 million in dividends on our Cheniere Holdings common shares.
Our ownership interest in the Sabine Pass LNG terminal is held through Cheniere Partners. As of March 31, 2017, we own 82.7% of Cheniere Holdings, which owns a 55.9% limited partner interest in Cheniere Partners in the form of 12.0 million common units, 45.3 million Class B units and 135.4 million subordinated units. We also own 100% of the general partner interest and the incentive distribution rights in Cheniere Partners. We receive quarterly equity distributions from Cheniere Partners related to our 2% general partner interest.
We also receive fees for providing management services to Cheniere Holdings, Cheniere Partners, SPLNG, SPL and CTPL. We received $47 million and $63 million in total service fees from Cheniere Holdings, Cheniere Partners, SPLNG, SPL and CTPL during the three months ended March 31, 2017 and 2016, respectively.
Cheniere Partners’ common unit and general partner distributions are being funded from accumulated operating surplus. Neither we nor Cheniere Holdings received distributions on our subordinated units with respect to the quarters ended on or after June 30, 2010. Cheniere Partners will not make distributions on subordinated units until it generates additional cash flow from SPLNG, SPL, CTPL or other new business, which would be used to make quarterly distributions on our subordinated units before any increase in distributions to the common unitholders.
Cheniere Partners Class B Units
Cheniere Partners’ Class B units are subject to conversion, mandatorily or at the option of the Class B unitholders under specified circumstances, into a number of common units based on the then-applicable conversion value of the Class B units. The Cheniere Partners Class B units are not entitled to cash distributions except in the event of a liquidation of Cheniere Partners, a merger, consolidation or other combination of Cheniere Partners with another person or the sale of all or substantially all of the assets of Cheniere Partners. On a quarterly basis beginning on the initial purchase date of the Class B units, the conversion value of the Class B units increases at a compounded rate of 3.5% per quarter, subject to an additional upward adjustment for certain equity and debt financings. The accreted conversion ratio of the Class B units owned by Cheniere Holdings and Blackstone CQP Holdco LP (“Blackstone CQP Holdco”) was 1.97 and 1.92, respectively, as of March 31, 2017. Since Train 3 of the SPL Project achieved substantial completion in March 2017, the Class B units will mandatorily convert into common units on the first business day following the record date of Cheniere Partners’ first distribution with respect to the quarter ended June 30, 2017 if not voluntarily converted by Blackstone CQP Holdco earlier.
The Class B units were issued at a discount to the market price of the Cheniere Partners common units into which they are convertible. This discount, totaling $2,130 million, represents a beneficial conversion feature. The beneficial conversion feature is similar to a dividend that will be distributed with respect to any Class B unit from its issuance date through its conversion date, resulting in an increase in Class B unitholders’ equity and a decrease in common and subordinated unitholders’ equity, including our equity interest in Cheniere Partners. Cheniere Partners amortizes the beneficial conversion feature through the mandatory conversion date of August 2017. Deemed dividends represented by the amortization of the beneficial conversion feature allocated to the Class B units held by Blackstone CQP Holdco are included in net income (loss) attributable to non-controlling interest and result in a reduction of income available to common stockholders. The impact to net income (loss) attributable to non-controlling interest due to the amortization of the beneficial conversion feature was approximately $84 million and $1 million during the three
months ended March 31, 2017 and 2016, respectively, and is anticipated to be approximately $748 million for the year ending December 31, 2017 based on the ownership interest as of March 31, 2017.
Cheniere Partners
In February 2016, Cheniere Partners entered into the 2016 CQP Credit Facilities. The 2016 CQP Credit Facilities consist of: (1) a $450 million CTPL tranche term loan that was used to prepay the $400 million term loan facility (the “CTPL Term Loan”) in February 2016, (2) an approximately $2.1 billion SPLNG tranche term loan that was used to repay and redeem the approximately $2.1 billion of the senior notes previously issued by SPLNG in November 2016, (3) a $125 million DSR Facility that may be used to satisfy a six-month debt service reserve requirement and (4) a $115 million revolving credit facility that may be used for general business purposes. Cheniere Partners had $2.6 billion of outstanding borrowings under the 2016 CQP Credit Facilities as of both March 31, 2017 and December 31, 2016, and Cheniere Partners had $190 million and $195 million of available commitments and $50 million and $45 million aggregate amount of issued letters of credit as of March 31, 2017 and December 31, 2016, respectively.
The 2016 CQP Credit Facilities mature on February 25, 2020, and the outstanding balance may be repaid, in whole or in part, at any time without premium or penalty, except for interest hedging and interest rate breakage costs. The 2016 CQP Credit Facilities contain conditions precedent for extensions of credit, as well as customary affirmative and negative covenants and limit Cheniere Partners’ ability to make restricted payments, including distributions, to once per fiscal quarter as long as certain conditions are satisfied. Under the terms of the 2016 CQP Credit Facilities, Cheniere Partners is required to hedge not less than 50% of the variable interest rate exposure on its projected aggregate outstanding balance, maintain a minimum debt service coverage ratio of at least 1.15x at the end of each fiscal quarter beginning March 31, 2019 and have a projected debt service coverage ratio of 1.55x in order to incur additional indebtedness to refinance a portion of the existing obligations.
The 2016 CQP Credit Facilities are unconditionally guaranteed by each subsidiary of Cheniere Partners other than SPL, certain of the subsidiaries of Cheniere Partners owning other development projects, as well as certain other specified subsidiaries and members of the foregoing entities.
See Note 10—Debt of our Notes to Consolidated Financial Statements in this quarterly report and Note 12—Debt of our Notes to Consolidated Financial Statements in our annual report on Form 10-K for the year ended December 31, 2016 for additional information regarding the 2016 CQP Credit Facilities.
Sabine Pass LNG Terminal
Liquefaction Facilities
The SPL Project is being developed and constructed at the Sabine Pass LNG terminal adjacent to the existing regasification facilities. We have received authorization from the FERC to site, construct and operate Trains 1 through 6. The following table summarizes the overall project status of the SPL Project as of March 31, 2017:
|
| | | | | | | | |
| SPL Trains 1 & 2 | | SPL Trains 3 & 4 | | SPL Train 5 |
Overall project completion percentage | 100% | | 97.3% | | 63.1% |
Completion percentage of: | | | | | |
Engineering | 100% | | 100% | | 99.2% |
Procurement | 100% | | 100% | | 93.0% |
Subcontract work | 100% | | 84.3% | | 46.0% |
Construction | 100% | | 96.7% | | 19.2% |
Date of expected substantial completion | Train 1 | Operational | | Train 3 | Operational | | Train 5 | 2H 2019 |
| Train 2 | Operational | | Train 4 | 2H 2017 | | | |
We achieved substantial completion of Trains 1, 2 and 3 of the SPL Project and commenced operating activities in May 2016, September 2016 and March 2017, respectively, and started the commissioning of Train 4 of the SPL Project in March 2017.
The following orders have been issued by the DOE authorizing the export of domestically produced LNG by vessel from the Sabine Pass LNG terminal:
| |
• | Trains 1 through 4—FTA countries for a 30-year term, which commenced on May 15, 2016, and non-FTA countries for a 20-year term, which commenced on June 3, 2016, in an amount up to a combined total of the equivalent of 16 mtpa (approximately 803 Bcf/yr of natural gas). |
| |
• | Trains 1 through 4—FTA countries for a 25-year term and non-FTA countries for a 20-year term, in an amount up to a combined total of the equivalent of approximately 203 Bcf/yr of natural gas (approximately 4 mtpa). |
| |
• | Trains 5 and 6—FTA countries and non-FTA countries for a 20-year term, in an amount up to a combined total of 503.3 Bcf/yr of natural gas (approximately 10 mtpa). |
In each case, the terms of these authorizations begin on the earlier of the date of first export thereunder or the date specified in the particular order, which ranges from five to 10 years from the date the order was issued. In addition, we received an order providing for a three-year makeup period with respect to each of the non-FTA orders for LNG volumes we were unable to export during any portion of the initial 20-year export period of such order.
In January 2016, the DOE issued an order authorizing SPL to export domestically produced LNG by vessel from the Sabine Pass LNG terminal to FTA countries and non-FTA countries over a two-year period commencing on January 15, 2016, in an aggregate amount up to the equivalent of 600 Bcf of natural gas (however, exports to non-FTA countries under this order, when combined with exports to non-FTA countries under the orders related to Trains 1 through 4 above, may not exceed 1,006 Bcf/yr).
A party to the proceedings requested rehearings of the orders above related to the export of 803 Bcf/yr, 203 Bcf/yr and 503.3 Bcf/yr to non-FTA countries. The DOE issued orders denying rehearing of the orders. The same party petitioned the U.S. Court of Appeals for the District of Columbia Circuit to review (1) the 203 Bcf/yr order to non-FTA countries and the order denying the request for rehearing of the same and (2) the 503.3 Bcf/yr order to non-FTA countries and the order denying the request for rehearing of the same. Both appeals are pending.
Customers
SPL has entered into six fixed price, 20-year SPAs with extension rights with third parties to make available an aggregate amount of LNG that equates to approximately 19.75 mtpa of LNG, which is approximately 88% of the expected aggregate nominal production capacity of Trains 1 through 5. The obligation to make LNG available under the SPAs commences from the date of first commercial delivery for Trains 1 through 5, as specified in each SPA. Under these SPAs, the customers will purchase LNG from SPL for a price consisting of a fixed fee per MMBtu of LNG (a portion of which is subject to annual adjustment for inflation) plus a variable fee equal to 115% of Henry Hub per MMBtu of LNG. In certain circumstances, the customers may elect to cancel or suspend deliveries of LNG cargoes, in which case the customers would still be required to pay the fixed fee with respect to the contracted volumes that are not delivered as a result of such cancellation or suspension. The SPAs and contracted volumes to be made available under the SPAs are not tied to a specific Train; however, the term of each SPA commences upon the start of operations of a specified Train.
In aggregate, the fixed fee portion to be paid by the third-party SPA customers is approximately $2.9 billion annually for Trains 1 through 5, with the applicable fixed fees starting from the date of first commercial delivery from the applicable Train. These fixed fees equal approximately $411 million, $564 million, $650 million, $648 million and $588 million for each of Trains 1 through 5, respectively.
Any LNG produced by SPL in excess of that required for other customers is sold by our integrated marketing function, in fulfilment of various sales commitments.
Natural Gas Transportation, Storage and Supply
To ensure SPL is able to transport adequate natural gas feedstock to the Sabine Pass LNG terminal, it has entered into transportation precedent and other agreements to secure firm pipeline transportation capacity with CTPL and third-party pipeline companies. SPL has entered into firm storage services agreements with third parties to assist in managing volatility in natural gas needs for the SPL Project. SPL has also entered into enabling agreements and long-term natural gas supply contracts with third parties in order to secure natural gas feedstock for the SPL Project. As of March 31, 2017, SPL has secured up to approximately 2,051 million MMBtu of natural gas feedstock through long-term and short-term natural gas supply contracts.
Construction
SPL entered into lump sum turnkey contracts with Bechtel Oil, Gas and Chemicals, Inc. (“Bechtel”) for the engineering, procurement and construction of Trains 1 through 5 of the SPL Project, under which Bechtel charges a lump sum for all work performed and generally bears project cost risk unless certain specified events occur, in which case Bechtel may cause SPL to enter into a change order, or SPL agrees with Bechtel to a change order.
The total contract prices of the EPC contract for Trains 1 and 2, the EPC contract for Trains 3 and 4 and the EPC contract for Train 5 of the SPL Project are approximately $4.1 billion, $3.9 billion and $3.0 billion, respectively, reflecting amounts incurred under change orders through March 31, 2017. Total expected capital costs for Trains 1 through 5 are estimated to be between $12.5 billion and $13.5 billion before financing costs and between $17.5 billion and $18.5 billion after financing costs including, in each case, estimated owner’s costs and contingencies.
Final Investment Decision on Train 6
We will contemplate making an FID to commence construction of Train 6 of the SPL Project based upon, among other things, entering into an EPC contract, entering into acceptable commercial arrangements and obtaining adequate financing to construct Train 6.
Regasification Facilities
The Sabine Pass LNG terminal has operational regasification capacity of approximately 4.0 Bcf/d and aggregate LNG storage capacity of approximately 16.9 Bcfe. Approximately 2.0 Bcf/d of the regasification capacity at the Sabine Pass LNG terminal has been reserved under two long-term third-party TUAs, under which SPLNG’s customers are required to pay fixed monthly fees, whether or not they use the LNG terminal. Each of Total Gas & Power North America, Inc. (“Total”) and Chevron U.S.A. Inc. (“Chevron”) has reserved approximately 1.0 Bcf/d of regasification capacity and is obligated to make monthly capacity payments to SPLNG aggregating approximately $125 million annually for 20 years that commenced in 2009. Total S.A. has guaranteed Total’s obligations under its TUA up to $2.5 billion, subject to certain exceptions, and Chevron Corporation has guaranteed Chevron’s obligations under its TUA up to 80% of the fees payable by Chevron.
The remaining approximately 2.0 Bcf/d of capacity has been reserved under a TUA by SPL. SPL is obligated to make monthly capacity payments to SPLNG aggregating approximately $250 million annually, continuing until at least 20 years after SPL delivers its first commercial cargo at the SPL Project. SPL entered into a partial TUA assignment agreement with Total, whereby upon substantial completion of Train 3, SPL commenced gaining access to a portion of Total’s capacity and other services provided under Total’s TUA with SPLNG. This agreement provides SPL with additional berthing and storage capacity at the Sabine Pass LNG terminal that may be used to provide increased flexibility in managing LNG cargo loading and unloading activity, permit SPL to more flexibly manage its LNG storage capacity and accommodate the development of Trains 5 and 6. Notwithstanding any arrangements between Total and SPL, payments required to be made by Total to SPLNG will continue to be made by Total to SPLNG in accordance with its TUA.
Under each of these TUAs, SPLNG is entitled to retain 2% of the LNG delivered to the Sabine Pass LNG terminal.
Capital Resources
We currently expect that SPL’s capital resources requirements with respect to Trains 1 through 5 of the SPL Project will be financed through borrowings and cash flows under the SPAs. We believe that with the net proceeds of borrowings, available commitments under the SPL Working Capital Facility and cash flows from operations, we will have adequate financial resources available to complete Trains 1 through 5 of the SPL Project and to meet our currently anticipated capital, operating and debt service requirements. SPL began generating cash flows from operations from the SPL Project in May 2016, when Train 1 achieved substantial completion and initiated operating activities. Trains 2 and 3 subsequently achieved substantial completion in September 2016 and March 2017, respectively. Additionally, during the three months ended March 31, 2017 and 2016, we realized offsets to LNG terminal costs of $131 million and $14 million, respectively, that were related to the sale of commissioning cargoes because these amounts were earned prior to the start of commercial operations, during the testing phase for the construction of those Trains of the SPL Project.
The following table (in millions) provides a summary of our capital resources from borrowings and available commitments for the Sabine Pass LNG Terminal, excluding equity contributions to our subsidiaries and cash flows from operations (as described in Sources and Uses of Cash), at March 31, 2017 and December 31, 2016:
|
| | | | | | | | |
| | March 31, | | December 31, |
| | 2017 | | 2016 |
Senior notes (1) | | $ | 13,650 |
| | $ | 11,500 |
|
Credit facilities outstanding balance (2) | | 2,560 |
| | 3,097 |
|
Letters of credit issued (3) | | 377 |
| | 324 |
|
Available commitments under credit facilities (3) | | 823 |
| | 2,295 |
|
Total capital resources from borrowings and available commitments (4) | | $ | 17,410 |
| | $ | 17,216 |
|
| |
(1) | Includes SPL’s 5.625% Senior Secured Notes due 2021, 6.25% Senior Secured Notes due 2022, 5.625% Senior Secured Notes due 2023, 5.75% Senior Secured Notes due 2024, 5.625% Senior Secured Notes due 2025, 5.875% Senior Secured Notes due 2026 (the “2026 SPL Senior Notes”), 5.00% Senior Secured Notes due 2027 (the “2027 SPL Senior Notes”), 2028 SPL Senior Notes and 2037 SPL Senior Notes (collectively, the “SPL Senior Notes”). |
| |
(2) | Includes 2015 SPL Credit Facilities, SPL Working Capital Facility and CTPL and SPLNG tranche term loans outstanding under the 2016 CQP Credit Facilities. |
| |
(3) | Includes 2015 SPL Credit Facilities and SPL Working Capital Facility. Does not include the letters of credit issued or available commitments under the 2016 CQP Credit Facilities, which are not specifically for the SPL Project. |
| |
(4) | Does not include Cheniere’s additional borrowings from 2021 Cheniere Convertible Unsecured Notes and the 2045 Cheniere Convertible Senior Notes, which may be used for the SPL Project. |
For additional information regarding our debt agreements related to the Sabine Pass LNG Terminal, see Note 10—Debt of our Notes to Consolidated Financial Statements in this quarterly report and Note 12—Debt of our Notes to Consolidated Financial Statements in our annual report on Form 10-K for the year ended December 31, 2016.
Senior Secured Notes
The SPL Senior Notes are secured on a pari passu first-priority basis by a security interest in all of the membership interests in SPL and substantially all of SPL’s assets.
At any time prior to three months before the respective dates of maturity for each series of the SPL Senior Notes (except for the 2026 SPL Senior Notes, 2027 SPL Senior Notes, 2028 SPL Senior Notes and 2037 SPL Senior Notes, in which case the time period is six months before the respective dates of maturity), SPL may redeem all or part of such series of the SPL Senior Notes at a redemption price equal to the “make-whole” price (except for the 2037 SPL Senior Notes, in which case the redemption price is equal to the “optional redemption” price) set forth in the respective indentures governing the SPL Senior Notes, plus accrued and unpaid interest, if any, to the date of redemption. SPL may also, at any time within three months of the respective maturity dates for each series of the SPL Senior Notes (except for the 2026 SPL Senior Notes, 2027 SPL Senior Notes, 2028 SPL Senior Notes and 2037 SPL Senior Notes, in which case the time period is within six months of the respective dates of maturity), redeem all or part of such series of the SPL Senior Notes at a redemption price equal to 100% of the principal amount of such series of the SPL Senior Notes to be redeemed, plus accrued and unpaid interest, if any, to the date of redemption.
Both the indenture governing the 2037 SPL Senior Notes (the “2037 SPL Senior Notes Indenture”) and the common indenture governing the remainder of the SPL Senior Notes (the “SPL Indenture”) include restrictive covenants. SPL may incur additional indebtedness in the future, including by issuing additional notes, and such indebtedness could be at higher interest rates and have different maturity dates and more restrictive covenants than the current outstanding indebtedness of SPL, including the SPL Senior Notes and the SPL Working Capital Facility. Under the 2037 SPL Senior Notes Indenture and the SPL Indenture, SPL may not make any distributions until, among other requirements, deposits are made into debt service reserve accounts as required and a debt service coverage ratio test of 1.25:1.00 is satisfied.
2015 SPL Credit Facilities
In June 2015, SPL entered into the 2015 SPL Credit Facilities with commitments aggregating $4.6 billion to fund a portion of the costs of developing, constructing and placing into operation Trains 1 through 5 of the SPL Project. In February 2017, SPL
issued the 2028 SPL Senior Notes and a portion of the net proceeds of the issuance was used to repay the then outstanding borrowings of $369 million under the 2015 SPL Credit Facilities. In March 2017, SPL issued the 2028 SPL Senior Notes and SPL terminated the remaining available balance of $1.6 billion under the 2015 SPL Credit Facilities.
SPL Working Capital Facility
In September 2015, SPL entered into the SPL Working Capital Facility, which is intended to be used for loans to SPL (“SPL Working Capital Loans”), the issuance of letters of credit on behalf of SPL, as well as for swing line loans to SPL (“SPL Swing Line Loans”), primarily for certain working capital requirements related to developing and placing into operation the SPL Project. SPL may, from time to time, request increases in the commitments under the SPL Working Capital Facility of up to $760 million and, upon the completion of the debt financing of Train 6 of the SPL Project, request an incremental increase in commitments of up to an additional $390 million. As of March 31, 2017 and December 31, 2016, SPL had $823 million and $653 million of available commitments, $377 million and $324 million aggregate amount of issued letters of credit and zero and $224 million of loans outstanding under the SPL Working Capital Facility, respectively.
The SPL Working Capital Facility matures on December 31, 2020, and the outstanding balance may be repaid, in whole or in part, at any time without premium or penalty upon three business days’ notice. Loans deemed made in connection with a draw upon a letter of credit have a term of up to one year. SPL Swing Line Loans terminate upon the earliest of (1) the maturity date or earlier termination of the SPL Working Capital Facility, (2) the date 15 days after such SPL Swing Line Loan is made and (3) the first borrowing date for a SPL Working Capital Loan or SPL Swing Line Loan occurring at least three business days following the date the SPL Swing Line Loan is made. SPL is required to reduce the aggregate outstanding principal amount of all SPL Working Capital Loans to zero for a period of five consecutive business days at least once each year.
The SPL Working Capital Facility contains conditions precedent for extensions of credit, as well as customary affirmative and negative covenants. The obligations of SPL under the SPL Working Capital Facility are secured by substantially all of the assets of SPL as well as all of the membership interests in SPL on a pari passu basis with the SPL Senior Notes.
Corpus Christi LNG Terminal
Liquefaction Facilities
The CCL Project is being developed and constructed at the Corpus Christi LNG terminal, on nearly 2,000 acres of land that we own or control near Corpus Christi, Texas. In December 2014, we received authorization from the FERC to site, construct and operate Stages 1 and 2 of the CCL Project. The following table summarizes the overall project status of Stage 1 of the CCL Project:
|
| | |
| CCL Stage 1 |
Overall project completion percentage | 59.1% |
Project completion percentage of: | |
Engineering | 100% |
Procurement | 78.6% |
Subcontract work | 28.9% |
Construction | 30.7% |
Expected date of substantial completion | Train 1 | 1H 2019 |
| Train 2 | 2H 2019 |
Through the CCL Stage III entities, which are separate from the CCH Group, we are developing two additional Trains and one LNG storage tank at the Corpus Christi LNG terminal adjacent to the CCL Project, along with a second natural gas pipeline, and we commenced the regulatory approval process in June 2015.
The following orders have been issued by the DOE authorizing the export of domestically produced LNG by vessel from the Corpus Christi LNG terminal:
| |
• | CCL Project—FTA countries for a 25-year term and to non-FTA countries for a 20-year term up to a combined total of the equivalent of 767 Bcf/yr (approximately 15 mtpa) of natural gas. A party to the proceeding requested a rehearing of the authorization to non-FTA countries, which was denied by the DOE in May 2016. In July 2016, the same party petitioned the U.S. Court of Appeals for the District of Columbia Circuit to review the authorization to non-FTA countries and the DOE order denying the request for rehearing of the same. The appeal is pending. |
| |
• | CCL Stage III entities—FTA countries for a 20-year term in an amount equivalent to 514 Bcf/yr (approximately 10 mtpa) of natural gas. The application for authorization to export that same 514 Bcf/yr of domestically produced LNG by vessel to non-FTA countries is currently pending before the DOE. |
In each case, the terms of these authorizations begin on the earlier of the date of first export thereunder or the date specified in the particular order, which ranges from 7 to 10 years from the date the order was issued.
Customers
CCL has entered into seven fixed price, 20-year SPAs with extension rights with six third parties to make available an aggregate amount of LNG that equates to approximately 7.7 mtpa of LNG, which is approximately 86% of the expected aggregate nominal production capacity of Trains 1 and 2. The obligation to make LNG available under these SPAs commences from the date of first commercial delivery for Trains 1 and 2, as specified in each SPA. In addition, CCL has entered into one fixed price, 20-year SPA with a third party for another 0.8 mtpa of LNG that commences with the date of first commercial delivery for Train 3. Under these eight SPAs, the customers will purchase LNG from CCL for a price consisting of a fixed fee of $3.50 per MMBtu of LNG (a portion of which is subject to annual adjustment for inflation) plus a variable fee equal to 115% of Henry Hub per MMBtu of LNG. In certain circumstances, the customers may elect to cancel or suspend deliveries of LNG cargoes, in which case the customers would still be required to pay the fixed fee with respect to the contracted volumes that are not delivered as a result of such cancellation or suspension. The SPAs and contracted volumes to be made available under the SPAs are not tied to a specific Train; however, the term of each SPA commences upon the start of operations of a specified Train.
In aggregate, the fixed fee portion to be paid by the third-party SPA customers is approximately $1.4 billion annually for Trains 1 and 2, and $1.5 billion if we make a positive FID with respect to Stage 2 of the CCL Project, with the applicable fixed fees starting from the date of first commercial delivery from the applicable Train. These fixed fees equal approximately $550 million, $846 million and $140 million for each of Trains 1 through 3, respectively.
Any LNG produced by CCL that is not required for other customers is sold by our integrated marketing function, in fulfilment of various sales commitments.
Natural Gas Transportation, Storage and Supply
To ensure CCL is able to transport adequate natural gas feedstock to the Corpus Christi LNG terminal, it has entered into transportation precedent agreements to secure firm pipeline transportation capacity with CCP and certain third-party pipeline companies. CCL has entered into a firm storage services agreement with a third party to assist in managing volatility in natural gas needs for the CCL Project. CCL has also entered into enabling agreements with third parties, and will continue to enter into such agreements, in order to secure natural gas feedstock for the CCL Project. We expect to enter into gas supply contracts under these enabling agreements as and when required for the CCL Project. Among other things, these agreements would allow CCL to enter into natural gas purchases as and when required for the CCL Project on a spot or forward basis tied to Henry Hub or other market indices.
Construction
CCL entered into separate lump sum turnkey contracts with Bechtel for the engineering, procurement and construction of Stages 1 and 2 of the CCL Project under which Bechtel charges a lump sum for all work performed and generally bears project cost risk unless certain specified events occur, in which case Bechtel may cause CCL to enter into a change order, or CCL agrees with Bechtel to a change order.
The total contract price of the EPC contract for Stage 1, which does not include the Corpus Christi Pipeline, is approximately $7.8 billion, reflecting amounts incurred under change orders through March 31, 2017. Total expected capital costs for Stage 1 are estimated to be between $9.0 billion and $10.0 billion before financing costs, and between $11.0 billion and $12.0 billion after financing costs including, in each case, estimated owner’s costs and contingencies.
Pipeline Facilities
In December 2014, the FERC issued a certificate of public convenience and necessity under Section 7(c) of the Natural Gas Act of 1938, as amended, authorizing CCP to construct and operate the Corpus Christi Pipeline. The Corpus Christi Pipeline
is designed to transport 2.25 Bcf/d of natural gas feedstock required by the CCL Project from the existing regional natural gas pipeline grid. The construction of the Corpus Christi Pipeline commenced in January 2017.
Final Investment Decision on Stage 2
We will contemplate making an FID to commence construction of Stage 2 of the CCL Project based upon, among other things, entering into acceptable commercial arrangements and obtaining adequate financing to construct the facility.
Capital Resources
We expect to finance the construction costs of the CCL Project from one or more of the following: project financing, operating cash flow from CCL and CCP and equity contributions to our subsidiaries. The following table (in millions) provides a summary of our capital resources from borrowings and available commitments for the CCL Project, excluding equity contributions to our subsidiaries, at March 31, 2017 and December 31, 2016:
|
| | | | | | | | |
| | March 31, | | December 31, |
| | 2017 | | 2016 |
Senior notes (1) | | $ | 2,750 |
| | $ | 2,750 |
|
11% Convertible Senior Secured Notes due 2025 | | 1,203 |
| | 1,171 |
|
Credit facilities outstanding balance (2) | | 2,929 |
| | 2,381 |
|
Letters of credit issued (2) | | 82 |
| | — |
|
Available commitments under credit facilities (2) | | 3,323 |
| | 3,953 |
|
Total capital resources from borrowings and available commitments (3) | | $ | 10,287 |
| | $ | 10,255 |
|
| |
(1) | Includes CCH’s 7.000% Senior Secured Notes due 2024 (the “2024 CCH Senior Notes”) and 5.875% Senior Secured Notes due 2025 (the “2025 CCH Senior Notes” and collectively with the 2024 CCH Senior Notes, the “CCH Senior Notes”). |
| |
(2) | Includes 2015 CCH Credit Facility and CCH Working Capital Facility. |
| |
(3) | Does not include Cheniere’s additional borrowings from 2021 Cheniere Convertible Unsecured Notes, 2045 Cheniere Convertible Senior Notes and Cheniere Revolving Credit Facility, which may be used for the CCL Project. |
For additional information regarding our debt agreements related to the CCL Project, see Note 10—Debt of our Notes to Consolidated Financial Statements.
2025 CCH HoldCo II Convertible Senior Notes
In May 2015, CCH HoldCo II issued $1.0 billion aggregate principal amount of 11% Convertible Senior Secured Notes due 2025 (the “2025 CCH HoldCo II Convertible Senior Notes”) on a private placement basis. The 2025 CCH HoldCo II Convertible Senior Notes are convertible at the option of CCH HoldCo II or the holders, provided that various conditions are met. CCH HoldCo II is restricted from making distributions to Cheniere under agreements governing its indebtedness generally until, among other requirements, Trains 1 and 2 of the CCL Project are in commercial operation and a historical debt service coverage ratio and a projected fixed debt service coverage ratio of 1.20:1.00 are achieved.
CCH Senior Notes
In May and December 2016, CCH issued aggregate principal amounts of $1.25 billion of the 2024 CCH Senior Notes and $1.5 billion of the 2025 CCH Senior Notes, respectively. The CCH Senior Notes are jointly and severally guaranteed by its subsidiaries, CCL, CCP and Corpus Christi Pipeline GP, LLC (“CCP GP”, and collectively with CCL and CCP, the “CCH Guarantors”).
The indenture governing the CCH Senior Notes (the “CCH Indenture”) contains customary terms and events of default and certain covenants that, among other things, limit CCH’s ability and the ability of CCH’s restricted subsidiaries to: incur additional indebtedness or issue preferred stock; make certain investments or pay dividends or distributions on membership interests or subordinated indebtedness or purchase, redeem or retire membership interests; sell or transfer assets, including membership or partnership interests of CCH’s restricted subsidiaries; restrict dividends or other payments by restricted subsidiaries to CCH or
any of CCH’s restricted subsidiaries; incur liens; enter into transactions with affiliates; dissolve, liquidate, consolidate, merge, sell or lease all or substantially all of the properties or assets of CCH and its restricted subsidiaries taken as a whole; or permit any CCH Guarantor to dissolve, liquidate, consolidate, merge, sell or lease all or substantially all of its properties and assets.
At any time prior to six months before the respective dates of maturity for each series of the CCH Senior Notes, CCH may redeem all or part of such series of the CCH Senior Notes at a redemption price equal to the “make-whole” price set forth in the CCH Indenture, plus accrued and unpaid interest, if any, to the date of redemption. CCH also may at any time within six months of the respective dates of maturity for each series of the CCH Senior Notes, redeem all or part of such series of the CCH Senior Notes, in whole or in part, at a redemption price equal to 100% of the principal amount of the CCH Senior Notes to be redeemed, plus accrued and unpaid interest, if any, to the date of redemption.
2015 CCH Credit Facility
In May 2015, CCH entered into the 2015 CCH Credit Facility. The obligations of CCH under the 2015 CCH Credit Facility are secured by a first priority lien on substantially all of the assets of CCH and its subsidiaries and by a pledge by CCH HoldCo I of its limited liability company interests in CCH. As of March 31, 2017 and December 31, 2016, CCH had $3.1 billion and $3.6 billion of available commitments and $2.9 billion and $2.4 billion of outstanding borrowings under the 2015 CCH Credit Facility, respectively.
The principal of the loans made under the 2015 CCH Credit Facility must be repaid in quarterly installments, commencing on the earlier of (1) the first quarterly payment date occurring more than three calendar months following project completion and (2) a set date determined by reference to the date under which a certain LNG buyer linked to Train 2 of the CCL Project is entitled to terminate its SPA for failure to achieve the date of first commercial delivery for that agreement. Scheduled repayments will be based upon a 19-year tailored amortization, commencing the first full quarter after the project completion and designed to achieve a minimum projected fixed debt service coverage ratio of 1.55:1.
Under the terms of the 2015 CCH Credit Facility, CCH is required to hedge not less than 65% of the variable interest rate exposure of its senior secured debt. CCH is restricted from making distributions under agreements governing its indebtedness generally until, among other requirements, the completion of the construction of Trains 1 and 2 of the CCL Project, funding of a debt service reserve account equal to six months of debt service and achieving a historical debt service coverage ratio and fixed projected debt service coverage ratio of at least 1.25:1.00.
CCH Working Capital Facility
In December 2016, CCH entered into the $350 million CCH Working Capital Facility, which is intended to be used for loans to CCH (“CCH Working Capital Loans”), the issuance of letters of credit on behalf of CCH, as well as for swing line loans to CCH (“CCH Swing Line Loans”) for certain working capital requirements related to developing and placing into operation the CCL Project. Loans under the CCH Working Capital Facility are guaranteed by the CCH Guarantors. CCH may, from time to time, request increases in the commitments under the CCH Working Capital Facility of up to the maximum allowed under the Common Terms Agreement that was entered in concurrently with the 2015 CCH Credit Facility. CCH did not have any amounts outstanding under the CCH Working Capital Facility as of both March 31, 2017 and December 31, 2016, and CCH had $82 million and zero aggregate amount of issued letters of credit as of March 31, 2017 and December 31, 2016, respectively.
The CCH Working Capital Facility matures on December 14, 2021, and CCH may prepay the CCH Working Capital Loans, CCH Swing Line Loans and loans made in connection with a draw upon any letter of credit (“CCH LC Loans”) at any time without premium or penalty upon three business days’ notice and may re-borrow at any time. CCH LC Loans have a term of up to one year. CCH Swing Line Loans terminate upon the earliest of (1) the maturity date or earlier termination of the CCH Working Capital Facility, (2) the date that is 15 days after such CCH Swing Line Loan is made and (3) the first borrowing date for a CCH Working Capital Loan or CCH Swing Line Loan occurring at least four business days following the date the CCH Swing Line Loan is made. CCH is required to reduce the aggregate outstanding principal amount of all CCH Working Capital Loans to zero for a period of five consecutive business days at least once each year.
The CCH Working Capital Facility contains conditions precedent for extensions of credit, as well as customary affirmative and negative covenants. The obligations of CCH under the CCH Working Capital Facility are secured by substantially all of the assets of CCH and the CCH Guarantors as well as all of the membership interests in CCH and each of the CCH Guarantors on a pari passu basis with the CCH Senior Notes and the 2015 CCH Credit Facility.
Marketing
We market and sell LNG produced by the SPL Project and the CCL Project through our integrated marketing function. We are developing a portfolio of long- and medium-term SPAs to transport and unload commercial LNG cargoes to locations worldwide, which is primarily sourced by LNG produced by the SPL Project and the CCL Project but supplemented by volume procured from other locations worldwide, as needed. As of March 31, 2017, we have sold approximately 487 million MMBtu of LNG to be delivered to counterparties between 2017 and 2023, with delivery obligations conditional in certain circumstances. The cargoes have been sold either on a Free on Board basis (delivered to the counterparty at the Sabine Pass LNG terminal) or a Delivered at Terminal (“DAT”) basis (delivered to the counterparty at their LNG receiving terminal). We have chartered LNG vessels to be utilized in DAT transactions. In addition, we have entered into a long-term agreement to sell LNG cargoes on a DAT basis. The agreement is conditioned upon the buyer achieving certain milestones, including reaching an FID related to certain projects and obtaining related financing.
Cheniere Marketing entered into uncommitted trade finance facilities for up to $470 million primarily to be used for the purchase and sale of LNG for ultimate resale in the course of its operations. The finance facilities are intended to be used for advances, guarantees or the issuance of letters of credit or standby letters of credit on behalf of Cheniere Marketing. As of March 31, 2017 and December 31, 2016, Cheniere Marketing had $24 million and $23 million in loans outstanding and $22 million and $12 million in standby letters of credit and guarantees outstanding under the finance facilities, respectively. Cheniere Marketing pays interest or fees on utilized commitments.
Corporate and Other Activities
We are required to maintain corporate and general and administrative functions to serve our business activities described above. We are also in various stages of developing other projects, including liquefaction projects and other infrastructure projects in support of natural gas supply and LNG demand, which, among other things, will require acceptable commercial and financing arrangements before we make an FID. We are exploring the development of a midscale liquefaction project using electric drive modular Trains, with an expected aggregate nominal production capacity of approximately 9.5 mtpa of LNG. Through Midship Pipeline, we have proposed the development of a pipeline with expected capacity of up to 1.4 Bcf/d connecting new gas production in the Anadarko Basin to Gulf Coast markets, including markets serving the SPL Project and the CCL Project, and completed the binding open season with commitments. We recently commenced the regulatory pre-filing process and expect to file formal applications for the required regulatory permits in 2017.
Sources and Uses of Cash
The following table (in millions) summarizes the sources and uses of our cash, cash equivalents and restricted cash for the three months ended March 31, 2017 and 2016. The table presents capital expenditures on a cash basis; therefore, these amounts differ from the amounts of capital expenditures, including accruals, which are referred to elsewhere in this report. Additional discussion of these items follows the table.
|
| | | | | | | |
| Three Months Ended March 31, |
| 2017 | | 2016 |
Operating cash flows | $ | 309 |
| | $ | (131 | ) |
Investing cash flows | (1,290 | ) | | (1,168 | ) |
Financing cash flows | 2,095 |
| | 1,423 |
|
| | | |
Net increase in cash, cash equivalents and restricted cash | 1,114 |
|
| 124 |
|
Cash, cash equivalents and restricted cash—beginning of period | 1,827 |
| | 1,736 |
|
Cash, cash equivalents and restricted cash—end of period | $ | 2,941 |
| | $ | 1,860 |
|
Operating Cash Flows
Our operating cash flows increased from outflows of $131 million during the three months ended March 31, 2016 to inflows of $309 million during the three months ended March 31, 2017. The $440 million increase in operating cash inflows in 2017 compared to 2016 was primarily related to increased cash receipts from the sale of LNG cargoes, partially offset by increased operating costs and expenses as a result of the commencement of operations of Trains 1, 2 and 3 of the SPL Project in May 2016, September 2016 and March 2017, respectively.
Investing Cash Flows
Investing cash outflows during the three months ended March 31, 2017 and 2016 were $1.3 billion and $1.2 billion, respectively, and are primarily used to fund the construction costs for Trains 1 through 5 of the SPL Project and Trains 1 and 2 of the CCL Project. These costs are capitalized as construction-in-process until achievement of substantial completion. In addition to cash outflows for construction costs for the SPL Project and the CCL Project, we received $36 million during the three months ended March 31, 2017 from the return of collateral payments previously paid for the CCL Project, which was offset by $7 million for investments in unconsolidated entities and other projects. During the three months ended March 31, 2016, we used $18 million primarily to pay municipal water districts for water system enhancements that will increase potable water supply to our export terminals and for investments made in unconsolidated entities.
Financing Cash Flows
Financing cash inflows during the three months ended March 31, 2017 were $2.1 billion, primarily as a result of:
| |
• | issuances of aggregate principal amounts of $800 million of the 2037 SPL Senior Notes and $1.35 billion of the 2028 SPL Senior Notes; |
| |
• | $55 million of borrowings and a $369 million repayment made under the 2015 SPL Credit Facilities; |
| |
• | $548 million of borrowings under the 2015 CCH Credit Facility; |
| |
• | $110 million of borrowings and $334 million of repayments made under the SPL Working Capital Facility; |
| |
• | $43 million of debt issuance and deferred financing costs related to up-front fees paid upon the closing of these transactions; |
| |
• | $20 million of distributions and dividends to non-controlling interest by Cheniere Partners and Cheniere Holdings; and |
| |
• | $1 million paid for tax withholdings for share-based compensation. |
Financing cash inflows during the three months ended March 31, 2016 were $1.4 billion, primarily as a result of:
| |
• | entering into the 2016 CQP Credit Facilities and borrowing $450 million to prepay the $400 million CTPL Term Loan; |
| |
• | $660 million of borrowings under the 2015 SPL Credit Facilities; |
| |
• | $125 million of borrowings and a $15 million repayment made under the SPL Working Capital Facility; |
| |
• | $673 million of borrowings under the 2015 CCH Credit Facility; |
| |
• | $49 million of debt issuance and deferred financing costs related to up-front fees paid upon the closing of these transactions; |
| |
• | $20 million of distributions and dividends to non-controlling interest by Cheniere Partners and Cheniere Holdings; and |
| |
• | $1 million paid for tax withholdings for share-based compensation. |
Results of Operations
The following table summarizes the volume of operational and commissioning LNG cargoes that were loaded from the SPL Project and recognized on our Consolidated Financial Statements during the three months ended March 31, 2017:
|
| | | | | | |
(in million MMBtu) | | Operational | | Commissioning |
Volume loaded during the current quarter | | 128 |
| | 26 |
|
Volume loaded during the prior quarter but recognized during the current quarter | | 19 |
| | — |
|
Less: volume loaded during the current quarter and in transit at the end of the quarter | | (7 | ) | | (8 | ) |
Total volume recognized in the current quarter | | 140 |
| | 18 |
|
Our consolidated net income attributable to common stockholders was $54 million, or $0.23 per share (basic and diluted), in the three months ended March 31, 2017, compared to a net loss attributable to common stockholders of $321 million, or $1.41 per share (basic and diluted), in the three months ended March 31, 2016. This $375 million increase in net income in 2017 was
primarily a result of increased income from operations and decreased derivative loss, net, which were partially offset by increased interest expense, net of amounts capitalized, and loss on early extinguishment of debt.
Revenues
|
| | | | | | | | | | | |
| Three Months Ended March 31, |
(in millions) | 2017 | | 2016 | | Change |
LNG revenues | $ | 1,143 |
| | $ | 3 |
| | $ | 1,140 |
|
Regasification revenues | 68 |
| | 65 |
| | 3 |
|
Other revenues | — |
| | 1 |
| | (1 | ) |
Total revenues | $ | 1,211 |
| | $ | 69 |
| | $ | 1,142 |
|
We began recognizing LNG revenues from the SPL Project following the substantial completion and the commencement of operating activities of Train 1 in May 2016. Trains 2 and 3 subsequently achieved substantial completion in September 2016 and March 2017, respectively. Prior to substantial completion of a Train, amounts received from the sale of commissioning cargoes from that Train are offset against LNG terminal construction-in-process because these amounts are earned during the testing phase for the construction of those Trains of the SPL Project. During the three months ended March 31, 2017 and 2016, we realized offsets to LNG terminal costs of $131 million and $14 million, respectively, that were related to the sale of commissioning cargoes. During the three months ended March 31, 2017, we recognized revenues related to the sale of 140 million MMBtu of LNG from the SPL Project, of which approximately 76 million MMBtu of LNG was sold to third-party SPA customers for revenues of $462 million and the remainder of the volume was sold by our integrated marketing function. Additionally, LNG revenues included revenues of $48 million for the three months ended March 31, 2017 for 4 million MMBtu that we procured from third parties, as well as derivative gains and losses related to commodity derivatives. As additional Trains become operational, we expect our LNG revenues to increase in the future.
Operating costs and expenses
|
| | | | | | | | | | | |
| Three Months Ended March 31, |
(in millions) | 2017 | | 2016 | | Change |
Cost of sales | $ | 624 |
| | $ | 15 |
| | $ | 609 |
|
Operating and maintenance expense | 78 |
| | 36 |
| | 42 |
|
Development expense | 3 |
| | 2 |
| | 1 |
|
Selling, general and administrative expense | 54 |
| | 66 |
| | (12 | ) |
Depreciation and amortization expense | 70 |
| | 24 |
| | 46 |
|
Restructuring expense | 6 |
| | 7 |
| | (1 | ) |
Impairment expense | — |
| | 10 |
| | (10 | ) |
Total operating costs and expenses | $ | 835 |
| | $ | 160 |
| | $ | 675 |
|
Our total operating costs and expenses increased $675 million during the three months ended March 31, 2017 compared to the three months ended March 31, 2016, primarily as a result of the commencement of operations of at the SPL Project in May 2016 upon the substantial completion of Train 1, followed by the substantial completion of Trains 2 and 3 in September 2016 and March 2017, respectively.
Cost of sales increased during the three months ended March 31, 2017 compared to the three months ended March 31, 2016 as a result of the commencement of operations at the SPL Project. Cost of sales includes costs incurred directly for the production and delivery of LNG from the SPL Project such as natural gas feedstock, variable transportation and storage costs, derivative gains and losses associated with economic hedges to secure natural gas feedstock for the SPL Project, and other related costs to convert natural gas into LNG, all to the extent not utilized for the commissioning process. Included in cost of sales during the three months ended March 31, 2017 and 2016 were vessel charter costs of $37 million and $9 million, respectively, which were incurred throughout the period, including the period prior to substantial completion of Trains 1 through 3 of the SPL Project.
Operating and maintenance expense increased during the three months ended March 31, 2017 as a result of the commencement of operations at the SPL Project. Operating and maintenance expense includes costs associated with operating and maintaining the SPL Project such as third-party service and maintenance contract costs, payroll and benefit costs of operations personnel, natural gas transportation and storage capacity demand charges, derivative gains and losses related to the sale and purchase of LNG associated with the regasification terminal, insurance and regulatory costs. Depreciation and amortization expense increased during the three months ended March 31, 2017 as we began depreciation of our assets related to Trains 1 through 3 of the SPL Project upon reaching substantial completion.
Partially offsetting the increases above was a decrease in selling, general and administrative expense, which was primarily due to the implementation of certain organizational changes to simplify our corporate structure, improve our operational efficiencies and implement a strategy for sustainable, long-term stockholder value creation through financially disciplined development, construction, operation and investment, and due to a reduction in professional services fees. Organizational initiatives have been completed as of March 31, 2017.
Impairment expense decreased during the three months ended March 31, 2017 compared to the three months ended March 31, 2016. The impairment expense recognized during the three months ended March 31, 2016 related to a corporate airplane that was written down to fair value based on market-based appraisals, which was ultimately sold by the end of the year. The impairment was recognized due to the potential disposition of the airplane in connection with the Company having initiated organizational changes and the associated focus for financially disciplined investment.
As additional Trains become operational, we expect our operating costs and expenses to increase in the future, including higher depreciation and amortization expense as the related assets begin to be depreciated upon reaching substantial completion.
Other expense (income)
|
| | | | | | | | | | | |
| Three Months Ended March 31, |
(in millions) | 2017 | | 2016 | | Change |
Interest expense, net of capitalized interest | $ | 165 |
| | $ | 76 |
| | $ | 89 |
|
Loss on early extinguishment of debt | 42 |
| | 1 |
| | 41 |
|
Derivative loss (gain), net | (1 | ) | | 181 |
| | (182 | ) |
Other income | (2 | ) | | (1 | ) | | (1 | ) |
Total other expense | $ | 204 |
| | $ | 257 |
| | $ | (53 | ) |
Interest expense, net of capitalized interest, increased $89 million in the three months ended March 31, 2017, as compared to the three months ended March 31, 2016, primarily as a result of an increase in our indebtedness outstanding (before premium, discount and unamortized debt issuance costs), from $18.8 billion as of March 31, 2016 to $24.8 billion as of March 31, 2017, and a decrease in the portion of total interest costs that could be capitalized as Trains 1 through 3 of the SPL Project were no longer in construction. For the three months ended March 31, 2017, we incurred $354 million of total interest cost, of which we capitalized $189 million which was directly related to the construction of the SPL Project and the CCL Project. For the three months ended March 31, 2016, we incurred $293 million of total interest cost, of which we capitalized $217 million which was directly related to the construction of the SPL Project and the CCL Project.
Loss on early extinguishment of debt increased $41 million in the three months ended March 31, 2017, as compared to the three months ended March 31, 2016. Loss on early extinguishment of debt recognized during the three months ended March 31, 2017 was attributable to the write-off of debt issuance costs upon termination of the remaining available balance of $1.6 billion under the 2015 SPL Credit Facilities in connection with the issuance of the 2028 SPL Senior Notes.
Derivative loss, net decreased $182 million from a $181 million net loss in the three months ended March 31, 2016 to a $1 million net gain in three months ended March 31, 2017. The net gain recognized during the three months ended March 31, 2017 was primarily due to a relative increase in the long-term forward LIBOR curve during the period, which was offset by a $7 million loss recognized upon the termination of interest rate swaps associated with approximately $1.6 billion of commitments that were terminated under the 2015 SPL Credit Facilities. The net loss recognized during the three months ended March 31, 2016 was due to a relative decrease in the long-term forward LIBOR curve during the period.
Other
|
| | | | | | | | | | | |
| Three Months Ended March 31, |
(in millions) | 2017 | | 2016 | | Change |
Income tax provision | $ | — |
| | $ | 1 |
| | $ | (1 | ) |
Net income (loss) attributable to non-controlling interest | 118 |
| | (28 | ) | | 146 |
|
Net income attributable to non-controlling interest increased $146 million in the three months ended March 31, 2017 as compared to the three months ended March 31, 2016, primarily due to the increase in consolidated net income recognized by Cheniere Partners in which the non-controlling interest is held. The consolidated net income recognized by Cheniere Partners increased from a net loss of $75 million in the three months ended March 31, 2016 to net income of $47 million in the three months ended March 31, 2017 primarily due to increased income from operations as a result of the commencement of operations at the SPL Project and decreased derivative loss, net, which were partially offset by increased interest expense, net of amounts capitalized
and increased loss on early extinguishment of debt. Additionally, net income attributable to non-controlling interest was reduced by approximately $84 million in amortization of the beneficial conversion feature on Cheniere Partners’ Class B units.
Off-Balance Sheet Arrangements
As of March 31, 2017, we had no transactions that met the definition of off-balance sheet arrangements that may have a current or future material effect on our consolidated financial position or operating results.
Summary of Critical Accounting Estimates
The preparation of our Consolidated Financial Statements in conformity with GAAP requires management to make certain estimates and assumptions that affect the amounts reported in the Consolidated Financial Statements and the accompanying notes. There have been no significant changes to our critical accounting estimates from those disclosed in our annual report on Form 10-K for the year ended December 31, 2016.
Recent Accounting Standards
| |
ITEM 3. | QUANTITATIVE AND QUALITATIVE DISCLOSURES ABOUT MARKET RISK |
Cash Investments
We have cash investments that we manage based on internal investment guidelines that emphasize liquidity and preservation of capital. Such cash investments are stated at historical cost, which approximates fair market value on our Consolidated Balance Sheets.
Marketing and Trading Commodity Price Risk
We have entered into commodity derivatives consisting of natural gas supply contracts to secure natural gas feedstock for the SPL Project (“Liquefaction Supply Derivatives”). We have also entered into financial derivatives to hedge the exposure to the commodity markets in which we have contractual arrangements to purchase or sell physical LNG (“LNG Trading Derivatives”). In order to test the sensitivity of the fair value of the Liquefaction Supply Derivatives and the LNG Trading Derivatives to changes in underlying commodity prices, management modeled a 10% change in the commodity price for natural gas for each delivery location and a 10% change in the commodity price for LNG, respectively, as follows (in millions):
|
| | | | | | | | | | | | | | | |
| March 31, 2017 | | December 31, 2016 |
| Fair Value | | Change in Fair Value | | Fair Value | | Change in Fair Value |
Liquefaction Supply Derivatives | $ | 39 |
| | $ | 2 |
| | $ | 73 |
| | $ | 6 |
|
LNG Trading Derivatives | (3 | ) | | 3 |
| | (3 | ) | | — |
|
Interest Rate Risk
SPL, CQP and CCH have entered into interest rate swaps to hedge the exposure to volatility in a portion of the floating-rate interest payments under the 2015 SPL Credit Facilities (“SPL Interest Rate Derivatives”), the 2016 CQP Credit Facilities (“CQP Interest Rate Derivatives”) and the 2015 CCH Credit Facility (“CCH Interest Rate Derivatives” and collectively, with the SPL Interest Rate Derivatives and the CQP Interest Rate Derivatives, the “Interest Rate Derivatives”), respectively. In order to test the sensitivity of the fair value of the Interest Rate Derivatives to changes in interest rates, management modeled a 10% change in the forward 1-month LIBOR curve across the remaining terms of the Interest Rate Derivatives as follows (in millions):
|
| | | | | | | | | | | | | | | |
| March 31, 2017 | | December 31, 2016 |
| Fair Value | | Change in Fair Value | | Fair Value | | Change in Fair Value |
SPL Interest Rate Derivatives | $ | — |
| | $ | — |
| | $ | (6 | ) | | $ | 2 |
|
CQP Interest Rate Derivatives | 16 |
| | 6 |
| | 13 |
| | 6 |
|
CCH Interest Rate Derivatives | (75 | ) | | 52 |
| | (86 | ) | | 52 |
|
Foreign Currency Exchange Risk
We have entered into foreign currency exchange (“FX”) contracts to hedge exposure to currency risk associated with operations in countries outside of the United States (“FX Derivatives”). In order to test the sensitivity of the fair value of the FX Derivatives to changes in FX rates, management modeled a 10% change in FX rate between the U.S. dollar and the applicable foreign currencies. This 10% change in FX rates would have resulted in an immaterial change in the fair value of the FX Derivatives as of both March 31, 2017 and December 31, 2016.
| |
ITEM 4. | CONTROLS AND PROCEDURES |
We maintain a set of disclosure controls and procedures that are designed to ensure that information required to be disclosed by us in the reports filed by us under the Exchange Act, is recorded, processed, summarized and reported within the time periods specified in the SEC’s rules and forms. As of the end of the period covered by this report, we evaluated, under the supervision and with the participation of our management, including our Chief Executive Officer and our Chief Financial Officer, the effectiveness of our disclosure controls and procedures pursuant to Rule 13a-15 of the Exchange Act. Based on that evaluation, our Chief Executive Officer and our Chief Financial Officer concluded that our disclosure controls and procedures are effective.
During the most recent fiscal quarter, there have been no changes in our internal control over financial reporting that have materially affected, or are reasonably likely to materially affect, our internal control over financial reporting.
PART II. OTHER INFORMATION
ITEM 1. LEGAL PROCEEDINGS
We may in the future be involved as a party to various legal proceedings, which are incidental to the ordinary course of business. We regularly analyze current information and, as necessary, provide accruals for probable liabilities on the eventual disposition of these matters. There have been no material changes to the legal proceedings disclosed in our annual report on Form 10-K for the year ended December 31, 2016.
There have been no material changes from the risk factors disclosed in our annual report on Form 10-K for the year ended December 31, 2016.
| |
ITEM 2. | UNREGISTERED SALES OF EQUITY SECURITIES AND USE OF PROCEEDS |
Purchase of Equity Securities by the Issuer and Affiliated Purchasers
The following table summarizes stock repurchases for the three months ended March 31, 2017: |
| | | | | | | | |
Period | | Total Number of Shares Purchased (1) | | Average Price Paid Per Share (2) | | Total Number of Shares Purchased as a Part of Publicly Announced Plans | | Maximum Number of Shares That May Yet Be Purchased Under the Plans |
January 1 - 31, 2017 | | 3,463 | | $41.59 | | — | | — |
February 1 - 28, 2017 | | 12,483 | | $47.17 | | — | | — |
March 1 - 31, 2017 | | — | | $— | | — | | — |
| |
(1) | Represents shares surrendered to us by participants in our share-based compensation plans to settle the participants’ personal tax liabilities that resulted from the lapsing of restrictions on shares awarded to the participants under these plans. |
| |
(2) | The price paid per share was based on the closing trading price of our common stock on the dates on which we repurchased shares from the participants under our share-based compensation plans. |
Sale of Unregistered Securities
On February 28, 2017, we issued 59,116 unregistered shares of our common stock to Pacific Capital Management, LLC in reliance upon the exemption from registration afforded by Section 4(a)(2) of the Securities Act of 1933, as amended, pursuant to a privately negotiated stock-for-stock exchange transaction in which we acquired 115,348 common shares representing limited liability company interests in Cheniere Holdings.
Compliance Disclosure
Pursuant to Section 13(r) of the Exchange Act, if during the quarter ended March 31, 2017, we or any of our affiliates had engaged in certain transactions with Iran or with persons or entities designated under certain executive orders, we would be required to disclose information regarding such transactions in our quarterly report on Form 10-Q as required under Section 219 of the Iran Threat Reduction and Syria Human Rights Act of 2012. During the quarter ended March 31, 2017, we did not engage in any transactions with Iran or with persons or entities related to Iran.
|
| | |
Exhibit No. | | Description |
4.1 | | Tenth Supplemental Indenture, dated as of March 6, 2017, between Sabine Pass Liquefaction, LLC and The Bank of New York Mellon, as Trustee under the Indenture (Incorporated by reference to Exhibit 4.1 to Cheniere Partners’ Current Report on Form 8-K (SEC File No. 001-33366), filed on March 6, 2017) |
4.2 | | Form of 4.200% Senior Secured Note due 2028 (Included as Exhibit A-1 to Exhibit 4.1 above) |
4.3 | | Indenture, dated as of February 24, 2017, between Sabine Pass Liquefaction, LLC, the guarantors that may become party thereto from time to time and The Bank of New York Mellon, as Trustee under the Indenture (Incorporated by reference to Exhibit 4.1 to Cheniere Partners’ Current Report on Form 8-K (SEC File No. 001-33366), filed on February 27, 2017) |
4.4 | | Form of 5.00% Senior Secured Note due 2037 (Included as Exhibit A-1 to Exhibit 4.3 above) |
10.1† | | Amended and Restated Cheniere Energy, Inc. Key Executive Severance Pay Plan (Incorporated by reference to Exhibit 10.1 to the Company’s Current Report on Form 8-K (SEC File No. 001-16383), filed on February 24, 2017) |
10.2*† | | Form of Restricted Stock Unit Award Agreement under the Cheniere Energy, Inc. 2011 Incentive Plan (UK) (Grades 18-20) |
10.3*† | | Form of Restricted Stock Unit Award Agreement under the Cheniere Energy, Inc. 2011 Incentive Plan (UK) (Grade 17) |
10.4*† | | Form of Restricted Stock Unit Award Agreement under the Cheniere Energy, Inc. 2011 Incentive Plan (UK) (Grade 16 and Below) |
10.5*† | | Form of Restricted Stock Unit Award Agreement under the Cheniere Energy, Inc. 2011 Incentive Plan (Singapore) (Grade 16 and Below) |
10.6*† | | Form of Restricted Stock Unit Award Agreement under the Cheniere Energy, Inc. 2011 Incentive Plan (Chile) (Grade 16 and Below) |
10.7*† | | Form of Performance Stock Unit Award Agreement under the Cheniere Energy, Inc. 2011 Incentive Plan (UK) (Grades 18-20) |
10.8*† | | Form of Performance Stock Unit Award Agreement under the Cheniere Energy, Inc. 2011 Incentive Plan (UK) (Grade 17) |
10.9*† | | Form of Performance Stock Unit Award Agreement under the Cheniere Energy, Inc. 2011 Incentive Plan (UK) (Grade 16 and Below) |
10.10 | | Second Omnibus Amendment and Waiver, dated as of January 20, 2017, to the Second Amended and Restated Common Terms Agreement, dated as of June 30, 2015, among Sabine Pass Liquefaction, LLC, as Borrower, the representatives and agents from time to time parties thereto, and Société Générale, as the Common Security Trustee and Intercreditor Agent (Incorporated by reference to Exhibit 10.73 to SPL’s Registration Statement on Form S-4 (SEC File No. 333-215882), filed on February 3, 2017) |
10.11 | | Amendment to the Common Terms Agreement, dated January 20, 2017, to the Second Amended and Restated Common Terms Agreement, dated as of June 30, 2015, among Sabine Pass Liquefaction, LLC, as Borrower, the representatives and agents from time to time parties thereto, and Société Générale, as the Common Security Trustee and Intercreditor Agent (Incorporated by reference to Exhibit 10.74 to SPL’s Registration Statement on Form S-4 (SEC File No. 333-215882), filed on February 3, 2017) |
10.12 | | Registration Rights Agreement, dated as of March 6, 2017, between Sabine Pass Liquefaction, LLC and Merrill Lynch, Pierce, Fenner & Smith Incorporated (Incorporated by reference to Exhibit 10.1 to Cheniere Partners’ Current Report on Form 8-K (SEC File No. 001-33366), filed on March 6, 2017) |
10.13 | | The Revolving Credit Agreement, dated as of March 2, 2017, among Cheniere Energy, Inc., the Lenders and Issuing Banks party thereto, Goldman Sachs Bank USA, Morgan Stanley Senior Funding, Inc. and SG Americas Securities, LLC, as Joint Lead Arrangers and Joint Bookrunners, and Société Générale, as Administrative Agent (Incorporated by reference to Exhibit 10.1 to the Company’s Current Report on Form 8-K (SEC File No. 001-16383), filed on March 8, 2017) |
10.14 | | Change order to the Lump Sum Turnkey Agreement for the Engineering, Procurement and Construction of the Sabine Pass LNG Liquefaction Facility, dated as of November 11, 2011, between Sabine Pass Liquefaction, LLC and Bechtel Oil, Gas and Chemicals, Inc.: the Change Order CO-00056 Performance and Attendance Bonus (PAB) Incentive Program Provisional Sum Closeout, dated February 28, 2017 (Portions of this exhibit have been omitted and filed separately with the SEC pursuant to a request for confidential treatment.) (Incorporated by reference to Exhibit 10.77 to Amendment No. 1 to SPL’s Registration Statement on Form S-4 (SEC File No. 333-215882), filed on March 31, 2017) |
|
| | |
Exhibit No. | | Description |
10.15 | | Change orders to the Lump Sum Turnkey Agreement for the Engineering, Procurement and Construction of the Sabine Pass LNG Stage 2 Liquefaction Facility, dated as of December 20, 2012, between Sabine Pass Liquefaction, LLC and Bechtel Oil, Gas and Chemicals, Inc.: (i) the Change Order CO-00033 Instrument Air Tie-In Point Location Change, dated January 25, 2017 and (ii) the Change Order CO-00034 Additional Owner Site Office Provisional Sum Closeout, dated January 25, 2017 (Incorporated by reference to Exhibit 10.76 to Amendment No. 1 to SPL’s Registration Statement on Form S-4 (SEC File No. 333-215882), filed on March 31, 2017) |
10.16 | | Change orders to the Fixed Price Separated Turnkey Agreement for the Engineering, Procurement and Construction of the Corpus Christi Stage 1 Liquefaction Facility, dated as of December 6, 2013, between Corpus Christi Liquefaction, LLC and Bechtel Oil, Gas and Chemicals, Inc.: (i) the Change Order CO-00021 Secondary Access Road, DMPA-1 Scope and Use, Credit for Material Disposal, Power Pole Relocation, dated June 29, 2016, (ii) the Change Order CO-00023 Differing Soil Conditions and Bed 24 Over-Excavation Due to Differing Soil Condition, dated June 29, 2016, (iii) the Change Order CO-00025 Priority 6 Roads Differing Soil Conditions and 102-J01 Over-Excavation due to Differing Soil Conditions, dated August 23, 2016, (iv) the Change Order CO-00027 Lines Traversing Laydown Area Access Road and Underground Utilities for Temporary Facilities, dated September 26, 2016, and (v) the Change Order CO-00032 Integrated Security System, dated February 3, 2017 (Portions of this exhibit have been omitted and filed separately with the SEC pursuant to a request for confidential treatment.) (Incorporated by reference to Exhibit 10.45 to Amendment No. 1 to CCH’s Registration Statement on Form S-4 (SEC File No. 333-215435), filed on March 8, 2017) |
10.17 | | Change order to the Fixed Price Separated Turnkey Agreement for the Engineering, Procurement and Construction of the Corpus Christi Stage 1 Liquefaction Facility, dated as of December 6, 2013, between Corpus Christi Liquefaction, LLC and Bechtel Oil, Gas and Chemicals, Inc.: the Change Order CO-00030, dated November 1, 2016 (Incorporated by reference to Exhibit 10.46 to Amendment No. 1 to CCH’s Registration Statement on Form S-4 (SEC File No. 333-215435), filed on March 8, 2017) |
10.18 | | Change order to the Fixed Price Separated Turnkey Agreement for the Engineering, Procurement and Construction of the Corpus Christi Stage 1 Liquefaction Facility, dated as of December 6, 2013, between Corpus Christi Liquefaction, LLC and Bechtel Oil, Gas and Chemicals, Inc.: the Change Order CO-00031, Flare System Modification Implementation, dated January 17, 2017 (Portions of this exhibit have been omitted and filed separately with the SEC pursuant to a request for confidential treatment.) (Incorporated by reference to Exhibit 10.48 to Amendment No. 2 to CCH’s Registration Statement on Form S-4 (SEC File No. 333-215435), filed on March 23, 2017) |
10.19 | | Change order to the Fixed Price Separated Turnkey Agreement for the Engineering, Procurement and Construction of the Corpus Christi Stage 1 Liquefaction Facility, dated as of December 6, 2013, between Corpus Christi Liquefaction, LLC and Bechtel Oil, Gas and Chemicals, Inc.: (i) the Change Order CO-00033 Marine Ground Flare, dated February 27, 2017 (Portions of this exhibit have been omitted and filed separately with the SEC pursuant to a request for confidential treatment.) (Incorporated by reference to Exhibit 10.4 to CCH’s Quarterly Report on Form 10-Q (SEC File No. 333-215435), filed on May 3, 2017) |
10.20 | | Amendment of LNG Sale and Purchase Agreement (FOB), dated January 12, 2017, between Sabine Pass Liquefaction, LLC (Seller) and Gas Natural Fenosa LNG GOM, Limited (assignee of Gas Natural Aprovisionamientos SDG S.A.) (Buyer) (Incorporated by reference to Exhibit 10.3 to SPL’s Registration Statement on Form S-4 (SEC File No. 333-215882), filed on February 3, 2017) |
10.21 | | Fourth Amended and Restated Agreement of Limited Partnership of Cheniere Energy Partners, L.P. (Incorporated by reference to Exhibit 3.1 to Cheniere Partners’ Current Report on Form 8-K (File No. 001-33366) filed on February 21, 2017) |
31.1* | | Certification by Chief Executive Officer required by Rule 13a-14(a) and 15d-14(a) under the Exchange Act |
31.2* | | Certification by Chief Financial Officer required by Rule 13a-14(a) and 15d-14(a) under the Exchange Act |
32.1** | | Certification by Chief Executive Officer pursuant to 18 U.S.C. Section 1350, as adopted pursuant to Section 906 of the Sarbanes-Oxley Act of 2002 |
32.2** | | Certification by Chief Financial Officer pursuant to 18 U.S.C. Section 1350, as adopted pursuant to Section 906 of the Sarbanes-Oxley Act of 2002 |
101.INS* | | XBRL Instance Document |
101.SCH* | | XBRL Taxonomy Extension Schema Document |
101.CAL* | | XBRL Taxonomy Extension Calculation Linkbase Document |
101.DEF* | | XBRL Taxonomy Extension Definition Linkbase Document |
101.LAB* | | XBRL Taxonomy Extension Labels Linkbase Document |
101.PRE* | | XBRL Taxonomy Extension Presentation Linkbase Document |
|
| |
* | Filed herewith. |
** | Furnished herewith. |
† | Management contract or compensatory plan or arrangement. |
Pursuant to the requirements of the Securities Exchange Act of 1934, the registrant has duly caused this report to be signed on its behalf by the undersigned, thereunto duly authorized.
|
| | | |
| | CHENIERE ENERGY, INC. |
| | | |
Date: | May 3, 2017 | By: | /s/ Michael J. Wortley |
| | | Michael J. Wortley |
| | | Executive Vice President and Chief Financial Officer |
| | | (on behalf of the registrant and
as principal financial officer) |
| | | |
Date: | May 3, 2017 | By: | /s/ Leonard Travis |
| | | Leonard Travis |
| | | Vice President and Chief Accounting Officer |
| | | (on behalf of the registrant and
as principal accounting officer) |