|
x
|
ANNUAL REPORT PURSUANT TO SECTION
13 OR 15(D) OF THE SECURITIES EXCHANGE ACT OF
1934
|
|
¨
|
TRANSITION
REPORT PURSUANT TO SECTION 13 OR 15(D) OF THE SECURITIES EXCHANGE ACT OF
1934
|
|
Delaware
|
95-4352386
|
|
(State
or other jurisdiction of incorporation or organization)
|
(I.R.S.
Employer Identification No.)
|
|
700
Milam Street, Suite 800
|
|
|
Houston,
Texas
|
77002
|
|
(Address
of principal executive offices)
|
(Zip
code)
|
|
Common
Stock, $ 0.003 par value
|
NYSE
Amex Equities
|
|
(Title
of Class)
|
(Name
of each exchange on which
registered)
|
|
Large accelerated filer ¨
|
Accelerated filer x
|
Non-accelerated filer ¨
|
Smaller reporting company ¨
|
|
(Do
not check if a smaller reporting company)
|
|||
|
|
•
|
statements
relating to the construction and operation of each of our proposed
liquefied natural gas (“LNG”) receiving terminals or our proposed natural
gas pipelines, or expansions or extensions thereof, including statements
concerning the completion or expansion thereof by certain dates or at all,
the costs related thereto and certain characteristics, including amounts
of regasification and storage capacity, the number of storage tanks and
docks, pipeline deliverability and the number of pipeline
interconnections, if any;
|
|
|
•
|
statements
that we expect to receive an order from the Federal Energy Regulatory
Commission (“FERC”) authorizing us to construct and operate proposed LNG
receiving terminals or proposed pipelines by certain dates, or at
all;
|
|
|
•
|
statements
regarding future levels of domestic natural gas production, supply or
consumption; future levels of LNG imports into North America; sales of
natural gas in North America; and the transportation, other infrastructure
or prices related to natural gas, LNG or other energy sources or
hydrocarbon products;
|
|
|
•
|
statements
regarding any financing or refinancing or recapitalization transactions or
arrangements, or ability to enter into such transactions, whether on the
part of Cheniere or at the project
level;
|
|
|
•
|
statements
regarding any terminal use agreement (“TUA”) or other commercial
arrangements presently contracted, optioned, marketed or potential
arrangements to be performed substantially in the future, including any
cash distributions and revenues anticipated to be received and the
anticipated timing thereof, and statements regarding the amounts of total
LNG regasification or storage capacity that are, or may become, subject to
TUAs or other contracts;
|
|
|
•
|
statements
regarding counterparties to our TUAs, construction contracts and other
contracts;
|
|
|
•
|
statements
regarding any business strategy, any business plans or any other plans,
forecasts, projections or objectives, including potential revenues and
capital expenditures, any or all of which are subject to
change;
|
|
|
•
|
statements
regarding legislative, governmental, regulatory, administrative or other
public body actions, requirements, permits, investigations, proceedings or
decisions;
|
|
|
•
|
statements
regarding our LNG and natural gas marketing activities;
and
|
|
|
•
|
any
other statements that relate to non-historical or future
information.
|
|
|
•
|
Bcf means billion cubic
feet;
|
|
|
•
|
Bcf/d means billion
cubic feet per day;
|
|
|
•
|
EPC means engineering,
procurement and construction;
|
|
|
•
|
EPCM means engineering,
procurement, construction and
management;
|
|
|
•
|
LNG means liquefied
natural gas;
|
|
|
•
|
MMcf/d means million
cubic feet per day;
|
|
|
•
|
MMBtu means million
British thermal units; and
|
|
|
•
|
TUA means terminal use
agreement.
|
|
|
•
|
LNG
receiving terminal business;
|
|
|
•
|
natural
gas pipeline business; and
|
|
|
•
|
LNG
and natural gas marketing business.
|
|
|
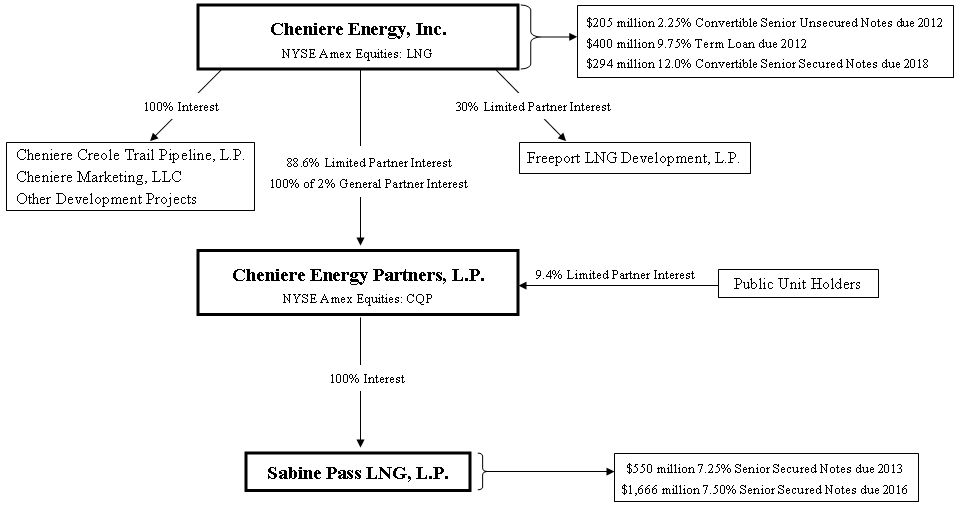
•
|
Total
Gas and Power North America, Inc. (formally known as Total LNG USA, Inc.)
(“Total”) has reserved approximately 1.0 Bcf/d of regasification capacity
and has agreed to make monthly capacity payments to Sabine Pass LNG
aggregating approximately $125 million per year for 20 years that
commenced April 1, 2009. Total, S.A. has guaranteed Total’s
obligations under its TUA up to $2.5 billion, subject to certain
exceptions; and
|
|
|
•
|
Chevron
U.S.A., Inc. (“Chevron”) has reserved approximately 1.0 Bcf/d of
regasification capacity and has agreed to make monthly capacity payments
to Sabine Pass LNG aggregating approximately $125 million per year for 20
years that commenced July 1, 2009. Chevron Corporation has guaranteed
Chevron’s obligations under its TUA up to 80% of the fees payable by
Chevron.
|
|
|
•
|
existing
producing regions in the United States, Canada and
Mexico;
|
|
|
•
|
frontier
regions in Alaska, northern Canada and offshore
deepwater;
|
|
|
•
|
areas
currently restricted from exploration and development due to public
policies, such as areas in the Rocky Mountains and offshore Atlantic,
Pacific and Gulf of Mexico coasts;
and
|
|
|
•
|
imported
LNG.
|
|
|
•
|
rates
and charges for natural gas transportation and related
services;
|
|
|
•
|
the
certification and construction of new
facilities;
|
|
|
•
|
the
extension and abandonment of services and
facilities;
|
|
|
•
|
the
maintenance of accounts and
records;
|
|
|
•
|
the
acquisition and disposition of
facilities;
|
|
|
•
|
the
initiation and discontinuation of services;
and
|
|
|
•
|
various
other matters.
|
|
|
•
|
large,
multinational and national companies with longer operating histories, more
development experience, greater name recognition, larger staffs and
substantially greater financial, technical and marketing
resources;
|
|
|
•
|
oil
and gas producers who sell or control LNG derived from their international
oil and gas properties; and
|
|
|
•
|
purchasers
located in other countries, in which prevailing market prices can be
substantially different than those in the
U.S.
|
|
|
•
|
major
integrated marketers who have large amounts of capital to support their
marketing operations and offer a full-range of services and market
numerous products other than natural
gas;
|
|
|
•
|
producer
marketers who sell their own natural gas production or the production of
their affiliated natural gas production
company;
|
|
|
•
|
small
geographically focused marketers who focus on marketing natural gas for
the geographic area in which their affiliated distributor operates;
and
|
|
|
•
|
aggregators
who gather small volumes of natural gas from various sources, combine them
and sell the larger volumes for more favorable prices and terms than would
be possible selling the smaller volumes
separately.
|
|
|
•
|
Risks
Relating to Our Financial Matters;
|
|
|
•
|
Risks
Relating to Our LNG Receiving Terminal
Business;
|
|
|
•
|
Risks
Relating to Our Natural Gas Pipeline
Business;
|
|
|
•
|
Risks
Relating to Our LNG and Natural Gas Marketing
Business;
|
|
|
•
|
Risks
Relating to Our LNG Businesses in General;
and
|
|
|
•
|
Risks
Relating to Our Business in
General.
|
|
|
•
|
borrowings,
debt issuances, or extensions of debt maturities may subject us to certain
restrictive covenants, including covenants restricting our ability to
raise additional capital or cross-defaults to our other
indebtedness;
|
|
|
•
|
borrowings
or debt issuances at the project level may subject the project entity to
restrictive covenants, including covenants restricting its ability to make
distributions to us or limiting our ability to sell our interests in such
entity;
|
|
|
•
|
offerings
of our equity securities could cause substantial dilution for holders of
our common stock and Series B Preferred
Stock;
|
|
|
•
|
additional
sales of interests in our projects would reduce our interest in future
revenues; and
|
|
|
•
|
the
prepayment of terminal use fees by, or a business development loan from,
prospective customers would reduce future revenues once an LNG receiving
terminal commence operations.
|
|
|
•
|
limiting
our ability to attract customers;
|
|
|
•
|
limiting
our ability to compete with other companies that are not as highly
leveraged;
|
|
|
•
|
limiting
our flexibility in and ability to plan for or react to changing market
conditions in our industry and to economic downturns, and making us more
vulnerable than our less leveraged competitors to an industry or economic
downturn;
|
|
|
•
|
limiting
our ability to use operating cash flow in other areas of our business
because we must dedicate a substantial portion of these funds to service
debt, including indebtedness that we may incur in the
future;
|
|
|
•
|
limiting
our ability to obtain additional financing to fund our capital
expenditures, working capital, acquisitions, debt service requirements or
liquidity needs for general business or other purposes;
and
|
|
|
•
|
resulting
in a material adverse effect on our business, results of operations and
financial condition if we are unable to service or refinance our
indebtedness or obtain additional financing, as
needed.
|
|
|
•
|
performing
below expected levels of
efficiency;
|
|
|
•
|
breakdown
or failures of equipment or
systems;
|
|
|
•
|
operational
errors by vessel or tug operators or
others;
|
|
|
•
|
operational
errors by us or any contracted facility operator or
others;
|
|
|
•
|
labor
disputes; and
|
|
|
•
|
weather-related
interruptions of operations.
|
|
|
•
|
we
may be unable to enter into contracts for the purchase of the LNG, and may
be unable to obtain vessels to deliver such LNG, on terms reasonably
acceptable to us or at all;
|
|
|
•
|
we
may bear the commodity price risk associated with purchasing the LNG,
holding it in inventory for a period of time and selling the regasified
LNG; and
|
|
|
•
|
we
may be unable to obtain financing for the purchase and shipment of the LNG
on terms that are reasonably acceptable to us or at
all.
|
|
|
•
|
perform
ongoing assessments of pipeline
integrity;
|
|
|
•
|
identify
and characterize applicable threats to pipeline segments that could impact
a high consequence area;
|
|
|
•
|
improve
data collection, integration and
analysis;
|
|
|
•
|
repair
and remediate the pipeline as necessary;
and
|
|
|
•
|
implement
preventive and mitigating actions.
|
|
|
•
|
Cheniere
Marketing does not have unconditional agreements or arrangements for any
supplies of LNG, or for the utilization of capacity that it has contracted
for under its TUA with us and may not be able to obtain such agreements or
arrangements on economical terms, or at
all;
|
|
|
•
|
Cheniere
Marketing does not have unconditional commitments from customers for the
purchase of the natural gas it proposes to sell from our LNG receiving
terminal, and it may not be able to obtain commitments or other
arrangements on economical terms, or at
all;
|
|
|
•
|
in
order to arrange for supplies of LNG, and for transportation, storage and
sales of natural gas, Cheniere Marketing will require significant credit
support and funding, which we may not be able to obtain on terms that are
acceptable to us, or at all; and
|
|
|
•
|
even
if Cheniere Marketing is able to arrange for and finance supplies and
transportation of LNG to the Sabine Pass LNG receiving terminal, and for
transportation, storage and sales of natural gas to customers, it may
experience negative cash flows and adverse liquidity effects due to
fluctuations in supply, demand and price for LNG, for transportation of
LNG, for natural gas and for storage and transportation of natural
gas.
|
|
|
•
|
expected
supply is less than the amount
hedged;
|
|
|
•
|
the
counterparty to the hedging contract defaults on its contractual
obligations; or
|
|
|
•
|
there
is a change in the expected differential between the underlying price in
the hedging agreement and actual prices
received.
|
|
|
•
|
relatively
minor changes in the supply of, and demand for, natural gas in relevant
markets;
|
|
|
•
|
political
conditions in international natural gas producing
regions;
|
|
|
•
|
the
extent of domestic production and importation of natural gas in relevant
markets;
|
|
|
•
|
the
level of demand for LNG and natural gas in relevant markets, including the
effects of economic downturns or
upturns;
|
|
|
•
|
weather
conditions;
|
|
|
•
|
the
competitive position of natural gas as a source of energy compared with
other energy sources; and
|
|
|
•
|
the
effect of government regulation on the production, transportation and sale
of natural gas.
|
|
|
•
|
additions
to competitive regasification capacity in North America, Europe, Asia and
other markets, which could divert LNG from our existing and proposed LNG
receiving terminals;
|
|
|
•
|
insufficient
LNG liquefaction capacity
worldwide;
|
|
|
•
|
insufficient
LNG tanker capacity;
|
|
|
•
|
reduced
demand and lower prices for natural
gas;
|
|
|
•
|
increased
natural gas production deliverable by pipelines, which could suppress
demand for LNG;
|
|
|
•
|
cost
improvements that allow competitors to offer LNG regasification services
at reduced prices;
|
|
|
•
|
changes
in supplies of, and prices for, alternative energy sources such as coal,
oil, nuclear, hydroelectric, wind and solar energy, which may reduce the
demand for natural gas;
|
|
|
•
|
changes
in regulatory, tax or other governmental policies regarding imported LNG,
natural gas or alternative energy sources, which may reduce the demand for
imported LNG and/or natural gas;
|
|
|
•
|
adverse
relative demand for LNG in North America compared to other markets, which
may decrease LNG imports into North America;
and
|
|
|
•
|
cyclical
trends in general business and economic conditions that cause changes in
the demand for natural gas.
|
|
|
•
|
increased
construction costs;
|
|
|
•
|
economic
downturns, increases in interest rates or other events that may affect the
availability of sufficient financing for LNG projects on commercially
reasonable terms;
|
|
|
•
|
decreases
in the price of LNG and natural gas, which might decrease the expected
returns relating to investments in LNG
projects;
|
|
|
•
|
the
inability of project owners or operators to obtain governmental approvals
to construct or operate LNG
facilities;
|
|
|
•
|
political
unrest in exporting countries or local community resistance in such
countries to the siting of LNG facilities due to safety, environmental or
security concerns; and
|
|
|
•
|
any
significant explosion, spill or similar incident involving an LNG
liquefaction facility or LNG
carrier.
|
|
|
•
|
an
inadequate number of shipyards constructing LNG vessels and a backlog of
orders at these shipyards;
|
|
|
•
|
political
or economic disturbances in the countries where the vessels are being
constructed;
|
|
|
•
|
changes
in governmental regulations or maritime self-regulatory
organizations;
|
|
|
•
|
work
stoppages or other labor disturbances at the
shipyards;
|
|
|
•
|
bankruptcy
or other financial crisis of
shipbuilders;
|
|
|
•
|
quality
or engineering problems;
|
|
|
•
|
weather
interference or a catastrophic event, such as a major earthquake, tsunami
or fire; and
|
|
|
•
|
shortages
of or delays in the receipt of necessary construction
materials.
|
|
|
•
|
currency
fluctuations;
|
|
|
•
|
war;
|
|
|
•
|
expropriation
or nationalization of assets;
|
|
|
•
|
renegotiation
or nullification of existing
contracts;
|
|
|
•
|
changing
political conditions;
|
|
|
•
|
changing
laws and policies affecting trade, taxation and
investment;
|
|
|
•
|
multiple
taxation due to different tax structures;
and
|
|
|
•
|
the
general hazards associated with the assertion of sovereignty over certain
areas in which operations are
conducted.
|
|
High
|
Low
|
|||||||
|
Three
Months Ended
|
||||||||
|
March
31, 2008
|
$ | 32.68 | $ | 19.80 | ||||
|
June
30, 2008
|
20.66 | 4.37 | ||||||
|
September
30, 2008
|
4.98 | 2.13 | ||||||
|
December
31, 2008
|
4.47 | 0.95 | ||||||
|
Three
Months Ended
|
||||||||
|
March
31, 2009
|
$ | 4.98 | $ | 3.01 | ||||
|
June
30, 2009
|
5.19 | 2.71 | ||||||
|
September
30, 2009
|
3.47 | 2.50 | ||||||
|
December
31, 2009
|
2.95 | 1.80 | ||||||
|
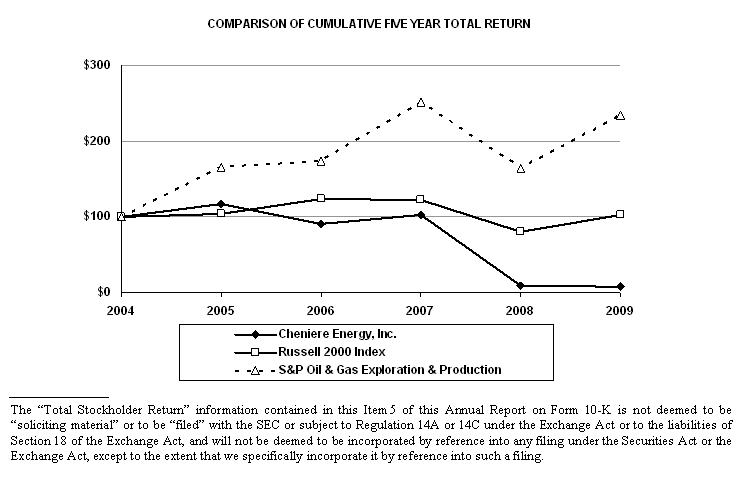
Company
/ Index
|
2005
|
2006
|
2007
|
2008
|
2009
|
|||||||||||||||
|
Cheniere
Energy, Inc.
|
$ | 117 | $ | 91 | $ | 102 | $ | 9 | $ | 8 | ||||||||||
|
Russell
2000 Index
|
$ | 105 | $ | 124 | $ | 122 | $ | 81 | $ | 103 | ||||||||||
|
S&P
Oil & Gas Exploration & Production
|
$ | 166 | $ | 174 | $ | 252 | $ | 165 | $ | 234 | ||||||||||
|
Year
Ended December 31,
|
||||||||||||||||||||
|
(in
thousands, except per share data)
|
||||||||||||||||||||
|
2009
|
2008
|
2007
|
2006
|
2005(6)
|
||||||||||||||||
|
(as
adjusted)
|
(as
adjusted)
|
(as
adjusted)
|
(as
adjusted)
|
|||||||||||||||||
|
Revenues
|
$ | 181,126 | $ | 7,144 | $ | 647 | $ | 2,371 | $ | 3,005 | ||||||||||
|
LNG
terminal and pipeline development expenses
|
223 | 10,556 | 34,656 | 12,099 | 22,020 | |||||||||||||||
|
LNG
terminal and pipeline operating expenses
|
36,857 | 14,522 | — | — | — | |||||||||||||||
|
Exploration
costs
|
— | 128 | 1,116 | 3,138 | 2,839 | |||||||||||||||
|
Depreciation,
depletion and amortization
|
54,229 | 24,346 | 6,393 | 3,131 | 1,325 | |||||||||||||||
|
General
and administrative expenses (1)
|
65,830 | 122,678 | 122,046 | 58,012 | 29,145 | |||||||||||||||
|
Restructuring
charges (2)
|
20 | 78,704 | — | — | — | |||||||||||||||
|
Income
(loss) from operations
|
23,496 | (244,188 | ) | (163,940 | ) | (75,874 | ) | (52,561 | ) | |||||||||||
|
Loss
from equity method investments
|
— | (4,800 | ) | (191 | ) | — | (1,031 | ) | ||||||||||||
|
Gain
on sale of investment in unconsolidated affiliate (3)
|
— | — | — | — | 20,206 | |||||||||||||||
|
Gain
(loss) on early extinguishment of debt (4)
|
45,363 | (10,691 | ) | — | (43,159 | ) | — | |||||||||||||
|
Derivative
gain (loss) (5)
|
5,277 | 4,652 | — | (20,070 | ) | 837 | ||||||||||||||
|
Interest
expense, net
|
(243,295 | ) | (147,136 | ) | (119,360 | ) | (67,252 | ) | (22,490 | ) | ||||||||||
|
Interest
income
|
1,405 | 20,337 | 82,635 | 49,087 | 17,520 | |||||||||||||||
|
Non-controlling
interest
|
6,165 | 8,777 | 3,425 | — | 97 | |||||||||||||||
|
Net
loss
|
(161,490 | ) | (372,959 | ) | (196,580 | ) | (159,137 | ) | (34,655 | ) | ||||||||||
|
Net
loss per share (basic and diluted) (6)
|
$ | (3.13 | ) | $ | (7.87 | ) | $ | (3.89 | ) | $ | (2.92 | ) | $ | (0.65 | ) | |||||
|
Weighted
average shares outstanding (basic and diluted) (6)
|
51,598 | 47,365 | 50,537 | 54,423 | 53,097 | |||||||||||||||
|
December
31,
|
||||||||||||||||||||
|
2009
|
2008
|
2007
|
2006
|
2005(6)
|
||||||||||||||||
|
(as
adjusted)
|
(as
adjusted)
|
(as
adjusted)
|
(as
adjusted)
|
|||||||||||||||||
|
Cash
and cash equivalents
|
$ | 88,372 | $ | 102,192 | $ | 296,530 | $ | 462,963 | $ | 692,592 | ||||||||||
|
Restricted
cash and cash equivalents (current)
|
138,309 | 301,550 | 228,085 | 176,827 | 161,561 | |||||||||||||||
|
Working
capital
|
220,063 | 350,459 | 427,511 | 588,034 | 810,141 | |||||||||||||||
|
Non-current
restricted cash and cash equivalents
|
82,892 | 138,483 | 478,225 | 1,071,722 | 16,500 | |||||||||||||||
|
Non-current
restricted U.S. Treasury securities
|
— | 20,829 | 63,923 | — | — | |||||||||||||||
|
Property,
plant and equipment, net
|
2,216,855 | 2,170,158 | 1,645,112 | 748,818 | 280,106 | |||||||||||||||
|
Debt
issuances costs, net
|
47,043 | 55,688 | 41,449 | 38,422 | 39,317 | |||||||||||||||
|
Goodwill
|
76,819 | 76,844 | 76,844 | 76,844 | 76,844 | |||||||||||||||
|
Total
assets
|
2,732,622 | 2,920,082 | 2,959,743 | 2,601,365 | 1,286,456 | |||||||||||||||
|
Long-term
debt, net of discount
|
2,692,740 | 2,750,308 | 2,657,579 | 2,242,209 | 788,857 | |||||||||||||||
|
Long-term
debt—related parties, net of discount
|
349,135 | 332,054 | — | — | — | |||||||||||||||
|
Long-term
deferred revenue
|
33,500 | 37,500 | 40,000 | 41,000 | 41,000 | |||||||||||||||
|
Total
liabilities
|
3,164,749 | 3,194,136 | 2,879,317 | 2,346,450 | 892,963 | |||||||||||||||
|
Total
stockholders’ equity (deficit)
|
$ | (649,732 | ) | $ | (524,216 | ) | $ | (205,249 | ) | $ | 254,915 | $ | 393,493 | |||||||
|
(1)
|
General
and administrative expenses include $19.2 million, $55.0 million, $56.6
million, $20.2 million and $3.6 million share-based compensation expense
recognized in the years ended December 31, 2009, 2008, 2007, 2006 and
2005, respectively.
|
|
(2)
|
In
the second quarter of 2008, we announced a cost savings program in
connection with the downsizing of our natural gas marketing business
activities, the nearing completion of significant construction activities
for both the Sabine Pass LNG receiving terminal and Creole Trail Pipeline
and the seeking of alternative arrangements for our time charter interest
in two LNG vessels (See Note 4—“Restructuring Charges”) of our Notes to
Consolidated Financial Statements).
|
|
(3)
|
In
2005, our investment in Gryphon Exploration Company was sold to Woodside
Energy (USA), generating net cash proceeds and a gain to Cheniere of $20.2
million.
|
|
(4)
|
Amount
in 2009 relates to gains on the termination of $120.4 million of our
Convertible Senior Unsecured Notes. Amount in 2008 relates to
losses on the termination of the $95.0 million bridge loan in August 2008.
Amounts in 2006 primarily relate to losses on the termination of a Sabine
Pass LNG credit facility and term loan in November 2006. See Note
19—“Long-Term Debt and Long-Term Debt—Related Parties” of our Notes to
Consolidated Financial Statements.
|
|
(5)
|
Amounts
in 2006 primarily relate to losses on the termination of hedge
transactions related to the termination of a Sabine Pass LNG credit
facility and term loan in November
2006.
|
|
(6)
|
Net
loss per share and weighted average shares outstanding have been restated
to reflect a two-for-one stock split that occurred on April 22,
2005.
|
|
(7)
|
Amounts
reported for the years ended December 31, 2005 have been adjusted to
reflect the change in our method of accounting for investments in oil and
gas properties from the full cost method to the successful efforts
method.
|
|
|
|
|
|
•
|
Overview
of Business
|
|
|
•
|
Overview
of Significant 2009 Events
|
|
|
•
|
Liquidity
and Capital Resources
|
|
|
•
|
Contractual
Obligations
|
|
|
•
|
Results
of Operations
|
|
|
•
|
Off-Balance
Sheet Arrangements
|
|
|
•
|
Inflation
and Changing Prices
|
|
|
•
|
Summary
of Critical Accounting Policies and
Estimates
|
|
|
•
|
Recent
Accounting Standards
|
|
|
•
|
we
completed construction and achieved full operability of the Sabine Pass
LNG receiving terminal with approximately 4.0 Bcf/d of total sendout
capacity and five LNG storage tanks with approximately 16.9 Bcf of
aggregate storage capacity;
|
|
|
•
|
Sabine
Pass LNG received capacity reservation fee payments from Cheniere
Marketing, our wholly owned subsidiary, Total and Chevron and successfully
unloaded and processed LNG for each
customer;
|
|
|
•
|
Cheniere
Marketing successfully purchased, transported and unloaded commercial LNG
cargos into the Sabine Pass LNG receiving terminal and sold resultant
natural gas;
|
|
|
•
|
we
reduced debt by exchanging $120.4 million aggregate principal amount of
our 2¼% Convertible Senior Unsecured Notes due 2012 (“Convertible Senior
Unsecured Notes”) for a combination of $30.0 million cash and cash
equivalents and 4.0 million shares of our common stock, reducing our
principal amount due in 2012 to $204.6 million, at December 31, 2009;
and
|
|
|
•
|
we
began receiving limited partner distributions from Freeport
LNG.
|
|
(in
thousands)
|
Sabine
Pass
LNG, L.P.
|
Cheniere
Energy
Partners,
L.P.
|
Other
Cheniere Energy, Inc.
|
Consolidated
Cheniere Energy,
Inc.
|
||||||||||||
|
Cash
and cash equivalents
|
$
|
—
|
$
|
—
|
$
|
88,372
|
$
|
88,372
|
||||||||
|
Restricted
cash and cash equivalents
|
213,537
|
130
|
7,534
|
221,201
|
||||||||||||
|
Total
|
$
|
213,537
|
$
|
130
|
$
|
95,906
|
$
|
309,573
|
||||||||
|
|
•
|
Total
Gas and Power North America, Inc. (formerly known as Total LNG USA, Inc.)
(“Total”) has reserved approximately 1.0 Bcf/d of regasification capacity
and has agreed to make monthly capacity payments to Sabine Pass LNG
aggregating approximately $125 million per year for 20 years that
commenced April 1, 2009. Total, S.A. has guaranteed Total’s
obligations under its TUA up to $2.5 billion, subject to certain
exceptions; and
|
|
|
•
|
Chevron
U.S.A., Inc. (“Chevron”) has reserved approximately 1.0 Bcf/d of
regasification capacity and has agreed to make monthly capacity payments
to Sabine Pass LNG aggregating approximately $125 million per year for 20
years that commenced July 1, 2009. Chevron Corporation has guaranteed
Chevron’s obligations under its TUA up to 80% of the fees payable by
Chevron.
|
|
For
the Year Ended December 31, 2009
|
||||||||||
|
LNG
and natural gas marketing revenue
(GAAP
measure)
|
Adjusted
LNG and natural gas marketing revenue
(Non-GAAP
measure)
|
Difference
|
||||||||
|
Physical
natural gas sales
|
$
|
6,146
|
$
|
6,146
|
$
|
—
|
||||
|
Cost
of LNG
|
(3,850
|
)
|
(38,218
|
)
|
34,368
|
(a)
|
||||
|
Realized
natural gas derivative gain
|
9,635
|
9,635
|
—
|
|||||||
|
Unrealized
gas derivative loss
|
(1,029
|
)
|
(1,029
|
)
|
—
|
|||||
|
Inventory
lower-of-cost-or-market adjustments
|
(3,323
|
)
|
—
|
(3,323
|
)
|
(b)
|
||||
|
Future
inventory value
|
—
|
41,261
|
(41,261
|
)
|
(c)
|
|||||
|
Other
energy trading activities
|
508
|
722
|
(214
|
)
|
||||||
|
LNG
and natural gas revenue
|
$
|
8,087
|
$
|
18,517
|
$
|
(10,430
|
)
|
|||
|
(a)
|
The
cost of LNG GAAP measure takes into consideration only the cost of LNG
that was regasified and sold during the year ended December 31, 2009,
using the weighed average cost method for LNG inventory. The
cost of LNG non-GAAP measure takes into consideration the cost for all of
the LNG purchased during the year ended December 31,
2009.
|
|
(b)
|
The
inventory LCM adjustments GAAP measure represents the inventory
write-downs that were recorded during the year ended December 31, 2009, as
required by GAAP codification.
|
|
(c)
|
The
future inventory value non-GAAP measure represents the inventory fair
value at December 31, 2009, based on published forward natural gas price
curve prices corresponding to the future months when the regasified LNG is
planned to be sold.
|
|
2009
|
2008
|
2007
|
||||||||||
|
Sources
of cash and cash equivalents
|
(as
adjusted)
|
(as
adjusted)
|
||||||||||
|
Use
of restricted cash and cash equivalents
|
$ | 241,101 | $ | 465,323 | $ | 527,043 | ||||||
|
Distribution
from limited partnership investment in Freeport LNG
|
15,300 | — | — | |||||||||
|
Proceeds
from debt issuance
|
— | 239,965 | 400,000 | |||||||||
|
Proceeds
from debt issuance—related parties
|
— | 250,000 | — | |||||||||
|
Use
of restricted U.S. Treasury securities
|
— | 16,702 | — | |||||||||
|
Sale
of common stock
|
— | 472 | 3,158 | |||||||||
|
Proceeds
from sale of common units in partnership
|
— | — | 203,946 | |||||||||
|
Proceeds
from issuance of common units to non-controlling owners in
partnership
|
— | — | 98,442 | |||||||||
|
Other
|
— | — | 1,048 | |||||||||
|
Total
sources of cash and cash equivalents
|
256,401 | 972,462 | 1,233,637 | |||||||||
|
Uses
of cash and cash equivalents
|
||||||||||||
|
LNG
receiving terminal and pipeline construction-in-process,
net
|
(112,317 | ) | (583,871 | ) | (788,517 | ) | ||||||
|
Operating
cash flow
|
(97,857 | ) | (142,145 | ) | (84,291 | ) | ||||||
|
Repayment
of debt
|
(30,030 | ) | (95,000 | ) | — | |||||||
|
Distributions
to non-controlling interest
|
(26,392 | ) | (26,393 | ) | (13,631 | ) | ||||||
|
Purchase
of treasury shares
|
(999 | ) | (4,902 | ) | (325,101 | ) | ||||||
|
Purchases
of intangible and fixed assets, net of sales
|
(522 | ) | (2,889 | ) | (41,684 | ) | ||||||
|
Debt
issuance cost
|
(121 | ) | (34,504 | ) | (9,787 | ) | ||||||
|
Investment
in restricted cash and cash equivalents
|
— | (248,767 | ) | — | ||||||||
|
Advances
under long-term contracts, net of transfers to
construction-in-process
|
— | (14,032 | ) | (38,617 | ) | |||||||
|
Purchases
of LNG for commissioning, net of amounts transferred to LNG receiving
terminal construction-in-process
|
— | (9,923 | ) | — | ||||||||
|
Investment
in U.S. Treasury securities
|
— | — | (98,442 | ) | ||||||||
|
Other
|
(1,983 | ) | (4,374 | ) | — | |||||||
|
Total
uses of cash and cash equivalents
|
(270,221 | ) | (1,166,800 | ) | (1,400,070 | ) | ||||||
|
Net
decrease in cash and cash equivalents
|
(13,820 | ) | (194,338 | ) | (166,433 | ) | ||||||
|
Cash
and cash equivalents—beginning of year
|
102,192 | 296,530 | 462,963 | |||||||||
|
Cash
and cash equivalents—end of year
|
$ | 88,372 | $ | 102,192 | $ | 296,530 | ||||||
|
Sabine
Pass
LNG, L.P.
|
Cheniere
Energy
Partners,
L.P.
|
Other
Cheniere Energy, Inc.
|
Consolidated
Cheniere Energy,
Inc.
|
|||||||||||||
|
Long-term
debt (including related parties)
|
||||||||||||||||
|
Senior
Notes (including related parties)
|
$ | 2,215,500 | $ | — | $ | — | $ | 2,215,500 | ||||||||
|
2007
Term Loan
|
— | — | 400,000 | 400,000 | ||||||||||||
|
2008
Convertible Loans (including related parties)
|
— | — | 293,714 | 293,714 | ||||||||||||
|
Convertible
Senior Unsecured Notes
|
— | — | 204,630 | 204,630 | ||||||||||||
|
Total
long-term debt
|
2,215,500 | — | 898,344 | 3,113,844 | ||||||||||||
|
Debt
discount (including related parties)
|
||||||||||||||||
|
Senior
Notes (including related parties) (1)
|
(32,471 | ) | — | — | (32,471 | ) | ||||||||||
|
Convertible
Senior Unsecured Notes (2)
|
— | — | (39,498 | ) | (39,498 | ) | ||||||||||
|
Total
debt discount
|
(32,471 | ) | (39,498 | ) | (71,969 | ) | ||||||||||
|
Long-term
debt (including related parties), net of discount
|
$ | 2,183,029 | $ | — | $ | 858,846 | $ | 3,041,875 | ||||||||
|
|
(1)
|
In
September 2008, Sabine Pass LNG issued an additional $183.5 million, par
value, of 2016 Notes. The net proceeds from the additional
issuance of the 2016 Notes were $145.0 million. The difference
between the par value and the net
|
|
|
|
proceeds
is the debt discount, which will be amortized through the maturity of the
2016 Notes.
|
|
|
(2)
|
Effective
as of January 1, 2009, we are required to record a debt discount on our
Convertible Senior Unsecured Notes. The unamortized discount
will be amortized through the maturity of the Convertible Senior Unsecured
Notes.
|
|
Payments
Due for Years Ended December 31,
|
||||||||||||||||||||
|
Total
|
2010
|
2011- 2012 | 2013- 2014 |
Thereafter
|
||||||||||||||||
|
Long-term
debt (excluding interest) (1)
|
$ | 3,174,821 | $ | — | $ | 959,321 | $ | 550,000 | $ | 1,665,500 | ||||||||||
|
Operating
lease obligations (2)(3)
|
326,521 | 13,853 | 28,208 | 28,028 | 256,432 | |||||||||||||||
|
Construction
and purchase obligations (4)
|
7,408 | 7,408 | — | — | — | |||||||||||||||
|
Other
obligations (5)
|
20,707 | 3,781 | 7,114 | 4,906 | 4,906 | |||||||||||||||
|
Total
|
$ | 3,529,457 | $ | 25,042 | $ | 994,643 | $ | 582,934 | $ | 1,926,838 | ||||||||||
|
(1)
|
Based
on the total debt balance, scheduled maturities and interest rates in
effect at December 31, 2009, our cash payments for interest would be
$208.4 million in 2010, $208.4 million in 2011, $183.7 million in 2012,
$161.5 million in 2013, $124.9 million in 2014 and $239.5 million for the
remaining years for a total of $1,126.4 million. See “Note
19—Long-Term Debt and Long-Term Debt—Related Parties” of our Notes to
Consolidated Financial Statements.
|
|
(2)
|
A
discussion of these obligations can be found at Note 8—“Leases” of our
Notes to Consolidated Financial
Statements.
|
|
(3)
|
Minimum
lease payments have not been reduced by a minimum sublease rental of $98.9
million due in the future under noncancelable subleases. A discussion of
these sublease rental payments can be found at Note 8—“Leases” of our
Notes to Consolidated Financial
Statements
|
|
(4)
|
A
discussion of these obligations can be found at Note 24—“Commitments and
Contingencies” of our Notes to Consolidated Financial
Statements.
|
|
(5)
|
Includes
obligations for cooperative endeavor agreements, LNG receiving terminal
security services, telecommunication services and software
licensing.
|
|
Years
Ended December 31,
|
||||||||||||
|
2009
|
2008
|
2007
|
||||||||||
|
Physical
natural gas sales, net of costs
|
$ | 2,296 | $ | 943 | $ | 52 | ||||||
|
Inventory
lower-of-cost-or-market write-downs
|
(3,323 | ) | — | — | ||||||||
|
Gain
(loss) from derivatives
|
8,606 | (1,435 | ) | (4,391 | ) | |||||||
|
Other
energy trading activities
|
508 | 3,406 | (390 | ) | ||||||||
|
Total
LNG and Natural Gas Marketing Revenue
|
$ | 8,087 | $ | 2,914 | $ | (4,729 | ) | |||||
|
|
•
|
inability
to recover cost increases due to rate caps and rate case
moratoriums;
|
|
|
•
|
inability
to recover capitalized costs, including an adequate return on those costs
through the rate-making process and the FERC
proceedings;
|
|
|
•
|
excess
capacity;
|
|
|
•
|
increased
competition and discounting in the markets we serve;
and
|
|
|
•
|
impacts
of ongoing regulatory initiatives in the natural gas
industry.
|
|
By:
|
/s/
CHARIF SOUKI
|
By:
|
/s/
Meg A. Gentle
|
|
|
Charif
Souki
Chief
Executive Officer and President
|
Meg
A. Gentle
Senior
Vice President
and
Chief Financial Officer
|
|
/s/ ERNST
& YOUNG LLP
|
|
ERNST &
YOUNG LLP
|
|
/s/ ERNST
& YOUNG LLP
|
|
ERNST &
YOUNG LLP
|
|
December
31,
|
||||||||
|
2009
|
2008
|
|||||||
|
ASSETS
|
(as
adjusted)
|
|||||||
|
CURRENT
ASSETS
|
||||||||
|
Cash
and cash equivalents
|
$ | 88,372 | $ | 102,192 | ||||
|
Restricted
cash and cash equivalents
|
138,309 | 301,550 | ||||||
|
Accounts
and interest receivable
|
9,899 | 3,630 | ||||||
|
LNG
inventory
|
32,602 | — | ||||||
|
Prepaid
expenses and other
|
17,093 | 9,220 | ||||||
|
Total
current assets
|
286,275 | 416,592 | ||||||
|
NON-CURRENT
RESTRICTED CASH AND CASH EQUIVALENTS
|
82,892 | 138,483 | ||||||
|
NON-CURRENT
RESTRICTED U.S. TREASURY SECURITIES
|
— | 20,829 | ||||||
|
PROPERTY,
PLANT AND EQUIPMENT, NET
|
2,216,855 | 2,170,158 | ||||||
|
DEBT
ISSUANCE COSTS, NET
|
47,043 | 55,688 | ||||||
|
GOODWILL
|
76,819 | 76,844 | ||||||
|
INTANGIBLE
LNG ASSETS
|
6,088 | 6,106 | ||||||
|
LNG
HELD FOR COMMISSIONING
|
— | 9,923 | ||||||
|
ADVANCES
UNDER LONG-TERM CONTRACTS
|
1,021 | 10,705 | ||||||
|
OTHER
|
15,629 | 14,754 | ||||||
|
Total
assets
|
$ | 2,732,622 | $ | 2,920,082 | ||||
|
LIABILITIES
AND STOCKHOLDERS’ DEFICIT
|
||||||||
|
CURRENT
LIABILITIES
|
||||||||
|
Accounts
payable
|
$ | 426 | $ | 1,220 | ||||
|
Accrued
liabilities
|
38,425 | 61,883 | ||||||
|
Deferred
revenue
|
26,456 | 2,500 | ||||||
|
Other
|
905 | 530 | ||||||
|
Total
current liabilities
|
66,212 | 66,133 | ||||||
|
LONG-TERM
DEBT, NET OF DISCOUNT
|
2,692,740 | 2,750,308 | ||||||
|
LONG-TERM
DEBT—RELATED PARTIES
|
349,135 | 332,054 | ||||||
|
DEFERRED
REVENUE
|
33,500 | 37,500 | ||||||
|
OTHER
NON-CURRENT LIABILITIES
|
23,162 | 8,141 | ||||||
|
COMMITMENTS
AND CONTINGENCIES
|
— | — | ||||||
|
STOCKHOLDERS’
DEFICIT
|
||||||||
|
Preferred
stock, $.0001 par value, 5,000,000 shares authorized, none
issued
|
— | — | ||||||
|
Common
stock, $.003 par value
|
||||||||
|
Authorized:
240,000,000 and 120,000,000 shares at December 31, 2009 and
2008
|
||||||||
|
Issued
and outstanding: 56,651,000 and 52,297,000 shares at December 31,
2009 and 2008, respectively
|
170 | 157 | ||||||
|
Treasury
stock: 697,000 and 179,000 shares at December 31, 2009 and 2008,
respectively, at cost
|
(1,494 | ) | (496 | ) | ||||
|
Additional
paid-in-capital
|
336,971 | 300,033 | ||||||
|
Accumulated
deficit
|
(985,246 | ) | (823,756 | ) | ||||
|
Accumulated
other comprehensive loss
|
(133 | ) | (154 | ) | ||||
|
Total
stockholders’ deficit
|
(649,732 | ) | (524,216 | ) | ||||
|
NON-CONTROLLING
INTEREST
|
217,605 | 250,162 | ||||||
|
Total
deficit
|
(432,127 | ) | (274,054 | ) | ||||
|
Total
liabilities and deficit
|
$ | 2,732,622 | $ | 2,920,082 | ||||
|
Year
Ended December 31,
|
||||||||||||
|
2009
|
2008
|
2007
|
||||||||||
|
(as
adjusted)
|
(as
adjusted)
|
|||||||||||
|
Revenues
|
||||||||||||
|
LNG
receiving terminal revenue
|
$ | 170,071 | $ | — | $ | — | ||||||
|
Oil
and gas sales
|
2,866 | 4,215 | 5,376 | |||||||||
|
Marketing
and trading gain (loss)
|
8,087 | 2,914 | (4,729 | ) | ||||||||
|
Pipeline
revenue
|
102 | 15 | — | |||||||||
|
Total
revenues
|
181,126 | 7,144 | 647 | |||||||||
|
Operating
costs and expenses
|
||||||||||||
|
LNG
receiving terminal and pipeline development expense
|
223 | 10,556 | 34,656 | |||||||||
|
LNG
receiving terminal and pipeline operating expense
|
36,857 | 14,522 | — | |||||||||
|
Exploration
costs
|
— | 128 | 1,116 | |||||||||
|
Oil
and gas production costs
|
471 | 398 | 358 | |||||||||
|
Impairment
of fixed assets
|
— | — | 18 | |||||||||
|
Depreciation,
depletion and amortization
|
54,229 | 24,346 | 6,393 | |||||||||
|
General
and administrative expenses
|
65,830 | 122,678 | 122,046 | |||||||||
|
Restructuring
charges
|
20 | 78,704 | — | |||||||||
|
Total
operating costs and expenses
|
157,630 | 251,332 | 164,587 | |||||||||
|
Income
(loss) from operations
|
23,496 | (244,188 | ) | (163,940 | ) | |||||||
|
Loss
from equity method investments
|
— | (4,800 | ) | (191 | ) | |||||||
|
Gain/(loss)
on early extinguishment of debt
|
45,363 | (10,691 | ) | — | ||||||||
|
Derivative
gain
|
5,277 | 4,652 | — | |||||||||
|
Interest
expense, net
|
(243,295 | ) | (147,136 | ) | (119,360 | ) | ||||||
|
Interest
income
|
1,405 | 20,337 | 82,635 | |||||||||
|
Other
income
|
99 | 90 | 851 | |||||||||
|
Loss
before income taxes and non-controlling interest
|
(167,655 | ) | (381,736 | ) | (200,005 | ) | ||||||
|
Income
tax provision
|
— | — | — | |||||||||
|
Loss
before non-controlling interest
|
(167,655 | ) | (381,736 | ) | (200,205 | ) | ||||||
|
Non-controlling
interest
|
6,165 | 8,777 | 3,425 | |||||||||
|
Net
loss
|
$ | (161,490 | ) | $ | (372,959 | ) | $ | (196,580 | ) | |||
|
Net
loss per common share—basic and diluted
|
$ | (3.13 | ) | $ | (7.87 | ) | $ | (3.89 | ) | |||
|
Weighted
average number of common shares outstanding—basic and
diluted
|
51,598 | 47,365 | 50,537 | |||||||||
|
Accumulated
|
||||||||||||||||||||||||||
|
Additional
|
Other
|
Non-
|
Total
|
|||||||||||||||||||||||
|
Common
Stock
|
Treasury
Stock
|
Paid-in
|
Accumulated
|
Comprehensive
|
controlling
|
Equity
|
||||||||||||||||||||
|
Shares
|
Amount
|
Shares
|
Amount
|
Capital
|
Deficit
|
Loss
|
Interest
|
(Deficit)
|
||||||||||||||||||
|
Balance—December
31, 2006
|
55,213
|
$
|
166
|
—
|
$
|
—
|
$
|
390,256
|
$
|
(247,141
|
)
|
$
|
(34
|
)
|
$
|
—
|
$
|
143,247
|
||||||||
|
Cumulative
effect of accounting change
|
—
|
—
|
—
|
—
|
118,744
|
(7,076
|
)
|
111,668
|
||||||||||||||||||
|
Balance—December
31, 2006 (as adjusted)
|
55,213
|
166
|
—
|
—
|
509,000
|
(254,217
|
)
|
(34
|
)
|
—
|
254,915
|
|||||||||||||||
|
Issuances
of stock
|
688
|
2
|
—
|
—
|
3,155
|
—
|
—
|
—
|
3,157
|
|||||||||||||||||
|
Issuances
of restricted stock
|
1,029
|
2
|
—
|
—
|
(2
|
)
|
—
|
—
|
—
|
—
|
||||||||||||||||
|
Forfeitures
of restricted stock
|
(20
|
)
|
—
|
20
|
—
|
—
|
—
|
—
|
—
|
—
|
||||||||||||||||
|
Stock-based
compensation
|
—
|
—
|
—
|
—
|
58,331
|
—
|
—
|
—
|
58,331
|
|||||||||||||||||
|
Treasury
stock acquired
|
(9,179
|
)
|
(27
|
)
|
9,179
|
(325,101
|
)
|
27
|
—
|
—
|
—
|
(325,101
|
)
|
|||||||||||||
|
Treasury
stock retired
|
—
|
—
|
(7
|
)
|
62
|
(62
|
)
|
—
|
—
|
—
|
—
|
|||||||||||||||
|
Comprehensive
loss: Foreign currency translation
|
—
|
—
|
—
|
—
|
—
|
—
|
29
|
—
|
29
|
|||||||||||||||||
|
Net
proceeds from non-controlling interest
|
—
|
—
|
—
|
—
|
—
|
—
|
—
|
302,731
|
302,731
|
|||||||||||||||||
|
Loss
attributable to non-controlling interest
|
—
|
—
|
—
|
—
|
—
|
—
|
—
|
(3,425
|
)
|
(3,425
|
)
|
|||||||||||||||
|
Distribution
to non-controlling interest
|
—
|
—
|
—
|
—
|
—
|
—
|
—
|
(13,631
|
)
|
(13,631
|
)
|
|||||||||||||||
|
Net
loss (as adjusted)
|
—
|
—
|
—
|
—
|
—
|
(196,580
|
)
|
—
|
—
|
(196,580
|
)
|
|||||||||||||||
|
Balance—December
31, 2007
|
47,731
|
143
|
9,192
|
(325,039
|
)
|
570,449
|
(450,797
|
)
|
(5
|
)
|
285,675
|
80,426
|
||||||||||||||
|
Issuances
of stock
|
145
|
—
|
—
|
—
|
472
|
—
|
—
|
—
|
472
|
|||||||||||||||||
|
Issuances
of restricted stock
|
4,910
|
15
|
—
|
—
|
(15
|
)
|
—
|
—
|
—
|
—
|
||||||||||||||||
|
Forfeitures
of restricted stock
|
(172
|
)
|
—
|
172
|
—
|
—
|
—
|
—
|
—
|
—
|
||||||||||||||||
|
Stock-based
compensation
|
—
|
—
|
—
|
—
|
58,571
|
—
|
—
|
—
|
58,571
|
|||||||||||||||||
|
Treasury
stock acquired
|
(317
|
)
|
(1
|
)
|
317
|
(4,901
|
)
|
—
|
—
|
—
|
—
|
(4,902
|
)
|
|||||||||||||
|
Treasury
stock retired
|
—
|
—
|
(9,502
|
)
|
329,444
|
(329,444
|
)
|
—
|
—
|
—
|
—
|
|||||||||||||||
|
Comprehensive
gain (loss): Foreign currency translation
|
—
|
—
|
—
|
—
|
—
|
—
|
(149
|
)
|
—
|
(149
|
)
|
|||||||||||||||
|
Loss
attributable to non-controlling interest
|
—
|
—
|
—
|
—
|
—
|
—
|
—
|
(9,120
|
)
|
(9,120
|
)
|
|||||||||||||||
|
Distribution
to non-controlling interest
|
—
|
—
|
—
|
—
|
—
|
—
|
—
|
(26,393
|
)
|
(26,393
|
)
|
|||||||||||||||
|
Net
loss (as adjusted)
|
—
|
—
|
—
|
—
|
—
|
(372,959
|
)
|
—
|
—
|
(372,959
|
)
|
|||||||||||||||
|
Balance—December
31, 2008
|
52,297
|
157
|
179
|
(496
|
)
|
300,033
|
(823,756
|
)
|
(154
|
)
|
250,162
|
(274,054
|
)
|
|||||||||||||
|
Issuances
of stock
|
3,985
|
12
|
—
|
—
|
16,212
|
—
|
—
|
—
|
16,224
|
|||||||||||||||||
|
Issuances
of restricted stock
|
886
|
3
|
—
|
—
|
(3
|
)
|
—
|
—
|
—
|
—
|
||||||||||||||||
|
Forfeitures
of restricted stock
|
(89
|
)
|
—
|
89
|
—
|
—
|
—
|
—
|
—
|
—
|
||||||||||||||||
|
Stock-based
compensation
|
—
|
—
|
—
|
—
|
20,728
|
—
|
—
|
—
|
20,728
|
|||||||||||||||||
|
Treasury
stock acquired
|
(428
|
)
|
(2
|
)
|
429
|
(998
|
)
|
1
|
—
|
—
|
—
|
(999
|
)
|
|||||||||||||
|
Comprehensive
loss: Foreign currency translation
|
—
|
—
|
—
|
—
|
—
|
—
|
21
|
—
|
21
|
|||||||||||||||||
|
Loss
attributable to non-controlling interest
|
—
|
—
|
—
|
—
|
—
|
—
|
—
|
(6,165
|
)
|
(6,165
|
)
|
|||||||||||||||
|
Distribution
to non-controlling interest
|
—
|
—
|
—
|
—
|
—
|
—
|
—
|
(26,392
|
)
|
(26,392
|
)
|
|||||||||||||||
|
Net
loss
|
—
|
—
|
—
|
—
|
—
|
(161,490
|
)
|
—
|
—
|
(161,490
|
)
|
|||||||||||||||
|
Balance—December
31, 2009
|
56,651
|
$
|
170
|
697
|
$
|
(1,494
|
)
|
$
|
336,971
|
$
|
(985,246
|
)
|
$
|
(133
|
)
|
$
|
217,605
|
$
|
(432,127
|
)
|
||||||
|
Year Ended December
31,
|
||||||||||||
|
2009
|
2008
|
2007
|
||||||||||
|
CASH
FLOWS FROM OPERATING ACTIVITIES:
|
(as
adjusted)
|
(as
adjusted)
|
||||||||||
|
Net
loss
|
$ | (161,490 | ) | $ | (372,959 | ) | $ | (196,580 | ) | |||
|
Adjustments
to reconcile net loss to net cash used in operating
activities:
|
||||||||||||
|
Depreciation,
depletion and amortization
|
54,229 | 24,346 | 6,393 | |||||||||
|
(Gain)/loss
on early extinguishment of debt
|
(45,363 | ) | 10,716 | — | ||||||||
|
Non-cash
interest expense on 2008 Convertible Loans
|
32,321 | 11,393 | — | |||||||||
|
Amortization
of debt issuance and discount costs
|
27,549 | 26,435 | 21,123 | |||||||||
|
Non-cash
compensation
|
19,204 | 55,030 | 56,638 | |||||||||
|
Non-cash
inventory write-downs
|
3,516 | — | — | |||||||||
|
Non-controlling
interest
|
(6,165 | ) | (8,777 | ) | (3,425 | ) | ||||||
|
Restricted
interest income on restricted cash and cash equivalents
|
(2,794 | ) | (18,495 | ) | (53,327 | ) | ||||||
|
Use
of restricted cash and cash equivalents
|
1,353 | 94,610 | 103,043 | |||||||||
|
Non-cash
restructuring charges
|
415 | 17,669 | — | |||||||||
|
Other
|
2,232 | (3,311 | ) | 1,015 | ||||||||
|
Changes
in operating assets and liabilities:
|
||||||||||||
|
Accounts
and interest receivable
|
(1,343 | ) | 45,157 | (41,654 | ) | |||||||
|
Accounts
payable and accrued liabilities
|
253 | (42,066 | ) | 42,007 | ||||||||
|
LNG
inventory
|
(32,628 | ) | — | — | ||||||||
|
Deferred
revenue
|
19,956 | — | — | |||||||||
|
Prepaid
expenses and other
|
(9,102 | ) | 18,107 | (19,524 | ) | |||||||
|
NET
CASH USED IN OPERATING ACTIVITIES
|
(97,857 | ) | (142,145 | ) | (84,291 | ) | ||||||
|
CASH
FLOWS FROM INVESTING ACTIVITIES:
|
||||||||||||
|
LNG
terminal and pipeline construction-in-process, net
|
(112,317 | ) | (583,871 | ) | (788,517 | ) | ||||||
|
Use
of restricted cash and cash equivalents
|
110,399 | 465,323 | 526,318 | |||||||||
|
Distributions
from limited partnership investment
|
15,300 | — | — | |||||||||
|
Purchases
of intangible and fixed assets, net of sales
|
(522 | ) | (2,889 | ) | (41,684 | ) | ||||||
|
Oil
and gas property, net of sales
|
(474 | ) | (564 | ) | 17 | |||||||
|
Use
of (investment in) restricted U.S. Treasury securities
|
— | 16,702 | (98,442 | ) | ||||||||
|
Purchases
of LNG commissioning, net of amounts transferred to LNG terminal
construction-in-process
|
— | (9,923 | ) | — | ||||||||
|
Advances
under long-term contracts, net of transfers to
construction-in-process
|
— | (14,032 | ) | (38,617 | ) | |||||||
|
Other
|
(402 | ) | (3,808 | ) | 1,031 | |||||||
|
NET
CASH PROVIDED BY (USED IN) INVESTING ACTIVITIES
|
11,984 | (133,062 | ) | (439,894 | ) | |||||||
|
CASH
FLOWS FROM FINANCING ACTIVITIES:
|
||||||||||||
|
Use
of (investment in) restricted cash and cash equivalents
|
130,702 | (248,767 | ) | 725 | ||||||||
|
Repayment
of debt
|
(30,030 | ) | (95,000 | ) | — | |||||||
|
Distributions
to non-controlling interest
|
(26,392 | ) | (26,393 | ) | (13,631 | ) | ||||||
|
Purchase
of treasury shares
|
(999 | ) | (4,902 | ) | (325,101 | ) | ||||||
|
Debt
issuance cost
|
(121 | ) | (34,504 | ) | (9,787 | ) | ||||||
|
Proceeds
from debt issuance
|
— | 239,965 | — | |||||||||
|
Proceeds
from debt issuance—related parties
|
— | 250,000 | — | |||||||||
|
Proceeds
from sale of common units in partnership
|
— | — | 203,946 | |||||||||
|
Proceeds
from issuance of common units to non-controlling owners in
partnership
|
— | — | 98,442 | |||||||||
|
Proceeds
from 2007 term loan
|
— | — | 400,000 | |||||||||
|
Other
|
(1,107 | ) | 470 | 3,158 | ||||||||
|
NET
CASH PROVIDED BY FINANCING ACTIVITIES
|
72,053 | 80,869 | 357,752 | |||||||||
|
NET
DECREASE IN CASH AND CASH EQUIVALENTS
|
(13,820 | ) | (194,338 | ) | (166,433 | ) | ||||||
|
CASH
AND CASH EQUIVALENTS—BEGINNING OF PERIOD
|
102,192 | 296,530 | 462,963 | |||||||||
|
CASH
AND CASH EQUIVALENTS—END OF PERIOD
|
$ | 88,372 | $ | 102,192 | $ | 296,530 | ||||||
|
Year
Ended
December
31, 2008
|
Years
Ended
December
31, 2007
|
|||||||||||||||||||||||
|
Prior
to
adoption
|
Effect
of
adoption
|
As
adjusted
|
Prior
to
adoption
|
Effect
of
adoption
|
As
adjusted
|
|||||||||||||||||||
|
Increase:
|
||||||||||||||||||||||||
|
Interest
expense, net
|
$
|
(130,648
|
)
|
$
|
(16,488
|
)
|
$
|
(147,136
|
)
|
$
|
(104,557
|
)
|
$
|
(14,803
|
)
|
$
|
(119,360
|
)
|
||||||
|
Net
loss
|
(356,471
|
)
|
(16,488
|
)
|
(372,959
|
)
|
(181,777
|
)
|
(14,803
|
)
|
(196,580
|
)
|
||||||||||||
|
Basic
and diluted net loss per share
|
$
|
(7.53
|
)
|
$
|
(0.34
|
)
|
$
|
(7.87
|
)
|
$
|
(3.60
|
)
|
$
|
(0.29
|
)
|
$
|
(3.89
|
)
|
||||||
|
December
31, 2008
|
||||||||||||
|
Prior
to
adoption
|
Effect
of
adoption
|
As
adjusted
|
||||||||||
|
Increase/(decrease):
|
||||||||||||
|
Debt
issuance costs
|
$
|
57,676
|
$
|
(1,988
|
)
|
$
|
55,688
|
|||||
|
Long-term
debt, net of discount
|
2,832,673
|
(82,365
|
)
|
2,750,308
|
||||||||
|
Additional
paid-in capital
|
181,289
|
118,744
|
300,033
|
|||||||||
|
Accumulated
deficit
|
(785,389
|
)
|
(38,367
|
)
|
(823,756
|
)
|
||||||
|
|
•
|
inability
to recover cost increases due to rate caps and rate case
moratoriums;
|
|
|
•
|
inability
to recover capitalized costs, including an adequate return on those costs
through the rate-making process and the FERC
proceedings;
|
|
|
•
|
excess
capacity;
|
|
|
•
|
increased
competition and discounting in the markets we serve;
and
|
|
|
•
|
impacts
of ongoing regulatory initiatives in the natural gas
industry.
|
|
|
•
|
Holdings
contributed its ownership interests in the entities that directly or
indirectly own the Sabine Pass LNG receiving terminal to Cheniere Energy
Investments, LLC, a wholly-owned subsidiary of Cheniere
Partners;
|
|
|
•
|
Cheniere
Partners issued 21,362,193 common units, 135,383,831 subordinated units,
3,302,045 general partner units (representing a 2% general partner
interest) and certain general partner incentive distribution rights to
wholly-owned subsidiaries of
Cheniere;
|
|
|
•
|
Cheniere
Partners issued 5,054,164 common units to the public and received net
proceeds of $98.4 million; and
|
|
|
•
|
Holdings
initially sold 8,445,836 common units to the public and received net
proceeds of $164.5 million, after which Cheniere and the public owned
89.8% and 8.2% limited partner interests in Cheniere Partners,
respectively. Holdings also granted the underwriters an option to purchase
an additional 2,025,000 of its Cheniere Partners common units to cover
over-allotments in connection with the Cheniere Partners
Offering.
|
|
Severance
Costs
|
Facility
Costs
|
Marketing
Costs
|
Total
|
|||||||||||||
|
Estimated
restructuring charges (at inception of program)
|
$ | 12,400 | $ | — | $ | 69,400 | $ | 81,800 | ||||||||
|
Adjustment
to estimated restructuring charges as of
December 31, 2008
|
(6,071 | ) | 2,583 | 1,292 | (2,196 | ) | ||||||||||
|
Restructuring charges recognized as of December 31, 2008
|
(5,429 | ) | (2,583 | ) | (70,692 | ) | (78,704 | ) | ||||||||
|
Estimated restructuring charges as of December 31,
2008
|
900 | — | — | 900 | ||||||||||||
|
Adjustment to estimated restructuring charges as of
December 31, 2009
|
(880 | ) | — | — | (880 | ) | ||||||||||
|
Restructuring charges recognized as of December 31, 2009
|
(20 | ) | — | — | (20 | ) | ||||||||||
|
Estimated restructuring charges as of December 31,
2009
|
$ | — | $ | — | $ | — | $ | — | ||||||||
|
Net
proceeds from Cheniere Partners’ issuance of common units
(1)
|
$
|
98,442
|
|
|
Net
proceeds from Holdings’ sale of Cheniere Partners common units
(2)
|
203,946
|
||
|
Distributions
to Cheniere Partners’ non-controlling interest
|
(66,415
|
)
|
|
|
Non-controlling
interest share of loss of Cheniere Partners
|
(18,368
|
)
|
|
|
Non-controlling
interest at December 31, 2009
|
$
|
217,605
|
|
(1)
|
In
March and April 2007, we and Cheniere Energy Partners, L.P. (“Cheniere
Partners”) completed a public offering of 15,525,000 Cheniere Partners
common units (“Cheniere Partners Offering”). Through the Cheniere Partners
Offering, Cheniere Partners received $98.4 million in net proceeds from
the issuance of its common units to the public. Prior to January 1, 2009,
a company was able to elect an accounting policy of recording a gain or
loss on the sale of common equity of a subsidiary equal to the amount of
proceeds received in excess of the carrying value of the parent’s
investment. Effective January 1, 2009, the sale of common equity of a
subsidiary will be accounted for as an equity
transaction.
|
|
(2)
|
In
conjunction with the Cheniere Partners Offering, Holdings sold a portion
of the Cheniere Partners common units held by it to the public, realizing
proceeds net of offering costs of $203.9 million, which included $39.4
million of net proceeds realized once the underwriters exercised their
option to purchase an additional 2,025,000 common units from Holdings. Due
to the subordinated distribution rights on our subordinated units, we have
recorded those proceeds as a non-controlling
interest.
|
|
Years
Ending December 31,
|
Operating
Leases
(2) (3)
|
|
|
2010
|
$
|
13,853
|
|
2011
|
13,936
|
|
|
2012
|
14,272
|
|
|
2013
|
14,724
|
|
|
2014
|
13,304
|
|
|
Thereafter
(1)(2)
|
256,432
|
|
|
Total
|
$
|
326,521
|
|
(1)
|
Includes
certain lease option renewals as they were reasonably assured.
|
|
(2)
|
Future
annual minimum lease payments do not include $86.4 million of future
sublease payments we will receive from our two third-party TUA customers
that effectively offsets two-thirds of our lease payment obligation, as
discussed below. Future annual minimum lease payments also do
not include $4.8 million expected to be recovered through sublease
agreements for our Texas Avenue office lease in Houston, Texas, and $7.7
million expected to be recovered for our Pennzoil office
lease.
|
|
(3)
|
Lease
payments for our tug boat lease represent third-party tug boat lease
payment obligations and do not take into account the payments we receive
from our third-party TUA customers that effectively offset two-thirds of
our lease payment obligation, as discussed
below.
|
|
December
31,
|
||||||||
|
2009
|
2008
|
|||||||
|
LNG
TERMINAL COSTS
|
||||||||
|
LNG
receiving terminal
|
$ | 1,637,542 | $ | 927,298 | ||||
|
LNG
receiving terminal construction-in-process
|
37,120 | 643,340 | ||||||
|
LNG
site and related costs, net
|
2,994 | 2,579 | ||||||
|
Accumulated
depreciation
|
(40,200 | ) | (7,813 | ) | ||||
|
Total
LNG receiving terminal costs
|
$ | 1,637,456 | $ | 1,565,404 | ||||
|
NATURAL
GAS PIPELINE COSTS
|
||||||||
|
Natural
gas pipeline
|
$ | 564,213 | $ | 562,893 | ||||
|
Natural
gas pipeline construction-in-process
|
1,995 | 7,937 | ||||||
|
Pipeline
right-of-ways
|
18,455 | 18,221 | ||||||
|
Accumulated
depreciation
|
(23,004 | ) | (8,454 | ) | ||||
|
Total
natural gas pipeline costs
|
$ | 561,659 | $ | 580,597 | ||||
|
OIL
AND GAS PROPERTIES, successful efforts method
|
||||||||
|
Proved
|
$ | 3,565 | $ | 3,439 | ||||
|
Accumulated
depreciation, depletion and amortization
|
(1,787 | ) | (1,043 | ) | ||||
|
Total
oil and gas properties, net
|
$ | 1,778 | $ | 2,396 | ||||
|
FIXED
ASSETS
|
||||||||
|
Computers
and office equipment
|
$ | 5,799 | $ | 5,693 | ||||
|
Furniture
and fixtures
|
5,291 | 5,315 | ||||||
|
Computer
software
|
12,284 | 12,128 | ||||||
|
Leasehold
improvements
|
9,258 | 9,208 | ||||||
|
Other
|
1,488 | 1,254 | ||||||
|
Accumulated
depreciation
|
(18,158 | ) | (11,837 | ) | ||||
|
Total
fixed assets, net
|
$ | 15,962 | $ | 21,761 | ||||
|
PROPERTY,
PLANT AND EQUIPMENT, NET
|
$ | 2,216,855 | $ | 2,170,158 | ||||
|
Components
|
Useful
life
(yrs)
|
||
|
LNG
storage tanks
|
50
|
||
|
Marine
berth, electrical, facility and roads
|
35
|
||
|
Regasification
processing equipment (recondensers, vaporization, and
vents)
|
30
|
||
|
Sendout
pumps
|
20
|
||
|
Other
|
15-30
|
|
Long-term Debt
|
Debt
Issuance
Costs
|
Amortization
Period
|
Accumulated
Amortization
|
Net
Costs
|
|||||||||
|
2013
Senior Notes
|
$ | 9,353 |
7 years
|
$ | (3,993 | ) | $ | 5,360 | |||||
|
2016
Senior Notes
|
30,057 |
10 years
|
(8,465 | ) | 21,592 | ||||||||
|
2007
Term Loan
|
8,450 |
5 years
|
(4,364 | ) | 4,086 | ||||||||
|
2008
Convertible Loans
|
16,942 |
10
years
|
(2,295 | ) | 14,647 | ||||||||
|
Convertible
Senior Unsecured Notes
|
6,613 |
7
years
|
(5,315 | ) | 1,298 | ||||||||
|
Marketing
Credit Facility
|
60 |
1
year
|
— | 60 | |||||||||
| $ | 71,475 | $ | (24,432 | ) | $ | 47,043 | |||||||
|
December
31,
|
||||||||
|
2009
|
2008
|
|||||||
|
Current
assets
|
$ | 113,387 | $ | 72,834 | ||||
|
Property,
plant and equipment, net
|
861,386 | 887,388 | ||||||
|
Construction-in-process
|
71,544 | 62,768 | ||||||
|
Other
assets
|
37,596 | 31,608 | ||||||
|
Total
assets
|
$ | 1,083,913 | $ | 1,054,598 | ||||
|
Current
liabilities
|
$ | 86,677 | $ | 61,317 | ||||
|
Notes
payable, net of current maturities
|
1,089,494 | 1,090,086 | ||||||
|
Deferred
revenue and other deferred credits
|
16,563 | 15,401 | ||||||
|
Partners’
capital
|
(108,821 | ) | (112,206 | ) | ||||
|
Total
liabilities and partners’ capital
|
$ | 1,083,913 | $ | 1,054,598 | ||||
|
Year
ended December 31,
|
||||||||||||
|
2009
|
2008
|
2007
|
||||||||||
|
Revenue
|
$ | 229,522 | $ | 116,359 | $ | — | ||||||
|
Income
(loss) from continuing operations
|
134,468 | (7,890 | ) | (16,677 | ) | |||||||
|
Net
income (loss)
|
54,385 | (40,730 | ) | (22,542 | ) | |||||||
|
Cheniere’s
30% share of income (loss) from equity method investment
(1)
|
$ | 16,316 | $ | (12,219 | ) | $ | (6,763 | ) | ||||
|
(1)
|
During
2009, 2008 and 2007, we did not record $16.3 million, $12.2 million and
$6.8 million of the net income (losses) for such periods, respectively, as
the basis in this investment had been reduced to zero and because we did
not guarantee any obligations and had not been committed to provide any
further financial support since December 2005, other than $4.8 million in
cash calls which we received and funded in
2008.
|
|
December
31,
|
||||||||
|
2009
|
2008
|
|||||||
|
Accrued
interest expense and related fees
|
$ | 16,179 | $ | 17,305 | ||||
|
Payroll
|
11,118 | 8,717 | ||||||
|
LNG
terminal construction costs
|
10,335 | 26,768 | ||||||
|
Pipeline
construction costs
|
22 | 5,102 | ||||||
|
Other
accrued liabilities
|
771 | 3,991 | ||||||
|
Accrued
liabilities
|
$ | 38,425 | $ | 61,883 | ||||
|
December
31,
|
||||||||
|
2009
|
2008
|
|||||||
|
(as
adjusted)
|
||||||||
|
Long-term
debt (including related parties):
|
||||||||
|
Senior
Notes (including related parties)
|
$ | 2,215,500 | $ | 2,215,500 | ||||
|
2007
Term Loan
|
400,000 | 400,000 | ||||||
|
2008
Convertible Loans (including related parties)
|
293,714 | 261,393 | ||||||
|
Convertible
Senior Unsecured Notes
|
204,630 | 325,000 | ||||||
|
Total
long-term debt
|
3,113,844 | 3,201,893 | ||||||
|
Debt
discount:
|
||||||||
|
Senior
Notes (including related parties)
|
(32,471 | ) | (37,166 | ) | ||||
|
Convertible
Senior Unsecured Notes
|
(39,498 | ) | (82,365 | ) | ||||
|
Total
debt discount
|
(71,969 | ) | (119,531 | ) | ||||
|
Long-term
debt (including related parties), net of discount
|
$ | 3,041,875 | $ | 3,082,362 | ||||
|
Payments
Due for the Years Ended December 31,
|
|||||||||||||||
|
Total
|
2010
|
2011
to 2012
|
2013
to 2014
|
Thereafter
|
|||||||||||
|
Long-term
debt (including related parties):
|
|||||||||||||||
|
Senior
Notes
|
$
|
2,215,500
|
$
|
—
|
$
|
—
|
$
|
550,000
|
$
|
1,665,500
|
|||||
|
2007
Term Loan
|
400,000
|
—
|
400,000
|
—
|
—
|
||||||||||
|
2008
Convertible Loans
|
354,691
|
—
|
354,691
|
—
|
—
|
||||||||||
|
Convertible
Senior Unsecured Notes
|
204,630
|
—
|
204,630
|
—
|
—
|
||||||||||
|
Total
long-term debt (including related parties)
|
$
|
3,174,821
|
$
|
—
|
$
|
959,321
|
$
|
550,000
|
$
|
1,665,500
|
|||||
|
December
31,
2009
|
December
31,
2008
|
|||||||
|
(As
adjusted)
|
||||||||
|
Principal
amount
|
$
|
204,630
|
$
|
325,000
|
||||
|
Unamortized
discount
|
(39,498
|
)
|
(82,365
|
)
|
||||
|
Net
carry amount
|
$
|
165,132
|
$
|
242,635
|
||||
|
Quoted Prices in
Active Markets for
Identical
Instruments
(Level
1)
|
Significant
Other
Observable
Inputs
(Level
2)
|
Significant
Unobservable
Inputs
(Level
3)
|
Total
Carrying
Value
|
|||||||||||||
|
Derivatives
liability
|
$
|
905
|
—
|
—
|
$
|
905
|
||||||||||
|
December
31, 2009
|
December
31, 2008
|
|||||||||||||||
|
Carrying
Amount
|
Estimated
Fair
Value
|
Carrying
Amount
|
Estimated
Fair
Value
|
|||||||||||||
|
(As
adjusted)
|
(As
adjusted)
|
|||||||||||||||
|
2013
Notes (1)
|
$
|
550,000
|
$
|
503,250
|
$
|
550,000
|
$
|
412,500
|
||||||||
|
2016
Notes, net of discount (1)
|
1,633,029
|
1,371,744
|
1,628,334
|
1,204,967
|
||||||||||||
|
Convertible
Senior Unsecured Notes, net of discount (2)
|
165,132
|
95,777
|
242,635
|
37,608
|
||||||||||||
|
2007
Term Loan (3)
|
400,000
|
384,640
|
400,000
|
242,447
|
||||||||||||
|
2008
Convertible Loans (3)
|
293,714
|
299,001
|
261,393
|
119,491
|
||||||||||||
|
Restricted
U.S. Treasury securities (4)
|
—
|
—
|
20,829
|
22,901
|
||||||||||||
|
|
(1)
|
The
fair value of the Senior Notes, net of discount, is based on quotations
obtained from broker-dealers who made markets in these and similar
instruments as of December 31, 2009 and 2008, as
applicable.
|
|
|
(2)
|
The
fair value of our Convertible Senior Unsecured Notes is based on the
closing trading prices on December 31, 2009 and 2008, as
applicable.
|
|
|
(3)
|
The
2007 Term Loan and 2008 Convertible Loans are closely held by few holders
and purchases and sales are infrequent and are conducted on a bilateral
basis without price discovery by us. These loans are not rated
and have unique covenants and collateral packages such that comparisons to
other instruments would be imprecise. Moreover, the 2008 Convertible Loans
are convertible into shares of Cheniere common stock. Nonetheless, we have
provided an estimate of the fair value of these loans as of December 31,
2009 and 2008 based on an index of the yield to maturity of CCC rated debt
of other companies in the energy
sector.
|
|
(4)
|
The
fair value of our restricted U.S. Treasury securities is based on
quotations obtained from broker-dealers who made markets in these and
similar instruments as of December 31, 2008 and 2009, as
applicable.
|
|
Year
Ended December 31,
|
||||||||||||
| 2009 | 2008 | 2007 | ||||||||||
|
Current
federal income tax expense
|
$ | — | $ | — | $ | — | ||||||
|
Deferred
federal income tax (provision) benefit
|
— | — | — | |||||||||
|
Total
income tax (provision) benefit
|
$ | — | $ | — | $ | — | ||||||
|
Year
Ended December 31,
|
||||||||||||
|
2009
|
2008
|
2007
|
||||||||||
|
U.S.
statutory tax rate
|
35.0
|
%
|
35.0
|
%
|
35.0
|
%
|
||||||
|
Deferred
tax asset valuation reserve
|
(42.6
|
)
|
%
|
(39.1
|
)
|
%
|
(38.4
|
)
|
%
|
|||
|
State
tax benefit
|
7.1
|
|
%
|
3.7
|
%
|
3.8
|
%
|
|||||
| All other | 0.5 | % | 0.4 | % | (0.4 | ) | % | |||||
|
Effective
tax rate as reported
|
—
|
%
|
—
|
%
|
—
|
%
|
||||||
|
Year
Ended December 31,
|
||||||||
|
2009
|
2008
|
|||||||
|
Deferred
tax assets
|
(As
Adjusted) (1)
|
|||||||
|
Net
operating loss carryforward (2)
|
$ | 265,717 | $ | 184,588 | ||||
|
Investment
in limited partnership
|
53,056 | 81,429 | ||||||
|
Stock
award compensation expense
|
35,835 | 31,317 | ||||||
|
Start-up
costs and construction-in-process associated with LNG, pipeline and
marketing activities
|
8,861 | 8,861 | ||||||
|
Oil
and gas properties and fixed assets
|
2,382 | 2,500 | ||||||
|
Other
|
12,208 | — | ||||||
|
Total
deferred tax assets
|
$ | 378,059 | $ | 308,695 | ||||
|
Deferred
tax liabilities
|
||||||||
|
Pipeline
tax depreciation
|
$ | (23,286 | ) | $ | (2,478 | ) | ||
|
Other
|
(15,420 | ) | (32,827 | ) | ||||
|
Total
deferred tax liabilities
|
$ | (38,706 | ) | $ | (35,305 | ) | ||
|
Net
deferred tax assets
|
$ | 339,353 | $ | 273,390 | ||||
|
Less:
tax asset valuation allowance (3)
|
(339,353 | ) | (273,390 | ) | ||||
| $ | — | $ | — | |||||
|
|
(1)
|
We
have made certain changes in the classification and presentation of
certain gross deferred tax assets and liabilities which had a
corresponding change in the valuation allowance. The net deferred tax
assets and liabilities have not
changed.
|
|
|
(2)
|
The
December 31, 2009 NOL carryforward is composed of approximately $229
million federal NOL carryforward and approximately $37 million state NOL
carryforward. If the NOL carryforward is not utilized it will begin to
expire between 2011 and 2029.
|
|
|
(3)
|
A
valuation allowance equal to our net deferred tax asset balance has been
established due to the uncertainty of realizing the tax benefits related
to our NOL carryforward and other deferred tax assets. The change in the
deferred tax asset valuation allowance was $66.0 million and $117.4
million for the years ended December 31, 2009 and 2008, respectively.
The change in the 2009 valuation allowance from 2008 includes a $2.8
million decrease for expiring, cancelled, and exercised options that were
formerly offset by a full valuation
allowance.
|
|
Balance
as January 1, 2009
|
$ | 22,187 | ||
|
Reductions
for tax positions of prior years
|
(310 | ) | ||
|
Balance
at December 31, 2009
|
$ | 21,877 |
|
Options
|
Weighted
Average Exercise Price
|
Weighted
Average Remaining Contractual Term
|
Aggregate
Intrinsic Value
|
||||||||
|
(in thousands)
|
(in thousands)
|
||||||||||
|
Outstanding
at January 1, 2009
|
1,206
|
$
|
28.96
|
||||||||
|
Granted
|
—
|
—
|
|||||||||
|
Exercised
|
—
|
—
|
|||||||||
|
Forfeited
or Expired
|
(323
|
)
|
36.07
|
||||||||
|
Outstanding
at December 31, 2009
|
883
|
$
|
26.36
|
4.94
|
$
|
—
|
|||||
|
Exercisable
at December 31, 2009
|
860
|
$
|
26.00
|
4.90
|
$
|
—
|
|||||
|
Non
Vested
Shares
|
Weighted
Average
Grant
Date
Fair Value
Per
Share
|
|||||||
|
Non-vested
at January 1, 2009
|
3,724 | $ | 3.46 | |||||
|
Granted
|
847 |
—
|
||||||
|
Vested
|
(2,176 | ) | 3.07 | |||||
|
Forfeited
|
(88 | ) | 4.48 | |||||
|
Non-vested
at December 31, 2009
|
2,307 | $ | 2.52 | |||||
|
Years
Ended December 31,
|
||||||||||||
|
2009
|
2008
|
2007
|
||||||||||
|
(as
adjusted)
|
(as
adjusted)
|
|||||||||||
|
Net
loss
|
$ | (161,490 | ) | $ | (372,959 | ) | $ | (196,580 | ) | |||
|
Other
comprehensive (loss) income item:
|
||||||||||||
|
Foreign
currency translation
|
21 | (149 | ) | 29 | ||||||||
|
Comprehensive
loss
|
$ | (161,469 | ) | $ | (373,108 | ) | $ | (196,551 | ) | |||
|
Segments
|
||||||||||||||||||||
|
LNG
Receiving Terminal
|
Natural
Gas
Pipeline
|
LNG
& Natural Gas Marketing
|
Corporate
and Other (1)
|
Total
Consolidation
|
||||||||||||||||
|
As
of or for the Year Ended December 31, 2009
|
||||||||||||||||||||
|
Revenues
|
$ | 170,071 | $ | 102 | $ | 8,087 | $ | 2,866 | $ | 181,126 | ||||||||||
|
Intersegment
revenues (losses) (2) (3) (4) (5)
|
252,928 | 932 | (249,196 | ) | (4,664 | ) | — | |||||||||||||
|
Depreciation,
depletion and amortization
|
33,203 | 14,731 | 1,505 | 4,790 | 54,229 | |||||||||||||||
|
Non-cash
compensation
|
1,300 | 583 | 5,661 | 11,652 | 19,196 | |||||||||||||||
|
Income
(loss) from operations
|
333,710 | (21,453 | ) | (260,514 | ) | (28,247 | ) | 23,496 | ||||||||||||
|
Interest
expense, net
|
(157,057 | ) | (44,912 | ) | — | (41,326 | ) | (243,295 | ) | |||||||||||
|
Interest
income
|
1,056 | 4 | 202 | 143 | 1,405 | |||||||||||||||
|
Goodwill
|
76,819 | — | — | — | 76,819 | |||||||||||||||
|
Total
assets
|
2,013,618 | 569,626 | 147,164 | 2,214 | 2,732,622 | |||||||||||||||
|
Expenditures
for additions to long-lived assets
|
$ | 106,628 | $ | (4,376 | ) | $ | 1,081 | $ | (539 | ) | $ | 102,794 | ||||||||
|
As
of or for the Year Ended December 31, 2008 (as
adjusted)
|
||||||||||||||||||||
|
Revenues
|
$ | — | $ | 15 | $ | 2,914 | $ | 4,215 | $ | 7,144 | ||||||||||
|
Intersegment
revenues (losses) (2) (3) (4) (5)
|
15,000 | 1,010 | (15,000 | ) | (1,010 | ) | — | |||||||||||||
|
Depreciation,
depletion and amortization
|
8,337 | 8,398 | 1,599 | 6,012 | 24,346 | |||||||||||||||
|
Non-cash
compensation
|
3,500 | 833 | 11,629 | 39,068 | 55,030 | |||||||||||||||
|
Loss
from operations
|
(26,111 | ) | (14,846 | ) | (109,880 | ) | (93,351 | ) | (244,188 | ) | ||||||||||
|
Interest
expense, net
|
(74,825 | ) | (22,674 | ) | (2,057 | ) | (47,580 | ) | (147,136 | ) | ||||||||||
|
Interest
income
|
14,619 | — | 1,624 | 4,094 | 20,337 | |||||||||||||||
|
Goodwill
|
76,844 | — | — | — | 76,844 | |||||||||||||||
|
Total
assets
|
2,191,671 | 590,995 | 136,138 | 1,278 | 2,920,082 | |||||||||||||||
|
Expenditures
for additions to long-lived assets
|
$ | 401,751 | $ | 148,132 | $ | 527 | $ | 2,375 | $ | 552,785 | ||||||||||
|
As
of or for the Year Ended December 31, 2007 (as
adjusted)
|
||||||||||||||||||||
|
Revenues
|
$ | — | $ | — | $ | (4,729 | ) | $ | 5,376 | $ | 647 | |||||||||
|
Depreciation,
depletion and amortization
|
235 | — | 891 | 5,267 | 6,393 | |||||||||||||||
|
Non-cash
compensation
|
4,937 | 2,019 | 13,617 | 37,758 | 58,331 | |||||||||||||||
|
Loss
from operations
|
(37,390 | ) | (4,835 | ) | (39,356 | ) | (82,359 | ) | (163,940 | ) | ||||||||||
|
Interest
expense, net
|
(69,419 | ) | (4 | ) | (502 | ) | (49,435 | ) | (119,360 | ) | ||||||||||
|
Interest
income
|
52,273 | — | 2,476 | 27,886 | 82,635 | |||||||||||||||
|
Goodwill
|
76,844 | — | — | — | 76,844 | |||||||||||||||
|
Total
assets
|
2,041,894 | 443,421 | 157,601 | 316,827 | 2,959,743 | |||||||||||||||
|
Expenditures
for additions to long-lived assets
|
$ | 488,373 | $ | 393,159 | $ | 5,294 | $ | 13,141 | $ | 899,967 | ||||||||||
|
(1)
|
Includes
corporate activities, oil and gas exploration, development and
exploitation activities and certain intercompany eliminations. Our oil and
gas exploration, development and exploitation operating activities have
been included in the corporate and other column due to the lack of a
material impact that these activities have on our consolidated financial
statements. Prior periods were restated to include oil and gas
exploration, development and exploitation activities within corporate and
other.
|
|
(2)
|
Intersegment
revenues related to our LNG receiving terminal segment are primarily from
TUA capacity reservation fee revenues of $250.2 million and $15.0 million
and tug revenues that were received from our LNG and natural gas marketing
segment for
|
|
|
the
years ended December 31, 2009 and 2008, respectively. These LNG receiving
terminal segment intersegment revenues are eliminated with intersegment
expenses in our Consolidated Statement of Operations.
|
|
(3)
|
Intersegment
revenues related to our natural gas pipeline segment are primarily from
transportation fees charged by our natural gas pipeline segment to our LNG
receiving terminal and LNG and natural gas marketing segments to transport
natural gas that was regasified at the Sabine Pass LNG receiving
terminal. These natural gas pipeline segment intersegment
revenues are eliminated with intersegment expenses in our Consolidated
Statement of Operations.
|
|
(4)
|
Intersegment
losses related to our LNG and natural gas marketing segment are primarily
from TUA capacity reservation fee expenses of $250.2 million and $15.0
million and tug costs that were incurred from our LNG receiving terminal
segment for the years ended December 31, 2009 and 2008, respectively. The
costs of the LNG and natural gas marketing segment TUA capacity
reservation fee expenses are classified as marketing trading gain (loss)
as it is considered a capacity contract related to our energy trading and
risk management activities. These LNG and natural gas marketing segment
intersegment revenues are eliminated with intersegment expenses in our
Consolidated Statement of
Operations.
|
|
(5)
|
Intersegment
losses related to corporate and other are from various transactions
between our LNG receiving terminal, natural gas pipeline and LNG and
natural gas marketing segments in which revenue recorded by one operating
segment is eliminated with a non-revenue line item (i.e. operating expense
or is capitalized) by the other operating
segment.
|
|
Year
Ended December 31,
|
||||||||||||
|
2009
|
2008
|
2007
|
||||||||||
|
Cash
paid during the year for interest, net of amounts
capitalized
|
$ | 90,702 | $ | 110,695 | $ | 106,640 | ||||||
|
Construction-in-process
and debt issuance additions funded with accrued
liabilities
|
3,424 | 28,448 | 112,824 | |||||||||
|
First
Quarter
|
Second
Quarter
|
Third
Quarter
|
Fourth
Quarter
|
|||||||||||||
|
Year
ended December 31, 2009:
|
||||||||||||||||
|
Revenues
|
$ | 1,235 | $ | 37,959 | $ | 56,332 | $ | 85,600 | ||||||||
|
Income
(loss) from operations
|
(37,398 | ) | 323 | 18,254 | 42,317 | |||||||||||
|
Net
loss
|
(82,742 | ) | (13,051 | ) | (42,497 | ) | (23,200 | ) | ||||||||
|
Net
loss per share—basic and diluted
|
$ | (1.70 | ) | $ | (0.25 | ) | $ | (0.80 | ) | $ | (0.44 | ) | ||||
|
Year
ended December 31, 2008:
|
||||||||||||||||
|
Revenues
|
$ | 1,477 | $ | 914 | $ | 4,100 | $ | 653 | ||||||||
|
Loss
from operations
|
(38,365 | ) | (103,467 | ) | (39,145 | ) | (63,211 | ) | ||||||||
|
Net
loss (as
adjusted)
|
(53,693 | ) | (136,543 | ) | (71,619 | ) | (111,104 | ) | ||||||||
|
Net
loss per share—basic and diluted (as
adjusted)
|
$ | (1.14 | ) | $ | (2.90 | ) | $ | (1.51 | ) | $ | (2.32 | ) | ||||
|
(a)
|
Financial
Statements, Schedules and Exhibits
|
|
(1)
|
Financial
Statements—Cheniere Energy, Inc. and
Subsidiaries:
|
|
(2)
|
Financial
Statement Schedules:
|
|
Exhibit
No.
|
Description
|
|
2.1*
|
Settlement
and Purchase Agreement, dated and effective as of June 14, 2001 by and
between the Company, CXY Corporation, Crest Energy, L.L.C., Crest
Investment Company and Freeport LNG Terminal, LLC, and two related letter
agreements each dated February 27, 2003. (Incorporated by reference
to Exhibit 10.36 to Cheniere Energy Partner, L.P.’s Registration Statement
on Form S-1 (SEC File No. 333-139572), filed on January 25,
2007)
|
|
2.2*
|
Agreement
and Plan of Merger, dated February 8, 2005, by and among Cheniere LNG,
Inc., Cheniere Acquisition, LLC, BPU Associates, LLC and BPU LNG, Inc.
(Incorporated by reference to Exhibit 2.1 to the Company’s Current Report
on Form 8-K (SEC File No. 001-16383), filed on February 8,
2005)
|
|
3.1*
|
Restated
Certificate of Incorporation of the Company. (Incorporated by reference to
Exhibit 3.1 to the Company’s Quarterly Report on Form 10-Q for the fiscal
quarter ended June 30, 2004 (SEC File No. 001-16383), filed on August 10,
2004)
|
|
3.2*
|
Certificate
of Amendment of Restated Certificate of Incorporation of the Company.
(Incorporated by reference to Exhibit 3.1 to the Company’s Current Report
on Form 8-K (SEC File No. 001-16383), filed on February 8,
2005)
|
|
3.3*
|
Certificate
of Amendment of Restated Certificate of Incorporation of the Company.
(Incorporated by reference to Exhibit 4.3 to the Company’s Registration
Statement on Form S-8 (SEC File No. 333-160017), filed on June 16,
2009)
|
|
3.4*
|
Amended
and Restated By-laws of the Company. (Incorporated by reference to Exhibit
4.3 to the Company’s Registration Statement on Form S-8 (SEC File No.
333-112379), filed on January 30, 2004)
|
|
3.5*
|
Amendment
No. 1 to Amended and Restated By-laws of the Company. (Incorporated by
reference to Exhibit 3.1 to the Company’s Quarterly Report on Form 10-Q
(SEC File No. 001-16383), filed on May 6, 2005)
|
|
3.6*
|
Amendment
No. 2, dated September 6, 2007, to the Amended and Restated By-Laws of
Cheniere Energy, Inc. (Incorporated by reference to Exhibit 3.1 to the
Company’s Current Report on Form 8-K (SEC File No. 001-16383), filed
on September 12, 2007)
|
|
4.1*
|
Specimen
Common Stock Certificate of the Company. (Incorporated by reference to
Exhibit 4.1 to the Company’s Registration Statement on Form S-1 (SEC File
No. 333-10905), filed on August 27, 1996)
|
|
4.2*
|
Certificate
of Designation of Series A Junior Participating Preferred Stock.
(Incorporated by reference to Exhibit 3.1 to the Company’s Current Report
on Form 8-K (SEC File No. 001 16383), filed on October 14,
2004)
|
|
4.3*
|
Rights
Agreement by and between the Company and U.S. Stock Transfer Corp., as
Rights Agent, dated as of October 14, 2004. (Incorporated by reference to
Exhibit 4.1 to the Company’s Current Report on Form 8-K (SEC File No.
001-16383), filed on October 14, 2004)
|
|
4.4*
|
First
Amendment to Rights Agreement by and between the Company and U.S. Stock
Transfer Corp., as Rights Agent, dated January 24, 2005. (Incorporated by
reference to Exhibit 4.1 to the Company’s Current Report on Form 8-K (SEC
File No. 001-16383), filed on January 24, 2005)
|
|
4.5*
|
Second
Amendment to Rights Agreement by and between Cheniere Energy, Inc. and
Computershare Trust Company, N.A. (formerly U.S. Stock Transfer Corp.), as
Rights Agent, dated as of October 24, 2008 (filed herewith). (Incorporated
by reference to Exhibit 4.1 to the Company’s Current Report on Form 8-K
(SEC File No. 001-16383), filed on October 24, 2008)
|
|
4.6*
|
Certificate
of Designations of Series B Preferred Stock of Cheniere Energy, Inc.
(Incorporated by reference to Exhibit 3.1 to the Company’s Current Report
on Form 8-K (SEC File No. 001-16383), filed on August 18,
2008)
|
|
4.7*
|
Form
of Series B Preferred Stock Certificate of Cheniere Energy, Inc.
(Incorporated by reference to Exhibit 4.1 to the Company’s Current Report
on Form 8-K (SEC File No. 001-16383), filed on August 18,
2008)
|
|
4.8*
|
Indenture,
dated as of July 27, 2005, between the Company, as issuer, and The Bank of
New York, as trustee. (Incorporated by reference to Exhibit 4.3 to the
Company’s Current Report on Form 8-K (SEC File No.
001-
|
|
Exhibit
No.
|
Description
|
|
|
16383),
filed on July 27, 2005)
|
|
4.9*
|
Indenture,
dated as of November 9, 2006, between Sabine Pass LNG, L.P., as issuer,
and The Bank of New York, as trustee. (Incorporated by reference to
Exhibit 4.1 to the Company’s Current Report on Form 8-K (SEC File No.
001-16383), filed on November 16, 2006)
|
|
4.10*
|
Form
of 7.25% Senior Secured Note due 2013 (Included as Exhibit A1 to Exhibit
4.9 above)
|
|
4.11*
|
Form
of 7.50% Senior Secured Note due 2016 (Included as Exhibit A1 to Exhibit
4.9 above)
|
|
10.1*
|
LNG
Terminal Use Agreement, dated September 2, 2004, by and between Total LNG
USA, Inc. and Sabine Pass LNG, L.P. (Incorporated by reference to Exhibit
10.1 to the Company’s Quarterly Report on Form 10-Q (SEC File No.
001-16383), filed on November 15, 2004)
|
|
10.2*
|
Amendment
of LNG Terminal Use Agreement, dated January 24, 2005, by and between
Total LNG USA, Inc. and Sabine Pass LNG, L.P. (Incorporated by reference
to Exhibit 10.40 to the Company’s Annual Report on Form 10-K (SEC File No.
001-16383), filed on March 10, 2005)
|
|
10.3*
|
Omnibus
Agreement, dated September 2, 2004, by and between Total LNG USA, Inc. and
Sabine Pass LNG, L.P. (Incorporated by reference to Exhibit 10.2 to the
Company’s Quarterly Report on Form 10-Q (SEC File No. 001-16383), filed on
November 15, 2004)
|
|
10.4*
|
Guaranty,
dated as of November 9, 2004, by Total S.A. in favor of Sabine Pass
LNG, L.P. (Incorporated by reference to Exhibit 10.3 to the Company’s
Quarterly Report on Form 10-Q (SEC File No. 001 16383), filed on
November 15, 2004)
|
|
10.5*
|
LNG
Terminal Use Agreement, dated November 8, 2004, between Chevron U.S.A.
Inc. and Sabine Pass LNG, L.P. (Incorporated by reference to Exhibit 10.4
to the Company’s Quarterly Report on Form 10-Q (SEC File No. 001-16383),
filed on November 15, 2004)
|
|
10.6*
|
Amendment
to LNG Terminal Use Agreement, dated December 1, 2005, by and between
Chevron U.S.A., Inc. and Sabine Pass LNG, L.P. (Incorporated by reference
to Exhibit 10.28 to Sabine Pass LNG, L.P.’s Registration Statement on Form
S-4 (SEC File No. 333-138916), filed on November 22,
2006)
|
|
10.7*
|
Omnibus
Agreement, dated November 8, 2004, between Chevron U.S.A., Inc. and Sabine
Pass LNG, L.P. (Incorporated by reference to Exhibit 10.5 to the Company’s
Quarterly Report on Form 10-Q (SEC File No. 001-16383), filed on November
15, 2004)
|
|
10.8*
|
Guaranty
Agreement, dated as of December 15, 2004, from ChevronTexaco Corporation
to Sabine Pass LNG, L.P. (Incorporated by reference to Exhibit 10.12 to
Sabine Pass LNG, L.P.’s Registration Statement on Form S-4 (SEC File No.
333-138916), filed on November 22, 2006)
|
|
10.9*
|
Amended
and Restated Terminal Use Agreement, dated November 9, 2006, by and
between Cheniere Marketing, Inc. and Sabine Pass LNG, L.P. (Incorporated
by reference to Exhibit 10.6 to the Company’s Current Report on Form 8-K
(SEC File No. 001-16383), filed on November 16, 2006)
|
|
10.10*
|
Amendment
of LNG Terminal Use Agreement, dated June 25, 2007, by and between
Cheniere Marketing, Inc. and Sabine Pass LNG, L.P. (Incorporated by
reference to Exhibit 10.1 to the Company’s Current Report on Form 8-K (SEC
File No. 001-16383), filed on June 26, 2007)
|
|
10.11*
|
Cooperative
Endeavor Agreement & Payment in Lieu of Tax Agreement, dated October
23, 2007 (amending the Amended and Restated Terminal Use Agreement, dated
November 9, 2006, by and between Cheniere Marketing, Inc. and Sabine Pass
LNG, L.P.). (Incorporated by reference to Exhibit 10.7 to the Company’s
Quarterly Report on Form 10-Q (SEC File No. 001-16383), filed on November
6, 2007)
|
|
10.12*
|
LNG
Lease Agreement, dated June 24, 2008, between Cheniere Marketing, Inc. and
Sabine Pass LNG, L.P. (Incorporated by reference to Exhibit 10.7 to the
Company’s Quarterly Report on Form 10-Q (SEC File No. 001-16383), filed on
August 11, 2008)
|
|
10.13*
|
Guarantee
Agreement, dated as of November 9, 2006, by the Company. (Incorporated by
reference to Exhibit 10.7 to the Company’s Current Report on Form 8-K (SEC
File No. 001-16383), filed on November 16, 2006)
|
|
10.14*
|
Notice
of Commitment, dated May 31, 2007. (Incorporated by reference to Exhibit
10.1 to the Company’s Current Report on Form 8-K (SEC File No. 001-16383),
filed on June 1, 2007)
|
|
Exhibit
No.
|
Description
|
|
10.15*
|
Collateral
Trust Agreement, dated November 9, 2006, by and among Sabine Pass LNG,
L.P., The Bank of New York, as collateral trustee, Sabine Pass LNG-GP,
Inc. and Sabine Pass LNG-LP, LLC. (Incorporated by reference to Exhibit
10.1 to the Company’s Current Report on Form 8-K (SEC File No. 001-16383),
filed on November 16, 2006)
|
|
10.16*
|
Amended
and Restated Parity Lien Security Agreement, dated November 9, 2006, by
and between Sabine Pass LNG, L.P. and The Bank of New York, as collateral
trustee. (Incorporated by reference to Exhibit 10.2 to the Company’s
Current Report on Form 8-K (SEC File No. 001-16383), filed on November 16,
2006)
|
|
10.17*
|
Third
Amended and Restated Multiple Indebtedness Mortgage, Assignment of Rents
and Leases and Security Agreement, dated November 9, 2006, between
the Sabine Pass LNG, L.P. and The Bank of New York, as collateral trustee.
(Incorporated by reference to Exhibit 10.3 to the Company’s Current Report
on Form 8-K (SEC File No. 001-16383), filed on November 16,
2006)
|
|
10.18*
|
Amended
and Restated Parity Lien Pledge Agreement, dated November 9, 2006, by and
among Sabine Pass LNG, L.P., Sabine Pass LNG-GP, Inc., Sabine Pass LNG-LP,
LLC and The Bank of New York, as collateral trustee. (Incorporated by
reference to Exhibit 10.4 to the Company’s Current Report on Form 8-K (SEC
File No. 001-16383), filed on November 16, 2006)
|
|
10.19*
|
Security
Deposit Agreement, dated November 9, 2006, by and among Sabine Pass LNG,
L.P., The Bank of New York, as collateral trustee, and The Bank of New
York, as depositary agent. (Incorporated by reference to Exhibit 10.5 to
the Company’s Current Report on Form 8-K (SEC File No. 001-16383), filed
on November 16, 2006)
|
|
10.20*
|
Credit
Agreement, dated as of May 31, 2007, among Cheniere Subsidiary Holdings,
LLC, Perry Capital, L.L.C., the several lenders from time to time parties
thereto, and The Bank of New York, as Administrative Agent. (Incorporated
by reference to Exhibit 10.1 to the Company’s Current Report on Form 8-K
(SEC File No. 001-16383), filed on June 1,
2007)
|
|
10.21*
|
Guarantee
and Pledge Agreement, dated as of May 31, 2007, by Cheniere Energy, Inc.,
Cheniere LNG Holdings, LLC, Cheniere FLNG-GP, LLC, and Cheniere Subsidiary
Holdings, LLC in favor of The Bank of New York, as Administrative Agent.
(Incorporated by reference to Exhibit 10.2 to the Company’s Current Report
on Form 8-K (SEC File No. 001-16383), filed on June 1,
2007)
|
|
10.22*
|
Credit
Agreement, dated May 5, 2008, among Cheniere Common Units Holding, LLC,
the lenders party thereto and Credit Suisse, Cayman Islands Branch.
(Incorporated by reference to Exhibit 10.6 to the Company’s Quarterly
Report on Form 10-Q (SEC File No. 001-16383), filed on May 9,
2008)
|
|
10.23*
|
Pledge
Agreement, dated May 5, 2008, among Cheniere Common Units Holding, LLC,
Cheniere LNG Holdings, LLC, Cheniere Pipeline GP Interests, LLC, Grand
Cheniere Pipeline, LLC and Credit Suisse, Cayman Islands Branch.
(Incorporated by reference to Exhibit 10.7 to the Company’s Quarterly
Report on Form 10-Q (SEC File No. 001-16383), filed on May 9,
2008)
|
|
10.24*
|
Security
Agreement, dated May 5, 2008, between Cheniere Common Units Holding, LLC
and Credit Suisse, Cayman Islands Branch. (Incorporated by reference to
Exhibit 10.8 to the Company’s Quarterly Report on Form 10-Q (SEC File No.
001-16383), filed on May 9, 2008)
|
|
10.25*
|
Non-Recourse
Guaranty, dated May 5, 2008, by Cheniere Energy, Inc. in favor of Credit
Suisse. (Incorporated by reference to Exhibit 10.9 to the Company’s
Quarterly Report on Form 10-Q (SEC File No. 001-16383), filed on May 9,
2008)
|
|
10.26*
|
Credit
Agreement dated August 15, 2008, by and among Cheniere Common Units
Holding, LLC the other Loan Parties (as defined therein), The Bank of New
York Mellon, as administrative agent and collateral agent and the Lenders
(as defined therein). (Incorporated by reference to Exhibit 10.1 to
the Company’s Current Report on Form 8-K (SEC File No. 001-16383), filed
on August 18, 2008)
|
|
10.27*
|
First
Amendment to Credit Agreement, dated September 15, 2008, among Cheniere
Common Units Holding, LLC, the other Loan Parties (as defined therein),
The Bank of New York Mellon, as administrative agent and collateral agent
and the Lenders (as defined therein) (Incorporated by reference to Exhibit
10.63 to the Company’s Annual Report on Form 10-K (SEC File No.
001-16383), filed on February 27, 2009)
|
|
10.28*
|
Second
Amendment to Credit Agreement, First Amendment to Guarantee and Collateral
Agreement (Crest Entities) and First Amendment to Guarantee and Collateral
Agreement (Non-Crest Entities), dated December
|
|
Exhibit
No.
|
Description
|
|
|
31,
2008, by Cheniere Common Units Holding, LLC, the loan parties, the
guarantors and the grantors signatory thereto, the lenders signatory
thereto and The Bank of New York Mellon, as administrative agent and as
collateral agent (Incorporated by reference to Exhibit 10.64 to the
Company’s Annual Report on Form 10-K (SEC File No. 001-16383), filed on
February 27, 2009)
|
|
10.29*
|
Third
Amendment to Credit Agreement and Third Amendment to Guarantee and
Collateral Agreement (Non-Crest Entities), dated April 3, 2009, among
Cheniere Common Units Holding, LLC, the loan parties, the guarantors and
the grantors signatory thereto, the lenders signatory thereto and The Bank
of New York Mellon, as administrative agent and collateral agent
(Incorporated by reference to Exhibit 10.1 to the Company’s Quarterly
Report on Form 10-Q (SEC File No. 001-16383), filed on May 8,
2009)
|
|
10.30*
|
Fourth
Amendment to Credit Agreement, dated April 9, 2009, among Cheniere Common
Units Holding, LLC, the other Loan Parties (as defined therein), the
Lenders (as defined therein) and The Bank of New York Mellon, as
administrative agent and collateral agent (Incorporated by reference to
Exhibit 10.2 to the Company’s Quarterly Report on Form 10-Q (SEC File No.
001-16383), filed on May 8, 2009)
|
|
10.31*
|
Amendment
No. Four-A to Credit Agreement, dated April 27, 2009, among Cheniere
Common Units Holding, LLC, the other Loan Parties (as defined therein),
the Lenders (as defined therein) and The Bank of New York Mellon, as
administrative agent and collateral agent (Incorporated by reference to
Exhibit 10.3 to the Company’s Quarterly Report on Form 10-Q (SEC File No.
001-16383), filed on May 8, 2009)
|
|
10.32*
|
Amendment
No. Four-B to Credit Agreement, dated April 28, 2009, among Cheniere
Common Units Holding, LLC, the other Loan Parties (as defined therein),
the Lenders (as defined therein) and The Bank of New York Mellon, as
administrative agent and collateral agent (Incorporated by reference to
Exhibit 10.4 to the Company’s Quarterly Report on Form 10-Q (SEC File No.
001-16383), filed on May 8, 2009)
|
|
10.33*
|
Amendment
No. Four-C to Credit Agreement, dated June 23, 2009, among Cheniere Common
Units Holding, LLC, the other Loan Parties (as defined therein), the
Lenders (as defined therein) and The Bank of New York Mellon, as
administrative agent and collateral agent (Incorporated by reference to
Exhibit 10.3 to the Company’s Quarterly Report on Form 10-Q (SEC File No.
001-16383), filed on August 7, 2009)
|
|
10.34*
|
Amendment
No. Four-D to Credit Agreement, dated June 29, 2009, among Cheniere Common
Units Holding, LLC, the other Loan Parties (as defined therein), the
Lenders (as defined therein) and The Bank of New York Mellon, as
administrative agent and collateral agent (Incorporated by reference to
Exhibit 10.4 to the Company’s Quarterly Report on Form 10-Q (SEC File No.
001-16383), filed on August 7, 2009)
|
|
10.35*
|
Fifth
Amendment to Credit Agreement, dated September 17, 2009, by Cheniere
Common Units Holding, LLC, the Loan Parties (as defined therein), the
Lenders (as defined therein) and The Bank of New York Mellon, as
administrative agent and collateral agent (Incorporated by reference to
Exhibit 10.5 to the Company’s Quarterly Report on Form 10-Q (SEC File No.
001-16383), filed on November 6, 2009)
|
|
10.36*
|
Guarantee
and Collateral Agreement (Crest Entities), dated August 15, 2008, made by
the entities party thereto in favor of The Bank of New York Mellon, as
collateral agent. (Incorporated by reference to Exhibit 10.2 to the
Company’s Current Report on Form 8-K (SEC File No. 001-16383), filed on
August 18, 2008)
|
|
10.37*
|
Guarantee
and Collateral Agreement (Non-Crest Entities), dated August 15, 2008, by
Cheniere Common Units Holding, LLC and the other entities party thereto in
favor of The Bank of New York Mellon, as collateral agent. (Incorporated
by reference to Exhibit 10.3 to the Company’s Current Report on Form 8-K
(SEC File No. 001-16383), filed on August 18,
2008)
|
|
10.38*
|
Waiver
to Credit Agreement and Guarantee and Collateral Agreement (Non-Crest
Entities), dated December 13, 2008, among Cheniere Common Units Holding,
LLC, Cheniere Midstream Holdings, Inc., Cheniere LNG Services, Inc., GSO
Special Situations Fund LP, GSO Credit Opportunities Fund (Helios), L.P.,
GSO Special Situations Overseas Master Fund Ltd., Blackstone Distressed
Securities Fund L.P., Scorpion Capital Partners LP and The Bank of New
York Mellon, as collateral agent and administrative agent (Incorporated by
reference to Exhibit 10.67 to the Company’s Annual Report on Form 10-K
(SEC File No. 001-16383), filed on February 27, 2009)
|
|
10.39*
|
Second
Amendment to Guarantee and Collateral Agreements, dated December 31, 2008,
by Cheniere Midstream Holdings, Inc., Sabine Pass Tug Services, LLC,
Cheniere LNG, Inc., Cheniere LNG Terminals, Inc., Cheniere Marketing, LLC,
the Lenders signatory thereto and The Bank of New York Mellon, as
collateral agent (Incorporated by reference to Exhibit 10.68 to the
Company’s Annual Report on Form 10-K
|
|
|
|
|
|
|
|
Exhibit
No.
|
Description
|
| (SEC File No. 001-16383), filed on February 27, 2009) | |
|
10.40*
|
Third
Amendment to Guarantee and Collateral Agreement (Crest Entities) and
Fourth Amendment to Guarantee and Collateral Agreement (Non-Crest
Entities), dated September 17, 2009, by Cheniere Common Units Holding,
LLC, the guarantors and the grantors signatory thereto and The Bank of New
York Mellon, as collateral agent (Incorporated by reference to Exhibit
10.4 to the Company’s Quarterly Report on Form 10-Q (SEC File No.
001-16383), filed on November 6, 2009)
|
|
10.41*
|
Assumption
Agreement, dated September 17, 2009, by Cheniere Marketing, LLC (formerly
Cheniere Marketing, Inc.) in favor of The Bank of New York Mellon, as
collateral agent (Incorporated by reference to Exhibit 10.6 to the
Company’s Quarterly Report on Form 10-Q (SEC File No.
001-16383), filed on November 6, 2009)
|
|
10.42*
|
Security
Deposit Agreement, dated August 15, 2008, by and among Cheniere LNG
Holdings, LLC and The Bank of New York Mellon, as collateral agent and
depositary agent. (Incorporated by reference to Exhibit 10.4 to the
Company’s Current Report on Form 8-K (SEC File No. 001-16383), filed on
August 18, 2008)
|
|
10.43*
|
First
Amendment to Security Deposit Agreement, dated June 19, 2009, by and
between Cheniere LNG Holdings, LLC and The Bank of New York Mellon as
collateral agent and depositary agent (Incorporated by reference to
Exhibit 10.5 to the Company’s Quarterly Report on Form 10-Q (SEC File No.
001-16383), filed on May 7, 2009)
|
|
10.44*
|
Investors’
Agreement, dated August 15, 2008, by and between Cheniere Energy, Inc.,
Cheniere Common Units Holding, LLC and the investors named therein.
(Incorporated by reference to Exhibit 10.5 to the Company’s Current Report
on Form 8-K (SEC File No. 001-16383), filed on August 18,
2008)
|
|
10.45*
|
First
Amendment to Investors’ Agreement, dated November 11, 2008, among Cheniere
Energy, Inc., Cheniere Common Units Holding, LLC, GSO Special Situations
Fund LP, GSO Origination Funding Partners LP, Blackstone Distressed
Securities Fund L.P., GSO COF Facility LLC, and Scorpion Capital Partners
LP (Incorporated by reference to Exhibit 10.71 to the Company’s Annual
Report on Form 10-K (SEC File No. 001-16383), filed on February 27,
2009)
|
|
10.46*
|
Gas
Purchase and Sale Agreement, dated April 4, 2006, between Cheniere LNG
Marketing, Inc. and PPM Energy, Inc. (Incorporated by reference to Exhibit
10.2 to the Company’s Quarterly Report on Form 10-Q (SEC File No.
001-16383), filed on May 5, 2006)
|
|
10.47*
|
Master
Ex-Ship LNG Sales Agreement, dated April 26, 2007, between Cheniere
Marketing, Inc. and Gaz de France International Trading S.A.S., including
Letter Agreement, dated April 26, 2007, and Specific Order No. 1, dated
April 26, 2007. (Incorporated by reference to Exhibit 10.2 to the
Company’s Quarterly Report on Form 10-Q (SEC File No. 001-16383), filed on
May 8, 2007)
|
|
10.48*
|
GDF
Transatlantic Option Agreement, dated April 26, 2007, between Cheniere
Marketing, Inc. and Gaz de France International Trading S.A.S.
(Incorporated by reference to Exhibit 10.3 to the Company’s Quarterly
Report on Form 10-Q (SEC File No. 001-16383), filed on May 8,
2007)
|
|
10.49*†
|
Cheniere
Energy, Inc. Amended and Restated 1997 Stock Option Plan. (Incorporated by
reference to Exhibit 10.14 to the Company’s Quarterly on Form 10-Q (SEC
File No. 000-16383), filed on November 4, 2005)
|
|
10.50*†
|
Form
of Amendment to Nonqualified Stock Option Agreement under the Cheniere
Energy, Inc. Amended and Restated 1997 Stock Option Plan pursuant to the
Nonqualified Stock Option Agreement. (Incorporated by reference to Exhibit
10.6 to the Company’s Quarterly Report on Form 10-Q (SEC File No.
001-16383), filed on November 7, 2008)
|
|
10.51*†
|
Cheniere
Energy, Inc. Amended and Restated 2003 Stock Incentive Plan. (Incorporated
by reference to Exhibit 10.14 to the Company’s Quarterly Report on Form
10-Q (SEC File No. 001-16383), filed on November 4,
2005)
|
|
10.52*†
|
Addendum
to Cheniere Energy, Inc. Amended and Restated 2003 Stock Incentive Plan
(Incorporated by reference to Exhibit 10.3 to the Company’s Annual Report
on Form 10-K for the year ended December 31, 2005 (SEC File No.
001-16383), filed on March 13, 2006)
|
|
10.53*†
|
Amendment
No. 1 to Cheniere Energy, Inc. Amended and Restated 2003 Stock Incentive
Plan. (Incorporated by reference to Exhibit 4.10 to the Company’s
Registration Statement on Form S-8 (SEC File No.
333-
|
|
Exhibit
No.
|
Description
|
| 134886), filed on June 9, 2006) | |
|
10.54*†
|
Amendment
No. 2 to Cheniere Energy, Inc. Amended and Restated 2003 Stock Incentive
Plan (Incorporated by reference to Exhibit 10.84 to the Company’s Annual
Report on Form 10-K (SEC File No. 001-16383), filed on February 27,
2007)
|
|
10.55*†
|
Amendment
No. 3 to Cheniere Energy, Inc. Amended and Restated 2003 Stock Incentive
Plan (Incorporated by reference to Exhibit A to the Company’s Proxy
Statement (SEC File No. 001-16383), filed on April 23,
2008)
|
|
10.56*
|
Amendment
No. 4 to the Cheniere Energy, Inc. Amended and Restated 2003 Stock
Incentive plan (Incorporated by reference to Exhibit 10.2 to the Company’
Current Report on Form 8-K (SEC File No. 001-16383), filed on June 15,
2009)
|
|
10.57*†
|
Form
of Non-Qualified Stock Option Grant for Employees and Consultants
(three-year vesting) under the Cheniere Energy, Inc. Amended and Restated
2003 Stock Incentive Plan. (Incorporated by reference to Exhibit 10.2 to
the Company’ Current Report on Form 8-K (SEC File No. 001-16383), filed on
January 11, 2007)
|
|
10.58*†
|
Form
of Non-Qualified Stock Option Grant for Employees and Consultants
(four-year vesting) under the Cheniere Energy, Inc. Amended and Restated
2003 Stock Incentive Plan. (Incorporated by reference to Exhibit 10.3 to
the Company’ Current Report on Form 8-K (SEC File No. 001-16383), filed on
January 11, 2007)
|
|
10.59*†
|
Form
of Non-Qualified Stock Option Grant for Non-Employee Directors under the
Cheniere Energy, Inc. Amended and Restated 2003 Stock Incentive Plan.
(Incorporated by reference to Exhibit 10.4 to the Company’ Current Report
on Form 8-K (SEC File No. 001-16383), filed on January 11,
2007)
|
|
10.60*†
|
Form
of Amendment to Non-Qualified Stock Option Grant under the Cheniere
Energy, Inc. Amended and Restated 2003 Stock Incentive Plan. (Incorporated
by reference to Exhibit 10.7 to the Company’ Quarterly Report on Form 10-Q
(SEC File No. 001-16383), filed on November 7, 2008)
|
|
10.61*†
|
Form
of Restricted Stock Grant (three-year vesting) under the Cheniere Energy,
Inc. Amended and Restated 2003 Stock Incentive Plan. (Incorporated by
reference to Exhibit 10.5 to the Company’ Current Report on Form 8-K (SEC
File No. 001-16383), filed on January 11, 2007)
|
|
10.62*†
|
Form
of Restricted Stock Grant (four-year vesting) under the Cheniere Energy,
Inc. Amended and Restated 2003 Stock Incentive Plan. (Incorporated by
reference to Exhibit 10.6 to the Company’ Current Report on Form 8-K (SEC
File No. 001-16383), filed on January 11, 2007)
|
|
10.63*†
|
Form
of Restricted Stock Agreement for Non-Employee Directors. (Incorporated by
reference to Exhibit 10.2 to the Company’s Current Report on Form 8-K (SEC
File No. 001-16383), filed on June 1, 2007)
|
|
10.64*†
|
Form
of Cancellation and Grant of Non-Qualified Stock Options (three-year
vesting) under the Cheniere Energy, Inc. 2003 Stock Incentive Plan.
(Incorporated by reference to Exhibit 10.1 to the Company’s Current Report
on Form 8-K (SEC File No. 001-16383), filed on August 2,
2005)
|
|
10.65*†
|
Form
of Amendment to Non-Qualified Stock Option Agreement. (Incorporated by
reference to Exhibit 10.1 to the Company’s Current Report on Form 8-K (SEC
File No. 001-16383), filed on April 3, 2007)
|
|
10.66*†
|
Form
of French Stock Option Grant for Employees and Consultants (four-year
vesting) under the Cheniere Energy, Inc. Amended and Restated 2003 Stock
Incentive Plan (Incorporated by reference to Exhibit 10.91 to the
Company’s Annual Report on Form 10-K (SEC File No. 001-16383), filed on
February 27, 2007)
|
|
10.67*†
|
Form
of French Restricted Shares Grant for Employees, Consultants and
Non-Employee Directors (three-year vesting) under the Cheniere Energy,
Inc. Amended and Restated 2003 Stock Incentive Plan (Incorporated by
reference to Exhibit 10.92 to the Company’s Annual Report on Form 10-K
(SEC File No. 001-16383), filed on February 27,
2007)
|
|
10.68*†
|
Form
of French Restricted Shares Grant for Employees, Consultants and
Non-Employee Directors (four-year vesting) under the Cheniere Energy, Inc.
Amended and Restated 2003 Stock Incentive Plan (Incorporated by reference
to Exhibit 10.93 to the Company’s Annual Report on Form 10-K (SEC File No.
001-16383), filed on February 27, 2007)
|
|
10.69*†
|
Indefinite
Term Employment Agreement, dated February 20, 2006, between Cheniere
International, Inc. and Jean Abiteboul; Letter Agreement, dated February
23, 2006, between Cheniere Energy, Inc. and Jean
|
|
Exhibit
No.
|
Description
|
|
|
Abiteboul;
Amendment to a Contract of Employment, dated March 20, 2007, between
Cheniere LNG Services SARL and Jean Abiteboul; and Amendment to Indefinite
Term Contract of Employment, dated January 18, 2008, between Cheniere LNG
Services and Jean Abiteboul (Incorporated by reference to Exhibit 10.94 to
the Company’s Annual Report on Form 10-K (SEC File No. 001-16383), filed
on February 27, 2009)
|
|
10.70†
|
Summary
of Compensation for Executive Officers.
|
|
10.71*†
|
Summary
of Compensation to Non-Employee Directors. (Incorporated by reference to
Exhibit 10.1 to the Company’s Current Report on Form 8-K (SEC File
No. 001-16383), filed on June 15, 2009)
|
|
10.72*†
|
Summary
of 2007 Performance Bonus Plan. (Incorporated by reference to Exhibit 10.1
to the Company’s Current Report on Form 8-K (SEC File No. 001-16383),
filed on April 5, 2007)
|
|
10.73*†
|
Summary
of Terms for Cheniere Energy, Inc. Incentive Compensation Plan for
Executive Committee Members and Other Key Employees. (Incorporated by
reference to Exhibit 10.3 to the Company’s Current Report on Form 8-K (SEC
File No. 001-16383), filed on June 1, 2007)
|
|
10.74*†
|
Cheniere
Energy, Inc. 2008 Short-Term Retention Plan. (Incorporated by reference to
Exhibit 10.1 to the Company’s Current Report on Form 8-K (SEC File No.
001-16383), filed on May 14, 2008)
|
|
10.75*†
|
Form
of Cheniere Energy, Inc. 2008 Short-Term Retention Plan Restricted Stock
Grant. (Incorporated by reference to Exhibit 10.2 to the Company’s Current
Report on Form 8-K (SEC File No. 001-16383), filed on May 14,
2008)
|
|
10.76*†
|
Cheniere
Energy, Inc. 2008 Long-Term Retention Plan. (Incorporated by reference to
Exhibit 10.3 to the Company’s Current Report on Form 8-K (SEC File No.
001-16383), filed on May 14, 2008)
|
|
10.77*†
|
Form
of Cheniere Energy, Inc. 2008 Long-Term Retention Plan Restricted Stock
Grant. (Incorporated by reference to Exhibit 10.4 to the Company’s Current
Report on Form 8-K (SEC File No. 001-16383), filed on May 14,
2008)
|
|
10.78*†
|
Cheniere
Energy, Inc. 2008 Change of Control Cash Payment Plan. (Incorporated by
reference to Exhibit 10.5 to the Company’s Current Report on Form 8-K (SEC
File No. 001-16383), filed on May 14, 2008)
|
|
10.79*†
|
Form
of Change of Control Agreement. (Incorporated by reference to Exhibit 10.6
to the Company’s Current Report on Form 8-K (SEC File No. 001-16383),
filed on May 14, 2008)
|
|
10.80*†
|
Form
of Release and Separation Agreement. (Incorporated by reference to Exhibit
10.7 to the Company’s Current Report on Form 8-K (SEC File No. 001-16383),
filed on May 14, 2008)
|
|
10.81*†
|
Form
of Restricted Stock Grant for Senior Vice President and General Counsel.
(Incorporated by reference to Exhibit 10.8 to the Company’s Current Report
on Form 8-K (SEC File No. 001-16383), filed on May 14,
2008)
|
|
10.82*†
|
Form
of 2009 Phantom Stock Grant (Incorporated by reference to Exhibit 10.1 to
the Company’s Current Report on Form 8-K (SEC File No. 001-16383), filed
on February 27, 2009)
|
|
10.83*†
|
Form
of Indemnification Agreement for directors of Cheniere Energy, Inc.
(Incorporated by reference to Exhibit 10.1 to the Company’s Current Report
on Form 8-K (SEC File No. 001-16383), filed on December 19,
2008)
|
|
10.84*†
|
Form
of Indemnification Agreement for officers of Cheniere Energy, Inc.
(Incorporated by reference to Exhibit 10.1 to the Company’s Current Report
on Form 8-K (SEC File No. 001-16383), filed on April 6,
2009)
|
|
10.85*†
|
Charif
Souki’s U.K. Assignment Letter effective July 1, 2009 (Incorporated by
reference to Exhibit 10.1 to the Company’s Current Report on Form 8-K (SEC
File No. 001-16383), filed on July 2, 2009)
|
|
21.1
|
Subsidiaries
of Cheniere Energy, Inc.
|
|
23.1
|
Consent
of Ernst & Young LLP
|
|
31.1
|
Certification
by Chief Executive Officer required by Rule 13a-14(a) and 15d-14(a) under
the Exchange Act
|
|
31.2
|
Certification
by Chief Financial Officer required by Rule 13a-14(a) and 15d-14(a) under
the Exchange Act
|
|
Exhibit
No.
|
Description
|
|
32.1
|
Certification
by Chief Executive Officer pursuant to 18 U.S.C. Section 1350, as adopted
pursuant to Section 906 of the Sarbanes-Oxley Act of
2002
|
|
32.2
|
Certification
of Chief Financial Officer pursuant to 18 U.S.C. Section 1350, as adopted
pursuant to Section 906 of the Sarbanes-Oxley Act of
2002
|
|
*
|
Incorporated
by reference
|
|
†
|
Management
contract or compensatory plan or
arrangement
|
|
December
31,
|
|||||||
|
2009
|
2008
|
||||||
|
ASSETS
|
(As
adjusted)
|
||||||
|
CURRENT
ASSETS
|
|||||||
|
Cash
and cash equivalents
|
$
|
—
|
$
|
9,152
|
|||
|
Prepaid
expenses and other
|
—
|
20
|
|||||
|
Total
current assets
|
—
|
9,172
|
|||||
|
DEBT
RECEIVABLE—AFFILIATES
|
649,785
|
615,571
|
|||||
|
OTHER
|
1,298
|
2,833
|
|||||
|
Total
assets
|
$
|
651,083
|
$
|
627,576
|
|||
|
LIABILITIES
AND STOCKHOLDERS’ (DEFICIT) EQUITY
|
|||||||
|
CURRENT
LIABILITIES
|
$
|
1,953
|
$
|
3,080
|
|||
|
LONG-TERM
DEBT
|
165,132
|
242,635
|
|||||
|
LONG-TERM
DEBT—AFFILIATE
|
439,500
|
401,308
|
|||||
|
INVESTMENT
IN AND EQUITY IN LOSSES OF AFFILIATES
|
476,625
|
254,607
|
|||||
|
COMMITMENTS
AND CONTINGENCIES
|
—
|
—
|
|||||
|
STOCKHOLDERS’
(DEFICIT) EQUITY
|
(432,127
|
)
|
(274,054
|
)
|
|||
|
Total
liabilities and stockholders’ equity
|
$
|
651,083
|
$
|
627,576
|
|||
|
Year
Ended December 31,
|
||||||||||||
|
2009
|
2008
|
2007
|
||||||||||
|
(As
adjusted)
|
(As
adjusted)
|
|||||||||||
|
Revenues
|
$ | — | $ | — | $ | — | ||||||
|
Operating
costs and expenses
|
422 | 170 | 60 | |||||||||
|
Loss
from operations
|
(422 | ) | (170 | ) | (60 | ) | ||||||
|
Gain
on early extinguishment of debt
|
45,362 | — | — | |||||||||
|
Interest
expense, net
|
(21,312 | ) | (25,186 | ) | (23,501 | ) | ||||||
|
Interest
income
|
12 | 988 | 3,336 | |||||||||
|
Interest
income—affiliates
|
34,213 | 40,363 | 34,213 | |||||||||
|
Interest
expense—affiliates
|
(38,192 | ) | (44,341 | ) | (22,496 | ) | ||||||
|
Equity
losses of affiliates
|
(181,151 | ) | (344,613 | ) | (188,082 | ) | ||||||
|
Other
income
|
— | — | 10 | |||||||||
|
Income
tax (provision) benefit
|
— | — | — | |||||||||
|
Net
loss
|
$ | (161,490 | ) | $ | (372,959 | ) | $ | (196,580 | ) | |||
|
Year
Ended December 31,
|
||||||||||||
|
2009
|
2008
|
2007
|
||||||||||
|
(As
Adjusted)
|
(As
Adjusted)
|
|||||||||||
|
NET
CASH USED IN OPERATING ACTIVITIES
|
$ | (6,773 | ) | $ | (23,127 | ) | $ | (33,348 | ) | |||
|
CASH
FLOWS FROM INVESTING ACTIVITIES:
|
||||||||||||
|
Return
of capital from (investments in) affiliates
|
28,635 | (10,236 | ) | 10,488 | ||||||||
|
NET
CASH PROVIDED BY (USED IN) INVESTING ACTIVITIES
|
$ | 28,635 | $ | (10,236 | ) | $ | 10,488 | |||||
|
CASH
FLOWS FROM FINANCING ACTIVITIES:
|
||||||||||||
|
Borrowings
from long-term debt
|
— | — | 391,708 | |||||||||
|
Purchase
of treasury shares
|
(985 | ) | (4,887 | ) | (325,062 | ) | ||||||
|
Repurchase
of long-term debt
|
(30,029 | ) | — | — | ||||||||
|
Sale
of common stock
|
— | 472 | 3,158 | |||||||||
|
Issuance
of restricted stock
|
— | (15 | ) | — | ||||||||
|
NET
CASH PROVIDED BY (USED IN) FINANCING ACTIVITIES
|
$ | (31,014 | ) | $ | (4,430 | ) | $ | 69,804 | ||||
|
NET
INCREASE (DECREASE) IN CASH AND CASH EQUIVALENTS
|
(9,152 | ) | (37,793 | ) | 46,944 | |||||||
|
CASH
AND CASH EQUIVALENTS—BEGINNING OF YEAR
|
9,152 | 46,945 | 1 | |||||||||
|
CASH
AND CASH EQUIVALENTS—END OF YEAR
|
$ | — | $ | 9,152 | $ | 46,945 | ||||||
|
December
31,
|
||||||||
|
2009
|
2008
|
|||||||
|
(As
Adjusted)
|
||||||||
|
Convertible
Senior Unsecured Notes
|
$ | 165,132 | $ | 242,635 | ||||
|
Long-Term
Note—Affiliate
|
439,500 | 401,308 | ||||||
|
Total
Long-Term Debt
|
$ | 604,632 | $ | 643,943 | ||||
|
Payments Due for Years Ended
December 31, (1)
|
||||||||||||||||||||
|
Total
|
2010
|
2011
to 2012
|
2013
to 2014
|
Thereafter
|
||||||||||||||||
|
Convertible
Senior Unsecured Notes
|
$ | 204,630 | $ | — | $ | 204,630 | $ | — | $ | — | ||||||||||
|
Long-Term
Note-Affiliate
|
439,500 | — | 439,500 | — | — | |||||||||||||||
|
Total
|
$ | 644,130 | $ | — | $ | 644,130 | $ | — | $ | — | ||||||||||
|
(1)
|
Based on the total debt balance,
scheduled maturities and interest rates in effect at December 31, 2009,
our cash payments for interest would be $47.5 million in 2010, $47.5
million in 2011 and $20.5 million in 2012 for a total of $115.5
million.
|
|
Year
Ended December 31,
|
|||||||||
|
2009
|
2008
|
2007
|
|||||||
|
(in
thousands)
|
|||||||||
|
Non-cash
capital contributions (1)
|
$
|
181,151
|
$
|
344,613
|
$
|
188,082
|
|||
|
(1)
|
Amounts
represent equity losses of affiliates not funded by
Cheniere.
|
|
CHENIERE ENERGY, INC.
|
||
|
(Registrant)
|
||
|
By:
|
/s/ CHARIF SOUKI
|
|
|
Charif
Souki
Chief
Executive Officer, President and
Chairman
of the Board
|
||
|
|
Date:
February 25, 2010
|
|
Signature
|
Title
|
Date
|
|
/s/ CHARIF SOUKI
|
Chief
Executive Officer, President &
Chairman
of the Board (Principal Executive Officer)
|
February 25,
2009
|
|
Charif
Souki
|
||
|
/s/ MEG A. GENTLE
|
Senior
Vice President & Chief
Financial
Officer (Principal Financial Officer)
|
February 25,
2009
|
|
Meg
A. Gentle
|
||
|
/s/ JERRY D. SMITH
|
Vice
President and Chief Accounting Officer
(Principal
Accounting Officer)
|
February 25,
2009
|
|
Jerry
D. Smith
|
||
|
/s/ VICKY A. BAILEY
|
Director
|
February 25,
2009
|
|
Vicky
A. Bailey
|
||
|
/s/ NUNO BRANDOLINI
|
Director
|
February 25,
2009
|
|
Nuno
Brandolini
|
||
|
/s/ KEITH F. CARNEY
|
Director
|
February 25,
2009
|
|
Keith
F. Carney
|
||
|
/s/ JOHN DEUTCH
|
Director
|
February 25,
2009
|
|
John
Deutch
|
||
|
/s/ PAUL J. HOENMANS
|
Director
|
February 25,
2009
|
|
Paul
J. Hoenmans
|
||
|
/s/ DAVID B. KILPATRICK
|
Director
|
February 25,
2009
|
|
David
B. Kilpatrick
|
||
|
/s/ JASON NEW
|
Director
|
February 25,
2009
|
|
Jason
New
|
||
|
/s/ D. DWIGHT SCOTT
|
Director
|
February 25,
2009
|
|
D.
Dwight Scott
|
||
|
/s/ J.
ROBINSON WEST
|
Director
|
February 25,
2009
|
|
J.
Robinson West
|
||
|
/s/ WALTER L. WILLIAMS
|
Director
|
February 25,
2009
|
|
Walter
L. Williams
|