0000003570false--12-312022Q1100000035702022-01-012022-03-3100000035702022-04-29xbrli:shares0000003570lng:LiquefiedNaturalGasMember2022-01-012022-03-31iso4217:USD0000003570lng:LiquefiedNaturalGasMember2021-01-012021-03-310000003570lng:RegasificationServiceMember2022-01-012022-03-310000003570lng:RegasificationServiceMember2021-01-012021-03-310000003570us-gaap:ProductAndServiceOtherMember2022-01-012022-03-310000003570us-gaap:ProductAndServiceOtherMember2021-01-012021-03-3100000035702021-01-012021-03-31iso4217:USDxbrli:shares00000035702022-03-3100000035702021-12-310000003570lng:CheniereEnergyPartnersLPMember2022-03-310000003570us-gaap:CommonStockMember2021-12-310000003570us-gaap:TreasuryStockMember2021-12-310000003570us-gaap:AdditionalPaidInCapitalMember2021-12-310000003570us-gaap:RetainedEarningsMember2021-12-310000003570us-gaap:NoncontrollingInterestMember2021-12-310000003570us-gaap:CommonStockMember2022-01-012022-03-310000003570us-gaap:TreasuryStockMember2022-01-012022-03-310000003570us-gaap:AdditionalPaidInCapitalMember2022-01-012022-03-310000003570us-gaap:RetainedEarningsMember2022-01-012022-03-310000003570us-gaap:NoncontrollingInterestMember2022-01-012022-03-310000003570us-gaap:CommonStockMember2022-03-310000003570us-gaap:TreasuryStockMember2022-03-310000003570us-gaap:AdditionalPaidInCapitalMember2022-03-310000003570us-gaap:RetainedEarningsMember2022-03-310000003570us-gaap:NoncontrollingInterestMember2022-03-3100000035702020-12-310000003570us-gaap:CommonStockMember2020-12-310000003570us-gaap:TreasuryStockMember2020-12-310000003570us-gaap:AdditionalPaidInCapitalMember2020-12-310000003570us-gaap:RetainedEarningsMember2020-12-310000003570us-gaap:NoncontrollingInterestMember2020-12-310000003570us-gaap:CommonStockMember2021-01-012021-03-310000003570us-gaap:TreasuryStockMember2021-01-012021-03-310000003570us-gaap:AdditionalPaidInCapitalMember2021-01-012021-03-310000003570us-gaap:RetainedEarningsMember2021-01-012021-03-310000003570us-gaap:NoncontrollingInterestMember2021-01-012021-03-3100000035702021-03-310000003570us-gaap:CommonStockMember2021-03-310000003570us-gaap:TreasuryStockMember2021-03-310000003570us-gaap:AdditionalPaidInCapitalMember2021-03-310000003570us-gaap:RetainedEarningsMember2021-03-310000003570us-gaap:NoncontrollingInterestMember2021-03-31lng:unit0000003570lng:SabinePassLNGTerminalMember2022-01-012022-03-31lng:trainslng:milliontonnesutr:Ylng:item0000003570lng:CreoleTrailPipelineMember2022-01-012022-03-31utr:mi0000003570lng:CheniereEnergyPartnersLPMember2022-01-012022-03-31xbrli:pure0000003570lng:CorpusChristiLNGTerminalMember2022-01-012022-03-310000003570lng:CorpusChristiPipelineMember2022-01-012022-03-310000003570srt:MaximumMemberlng:CorpusChristiLNGTerminalExpansionMember2022-01-012022-03-310000003570srt:MinimumMemberlng:CorpusChristiLNGTerminalExpansionMember2022-01-012022-03-310000003570lng:A2045ConvertibleSeniorNotesMember2022-03-310000003570us-gaap:AccountingStandardsUpdate202006Memberlng:A2045ConvertibleSeniorNotesMembersrt:CumulativeEffectPeriodOfAdoptionAdjustmentMember2022-01-010000003570us-gaap:AccountingStandardsUpdate202006Memberlng:A2045ConvertibleSeniorNotesMemberus-gaap:AdditionalPaidInCapitalMembersrt:CumulativeEffectPeriodOfAdoptionAdjustmentMember2022-01-012022-01-010000003570us-gaap:AccountingStandardsUpdate202006Memberlng:A2045ConvertibleSeniorNotesMembersrt:CumulativeEffectPeriodOfAdoptionAdjustmentMemberus-gaap:RetainedEarningsMember2022-01-012022-01-010000003570lng:A2045ConvertibleSeniorNotesMember2022-01-012022-03-310000003570lng:SPLProjectMember2022-03-310000003570lng:SPLProjectMember2021-12-310000003570lng:CCLProjectMember2022-03-310000003570lng:CCLProjectMember2021-12-310000003570lng:SubsidiaryCashMember2022-03-310000003570lng:SubsidiaryCashMember2021-12-310000003570lng:SabinePassLiquefactionAndCorpusChristiLiquefactionMember2022-03-310000003570lng:SabinePassLiquefactionAndCorpusChristiLiquefactionMember2021-12-310000003570lng:CheniereMarketingLLCMember2022-03-310000003570lng:CheniereMarketingLLCMember2021-12-310000003570lng:MaterialsInventoryMember2022-03-310000003570lng:MaterialsInventoryMember2021-12-310000003570lng:LiquefiedNaturalGasInTransitInventoryMember2022-03-310000003570lng:LiquefiedNaturalGasInTransitInventoryMember2021-12-310000003570lng:LiquefiedNaturalGasInventoryMember2022-03-310000003570lng:LiquefiedNaturalGasInventoryMember2021-12-310000003570lng:NaturalGasInventoryMember2022-03-310000003570lng:NaturalGasInventoryMember2021-12-310000003570lng:OtherInventoryMember2022-03-310000003570lng:OtherInventoryMember2021-12-310000003570lng:LngTerminalMember2022-03-310000003570lng:LngTerminalMember2021-12-310000003570lng:LngSiteAndRelatedCostsNetMember2022-03-310000003570lng:LngSiteAndRelatedCostsNetMember2021-12-310000003570us-gaap:ConstructionInProgressMember2022-03-310000003570us-gaap:ConstructionInProgressMember2021-12-310000003570lng:LngTerminalCostsMember2022-03-310000003570lng:LngTerminalCostsMember2021-12-310000003570us-gaap:OfficeEquipmentMember2022-03-310000003570us-gaap:OfficeEquipmentMember2021-12-310000003570us-gaap:FurnitureAndFixturesMember2022-03-310000003570us-gaap:FurnitureAndFixturesMember2021-12-310000003570us-gaap:SoftwareAndSoftwareDevelopmentCostsMember2022-03-310000003570us-gaap:SoftwareAndSoftwareDevelopmentCostsMember2021-12-310000003570us-gaap:LeaseholdImprovementsMember2022-03-310000003570us-gaap:LeaseholdImprovementsMember2021-12-310000003570us-gaap:LandMember2022-03-310000003570us-gaap:LandMember2021-12-310000003570us-gaap:OtherCapitalizedPropertyPlantAndEquipmentMember2022-03-310000003570us-gaap:OtherCapitalizedPropertyPlantAndEquipmentMember2021-12-310000003570lng:FixedAssetsMember2022-03-310000003570lng:FixedAssetsMember2021-12-310000003570us-gaap:AssetsHeldUnderCapitalLeasesMember2022-03-310000003570us-gaap:AssetsHeldUnderCapitalLeasesMember2021-12-310000003570lng:CCHInterestRateDerivativesMemberus-gaap:FairValueInputsLevel1Member2022-03-310000003570lng:CCHInterestRateDerivativesMemberus-gaap:FairValueInputsLevel2Member2022-03-310000003570lng:CCHInterestRateDerivativesMemberus-gaap:FairValueInputsLevel3Member2022-03-310000003570lng:CCHInterestRateDerivativesMember2022-03-310000003570lng:CCHInterestRateDerivativesMemberus-gaap:FairValueInputsLevel1Member2021-12-310000003570lng:CCHInterestRateDerivativesMemberus-gaap:FairValueInputsLevel2Member2021-12-310000003570lng:CCHInterestRateDerivativesMemberus-gaap:FairValueInputsLevel3Member2021-12-310000003570lng:CCHInterestRateDerivativesMember2021-12-310000003570us-gaap:FairValueInputsLevel1Memberus-gaap:PriceRiskDerivativeMember2022-03-310000003570us-gaap:PriceRiskDerivativeMemberus-gaap:FairValueInputsLevel2Member2022-03-310000003570us-gaap:FairValueInputsLevel3Memberus-gaap:PriceRiskDerivativeMember2022-03-310000003570us-gaap:PriceRiskDerivativeMember2022-03-310000003570us-gaap:FairValueInputsLevel1Memberus-gaap:PriceRiskDerivativeMember2021-12-310000003570us-gaap:PriceRiskDerivativeMemberus-gaap:FairValueInputsLevel2Member2021-12-310000003570us-gaap:FairValueInputsLevel3Memberus-gaap:PriceRiskDerivativeMember2021-12-310000003570us-gaap:PriceRiskDerivativeMember2021-12-310000003570us-gaap:FairValueInputsLevel1Memberlng:LNGTradingDerivativeMember2022-03-310000003570lng:LNGTradingDerivativeMemberus-gaap:FairValueInputsLevel2Member2022-03-310000003570lng:LNGTradingDerivativeMemberus-gaap:FairValueInputsLevel3Member2022-03-310000003570lng:LNGTradingDerivativeMember2022-03-310000003570us-gaap:FairValueInputsLevel1Memberlng:LNGTradingDerivativeMember2021-12-310000003570lng:LNGTradingDerivativeMemberus-gaap:FairValueInputsLevel2Member2021-12-310000003570lng:LNGTradingDerivativeMemberus-gaap:FairValueInputsLevel3Member2021-12-310000003570lng:LNGTradingDerivativeMember2021-12-310000003570us-gaap:FairValueInputsLevel1Memberus-gaap:ForeignExchangeContractMember2022-03-310000003570us-gaap:FairValueInputsLevel2Memberus-gaap:ForeignExchangeContractMember2022-03-310000003570us-gaap:FairValueInputsLevel3Memberus-gaap:ForeignExchangeContractMember2022-03-310000003570us-gaap:ForeignExchangeContractMember2022-03-310000003570us-gaap:FairValueInputsLevel1Memberus-gaap:ForeignExchangeContractMember2021-12-310000003570us-gaap:FairValueInputsLevel2Memberus-gaap:ForeignExchangeContractMember2021-12-310000003570us-gaap:FairValueInputsLevel3Memberus-gaap:ForeignExchangeContractMember2021-12-310000003570us-gaap:ForeignExchangeContractMember2021-12-310000003570us-gaap:FairValueInputsLevel3Memberlng:PhysicalLiquefactionSupplyDerivativesMember2022-03-310000003570us-gaap:MarketApproachValuationTechniqueMemberus-gaap:FairValueInputsLevel3Membersrt:MinimumMemberlng:PhysicalLiquefactionSupplyDerivativesMember2022-01-012022-03-310000003570srt:MaximumMemberus-gaap:MarketApproachValuationTechniqueMemberus-gaap:FairValueInputsLevel3Memberlng:PhysicalLiquefactionSupplyDerivativesMember2022-01-012022-03-310000003570us-gaap:MarketApproachValuationTechniqueMemberus-gaap:FairValueInputsLevel3Membersrt:WeightedAverageMemberlng:PhysicalLiquefactionSupplyDerivativesMember2022-01-012022-03-310000003570us-gaap:FairValueInputsLevel3Membersrt:MinimumMemberlng:PhysicalLiquefactionSupplyDerivativesMemberus-gaap:ValuationTechniqueOptionPricingModelMember2022-01-012022-03-310000003570srt:MaximumMemberus-gaap:FairValueInputsLevel3Memberlng:PhysicalLiquefactionSupplyDerivativesMemberus-gaap:ValuationTechniqueOptionPricingModelMember2022-01-012022-03-310000003570us-gaap:FairValueInputsLevel3Membersrt:WeightedAverageMemberlng:PhysicalLiquefactionSupplyDerivativesMemberus-gaap:ValuationTechniqueOptionPricingModelMember2022-01-012022-03-310000003570lng:PhysicalLiquefactionSupplyDerivativesAndPhysicalLNGTradingDerivativeMember2021-12-310000003570lng:PhysicalLiquefactionSupplyDerivativesAndPhysicalLNGTradingDerivativeMember2020-12-310000003570lng:PhysicalLiquefactionSupplyDerivativesAndPhysicalLNGTradingDerivativeMember2022-01-012022-03-310000003570lng:PhysicalLiquefactionSupplyDerivativesAndPhysicalLNGTradingDerivativeMember2021-01-012021-03-310000003570lng:PhysicalLiquefactionSupplyDerivativesAndPhysicalLNGTradingDerivativeMember2022-03-310000003570lng:PhysicalLiquefactionSupplyDerivativesAndPhysicalLNGTradingDerivativeMember2021-03-310000003570us-gaap:InterestRateContractMember2022-01-012022-03-310000003570lng:CCHInterestRateDerivativesMember2022-01-012022-03-310000003570lng:CCHInterestRateDerivativesMemberus-gaap:GainLossOnDerivativeInstrumentsMember2022-01-012022-03-310000003570lng:CCHInterestRateDerivativesMemberus-gaap:GainLossOnDerivativeInstrumentsMember2021-01-012021-03-310000003570srt:MaximumMemberlng:PhysicalLiquefactionSupplyDerivativesMember2022-01-012022-03-310000003570srt:MaximumMemberlng:FinancialLiquefactionSupplyDerivativesMember2022-01-012022-03-310000003570srt:MaximumMemberlng:LNGTradingDerivativeMember2022-01-012022-03-310000003570us-gaap:CommodityContractMember2022-01-012022-03-31lng:tbtu0000003570us-gaap:SalesMemberlng:LNGTradingDerivativeMember2022-01-012022-03-310000003570us-gaap:SalesMemberlng:LNGTradingDerivativeMember2021-01-012021-03-310000003570lng:LNGTradingDerivativeMemberus-gaap:CostOfSalesMember2022-01-012022-03-310000003570lng:LNGTradingDerivativeMemberus-gaap:CostOfSalesMember2021-01-012021-03-310000003570us-gaap:SalesMemberus-gaap:PriceRiskDerivativeMember2022-01-012022-03-310000003570us-gaap:SalesMemberus-gaap:PriceRiskDerivativeMember2021-01-012021-03-310000003570us-gaap:PriceRiskDerivativeMemberus-gaap:CostOfSalesMember2022-01-012022-03-310000003570us-gaap:PriceRiskDerivativeMemberus-gaap:CostOfSalesMember2021-01-012021-03-310000003570srt:MaximumMemberus-gaap:ForeignExchangeContractMember2022-01-012022-03-310000003570us-gaap:ForeignExchangeContractMember2022-01-012022-03-310000003570us-gaap:SalesMemberus-gaap:ForeignExchangeContractMember2022-01-012022-03-310000003570us-gaap:SalesMemberus-gaap:ForeignExchangeContractMember2021-01-012021-03-310000003570lng:CCHInterestRateDerivativesMemberus-gaap:DerivativeFinancialInstrumentsAssetsMember2022-03-310000003570us-gaap:PriceRiskDerivativeMemberus-gaap:DerivativeFinancialInstrumentsAssetsMember2022-03-310000003570lng:LNGTradingDerivativeMemberus-gaap:DerivativeFinancialInstrumentsAssetsMember2022-03-310000003570us-gaap:DerivativeFinancialInstrumentsAssetsMemberus-gaap:ForeignExchangeContractMember2022-03-310000003570us-gaap:DerivativeFinancialInstrumentsAssetsMember2022-03-310000003570lng:CCHInterestRateDerivativesMemberlng:NoncurrentDerivativeAssetsMember2022-03-310000003570lng:NoncurrentDerivativeAssetsMemberus-gaap:PriceRiskDerivativeMember2022-03-310000003570lng:LNGTradingDerivativeMemberlng:NoncurrentDerivativeAssetsMember2022-03-310000003570lng:NoncurrentDerivativeAssetsMemberus-gaap:ForeignExchangeContractMember2022-03-310000003570lng:NoncurrentDerivativeAssetsMember2022-03-310000003570lng:CCHInterestRateDerivativesMemberus-gaap:DerivativeFinancialInstrumentsLiabilitiesMember2022-03-310000003570us-gaap:DerivativeFinancialInstrumentsLiabilitiesMemberus-gaap:PriceRiskDerivativeMember2022-03-310000003570lng:LNGTradingDerivativeMemberus-gaap:DerivativeFinancialInstrumentsLiabilitiesMember2022-03-310000003570us-gaap:DerivativeFinancialInstrumentsLiabilitiesMemberus-gaap:ForeignExchangeContractMember2022-03-310000003570us-gaap:DerivativeFinancialInstrumentsLiabilitiesMember2022-03-310000003570lng:CCHInterestRateDerivativesMemberlng:NoncurrentDerivativeLiabilitiesMember2022-03-310000003570lng:NoncurrentDerivativeLiabilitiesMemberus-gaap:PriceRiskDerivativeMember2022-03-310000003570lng:NoncurrentDerivativeLiabilitiesMemberlng:LNGTradingDerivativeMember2022-03-310000003570lng:NoncurrentDerivativeLiabilitiesMemberus-gaap:ForeignExchangeContractMember2022-03-310000003570lng:NoncurrentDerivativeLiabilitiesMember2022-03-310000003570lng:CCHInterestRateDerivativesMemberus-gaap:DerivativeFinancialInstrumentsAssetsMember2021-12-310000003570us-gaap:PriceRiskDerivativeMemberus-gaap:DerivativeFinancialInstrumentsAssetsMember2021-12-310000003570lng:LNGTradingDerivativeMemberus-gaap:DerivativeFinancialInstrumentsAssetsMember2021-12-310000003570us-gaap:DerivativeFinancialInstrumentsAssetsMemberus-gaap:ForeignExchangeContractMember2021-12-310000003570us-gaap:DerivativeFinancialInstrumentsAssetsMember2021-12-310000003570lng:CCHInterestRateDerivativesMemberlng:NoncurrentDerivativeAssetsMember2021-12-310000003570lng:NoncurrentDerivativeAssetsMemberus-gaap:PriceRiskDerivativeMember2021-12-310000003570lng:LNGTradingDerivativeMemberlng:NoncurrentDerivativeAssetsMember2021-12-310000003570lng:NoncurrentDerivativeAssetsMemberus-gaap:ForeignExchangeContractMember2021-12-310000003570lng:NoncurrentDerivativeAssetsMember2021-12-310000003570lng:CCHInterestRateDerivativesMemberus-gaap:DerivativeFinancialInstrumentsLiabilitiesMember2021-12-310000003570us-gaap:DerivativeFinancialInstrumentsLiabilitiesMemberus-gaap:PriceRiskDerivativeMember2021-12-310000003570lng:LNGTradingDerivativeMemberus-gaap:DerivativeFinancialInstrumentsLiabilitiesMember2021-12-310000003570us-gaap:DerivativeFinancialInstrumentsLiabilitiesMemberus-gaap:ForeignExchangeContractMember2021-12-310000003570us-gaap:DerivativeFinancialInstrumentsLiabilitiesMember2021-12-310000003570lng:CCHInterestRateDerivativesMemberlng:NoncurrentDerivativeLiabilitiesMember2021-12-310000003570lng:NoncurrentDerivativeLiabilitiesMemberus-gaap:PriceRiskDerivativeMember2021-12-310000003570lng:NoncurrentDerivativeLiabilitiesMemberlng:LNGTradingDerivativeMember2021-12-310000003570lng:NoncurrentDerivativeLiabilitiesMemberus-gaap:ForeignExchangeContractMember2021-12-310000003570lng:NoncurrentDerivativeLiabilitiesMember2021-12-310000003570lng:PriceRiskDerivativeAssetMember2022-03-310000003570lng:LNGTradingDerivativeAssetMember2022-03-310000003570lng:ForeignExchangeContractAssetMember2022-03-310000003570lng:PriceRiskDerivativeLiabilityMember2022-03-310000003570lng:LNGTradingDerivativesLiabilityMember2022-03-310000003570lng:ForeignExchangeContractLiabilityMember2022-03-310000003570lng:PriceRiskDerivativeAssetMember2021-12-310000003570lng:LNGTradingDerivativeAssetMember2021-12-310000003570lng:ForeignExchangeContractAssetMember2021-12-310000003570lng:PriceRiskDerivativeLiabilityMember2021-12-310000003570lng:LNGTradingDerivativesLiabilityMember2021-12-310000003570lng:ForeignExchangeContractLiabilityMember2021-12-310000003570lng:CheniereEnergyPartnersLPMemberlng:CommonUnitsMember2022-03-310000003570lng:CheniereEnergyPartnersLPMember2022-01-012022-03-310000003570lng:CheniereEnergyPartnersLPMember2021-12-310000003570lng:A2023SabinePassLiquefactionSeniorNotesMember2022-03-310000003570lng:A2023SabinePassLiquefactionSeniorNotesMember2021-12-310000003570lng:A2024SabinePassLiquefactionSeniorNotesMember2022-03-310000003570lng:A2024SabinePassLiquefactionSeniorNotesMember2021-12-310000003570lng:A2025SabinePassLiquefactionSeniorNotesMember2022-03-310000003570lng:A2025SabinePassLiquefactionSeniorNotesMember2021-12-310000003570lng:A2026SabinePassLiquefactionSeniorNotesMember2022-03-310000003570lng:A2026SabinePassLiquefactionSeniorNotesMember2021-12-310000003570lng:A2027SabinePassLiquefactionSeniorNotesMember2022-03-310000003570lng:A2027SabinePassLiquefactionSeniorNotesMember2021-12-310000003570lng:A2028SabinePassLiquefactionSeniorNotesMember2022-03-310000003570lng:A2028SabinePassLiquefactionSeniorNotesMember2021-12-310000003570lng:A2030SabinePassLiquefactionSeniorNotesMember2022-03-310000003570lng:A2030SabinePassLiquefactionSeniorNotesMember2021-12-310000003570srt:WeightedAverageMemberlng:A2037SabinePassLiquefactionNotesMember2022-03-310000003570lng:A2037SabinePassLiquefactionNotesMember2022-03-310000003570lng:A2037SabinePassLiquefactionNotesMember2021-12-310000003570lng:SabinePassLiquefactionSeniorNotesMember2022-03-310000003570lng:SabinePassLiquefactionSeniorNotesMember2021-12-310000003570lng:A2020SPLWorkingCapitalFacilityMember2022-03-310000003570lng:A2020SPLWorkingCapitalFacilityMember2021-12-310000003570lng:SabinePassLiquefactionMember2022-03-310000003570lng:SabinePassLiquefactionMember2021-12-310000003570lng:A2029CheniereEnergyPartnersSeniorNotesMember2022-03-310000003570lng:A2029CheniereEnergyPartnersSeniorNotesMember2021-12-310000003570lng:A2031CheniereEnergyPartnersSeniorNotesMember2022-03-310000003570lng:A2031CheniereEnergyPartnersSeniorNotesMember2021-12-310000003570lng:A2032CheniereEnergyPartnersSeniorNotesMember2022-03-310000003570lng:A2032CheniereEnergyPartnersSeniorNotesMember2021-12-310000003570lng:CheniereEnergyPartnersSeniorNotesMember2022-03-310000003570lng:CheniereEnergyPartnersSeniorNotesMember2021-12-310000003570lng:A2019CQPCreditFacilitiesMember2022-03-310000003570lng:A2019CQPCreditFacilitiesMember2021-12-310000003570lng:A2024CorpusChristiHoldingsSeniorNotesMember2022-03-310000003570lng:A2024CorpusChristiHoldingsSeniorNotesMember2021-12-310000003570lng:A2025CorpusChristiHoldingsSeniorNotesMember2022-03-310000003570lng:A2025CorpusChristiHoldingsSeniorNotesMember2021-12-310000003570lng:A2027CorpusChristiHoldingsSeniorNotesMember2022-03-310000003570lng:A2027CorpusChristiHoldingsSeniorNotesMember2021-12-310000003570lng:A2029CorpusChristiHoldingsSeniorNotesMember2022-03-310000003570lng:A2029CorpusChristiHoldingsSeniorNotesMember2021-12-310000003570lng:A2039CorpusChristiHoldingsSeniorNotesMembersrt:WeightedAverageMember2022-03-310000003570lng:A2039CorpusChristiHoldingsSeniorNotesMember2022-03-310000003570lng:A2039CorpusChristiHoldingsSeniorNotesMember2021-12-310000003570lng:CorpusChristiHoldingsSeniorNotesMember2022-03-310000003570lng:CorpusChristiHoldingsSeniorNotesMember2021-12-310000003570lng:A2015CCHTermLoanFacilityMember2022-03-310000003570lng:A2015CCHTermLoanFacilityMember2021-12-310000003570lng:CorpusChristiHoldingsWorkingCapitalFacilityMember2022-03-310000003570lng:CorpusChristiHoldingsWorkingCapitalFacilityMember2021-12-310000003570lng:CheniereCorpusChristiHoldingsLLCMember2022-03-310000003570lng:CheniereCorpusChristiHoldingsLLCMember2021-12-310000003570lng:A2028CheniereSeniorSecuredNotesMember2022-03-310000003570lng:A2028CheniereSeniorSecuredNotesMember2021-12-310000003570lng:A2045ConvertibleSeniorNotesMember2021-12-310000003570lng:CheniereRevolvingCreditFacilityMember2022-03-310000003570lng:CheniereRevolvingCreditFacilityMember2021-12-310000003570srt:ParentCompanyMember2022-03-310000003570srt:ParentCompanyMember2021-12-310000003570lng:CheniereMarketingTradeFinanceFacilitiesMember2022-03-310000003570lng:CheniereMarketingTradeFinanceFacilitiesMember2021-12-310000003570srt:MinimumMemberus-gaap:LondonInterbankOfferedRateLIBORMemberlng:A2020SPLWorkingCapitalFacilityMember2022-01-012022-03-31utr:Rate0000003570srt:MaximumMemberus-gaap:LondonInterbankOfferedRateLIBORMemberlng:A2020SPLWorkingCapitalFacilityMember2022-01-012022-03-310000003570us-gaap:BaseRateMembersrt:MinimumMemberlng:A2020SPLWorkingCapitalFacilityMember2022-01-012022-03-310000003570srt:MaximumMemberus-gaap:BaseRateMemberlng:A2020SPLWorkingCapitalFacilityMember2022-01-012022-03-310000003570srt:MinimumMemberus-gaap:LondonInterbankOfferedRateLIBORMemberlng:A2019CQPCreditFacilitiesMember2022-01-012022-03-310000003570srt:MaximumMemberus-gaap:LondonInterbankOfferedRateLIBORMemberlng:A2019CQPCreditFacilitiesMember2022-01-012022-03-310000003570us-gaap:BaseRateMembersrt:MinimumMemberlng:A2019CQPCreditFacilitiesMember2022-01-012022-03-310000003570srt:MaximumMemberus-gaap:BaseRateMemberlng:A2019CQPCreditFacilitiesMember2022-01-012022-03-310000003570lng:A2015CCHTermLoanFacilityMemberus-gaap:LondonInterbankOfferedRateLIBORMember2022-01-012022-03-310000003570lng:A2015CCHTermLoanFacilityMemberus-gaap:BaseRateMember2022-01-012022-03-310000003570srt:MinimumMemberlng:CorpusChristiHoldingsWorkingCapitalFacilityMemberus-gaap:LondonInterbankOfferedRateLIBORMember2022-01-012022-03-310000003570srt:MaximumMemberlng:CorpusChristiHoldingsWorkingCapitalFacilityMemberus-gaap:LondonInterbankOfferedRateLIBORMember2022-01-012022-03-310000003570us-gaap:BaseRateMembersrt:MinimumMemberlng:CorpusChristiHoldingsWorkingCapitalFacilityMember2022-01-012022-03-310000003570srt:MaximumMemberus-gaap:BaseRateMemberlng:CorpusChristiHoldingsWorkingCapitalFacilityMember2022-01-012022-03-310000003570srt:MinimumMemberlng:CheniereRevolvingCreditFacilityMemberus-gaap:LondonInterbankOfferedRateLIBORMember2022-01-012022-03-310000003570srt:MaximumMemberlng:CheniereRevolvingCreditFacilityMemberus-gaap:LondonInterbankOfferedRateLIBORMember2022-01-012022-03-310000003570us-gaap:BaseRateMembersrt:MinimumMemberlng:CheniereRevolvingCreditFacilityMember2022-01-012022-03-310000003570srt:MaximumMemberus-gaap:BaseRateMemberlng:CheniereRevolvingCreditFacilityMember2022-01-012022-03-310000003570lng:A2020SPLWorkingCapitalFacilityMember2022-01-012022-03-310000003570lng:A2019CQPCreditFacilitiesMember2022-01-012022-03-310000003570lng:CorpusChristiHoldingsWorkingCapitalFacilityMember2022-01-012022-03-310000003570lng:CheniereRevolvingCreditFacilityMember2022-01-012022-03-310000003570lng:A2015CCHTermLoanFacilityMember2022-01-012022-03-310000003570us-gaap:ConvertibleDebtMember2022-01-012022-03-310000003570us-gaap:ConvertibleDebtMember2021-01-012021-03-310000003570lng:DebtExcludingCapitalLeaseAndConvertibleDebtMember2022-01-012022-03-310000003570lng:DebtExcludingCapitalLeaseAndConvertibleDebtMember2021-01-012021-03-310000003570us-gaap:CarryingReportedAmountFairValueDisclosureMemberus-gaap:FairValueInputsLevel2Memberus-gaap:SeniorNotesMember2022-03-310000003570us-gaap:FairValueInputsLevel2Memberus-gaap:EstimateOfFairValueFairValueDisclosureMemberus-gaap:SeniorNotesMember2022-03-310000003570us-gaap:CarryingReportedAmountFairValueDisclosureMemberus-gaap:FairValueInputsLevel2Memberus-gaap:SeniorNotesMember2021-12-310000003570us-gaap:FairValueInputsLevel2Memberus-gaap:EstimateOfFairValueFairValueDisclosureMemberus-gaap:SeniorNotesMember2021-12-310000003570us-gaap:FairValueInputsLevel3Memberus-gaap:CarryingReportedAmountFairValueDisclosureMemberus-gaap:SeniorNotesMember2022-03-310000003570us-gaap:FairValueInputsLevel3Memberus-gaap:EstimateOfFairValueFairValueDisclosureMemberus-gaap:SeniorNotesMember2022-03-310000003570us-gaap:FairValueInputsLevel3Memberus-gaap:CarryingReportedAmountFairValueDisclosureMemberus-gaap:SeniorNotesMember2021-12-310000003570us-gaap:FairValueInputsLevel3Memberus-gaap:EstimateOfFairValueFairValueDisclosureMemberus-gaap:SeniorNotesMember2021-12-310000003570us-gaap:FairValueInputsLevel1Memberlng:A2045ConvertibleSeniorNotesMemberus-gaap:CarryingReportedAmountFairValueDisclosureMember2022-03-310000003570us-gaap:FairValueInputsLevel1Memberlng:A2045ConvertibleSeniorNotesMemberus-gaap:EstimateOfFairValueFairValueDisclosureMember2022-03-310000003570us-gaap:FairValueInputsLevel1Memberlng:A2045ConvertibleSeniorNotesMemberus-gaap:CarryingReportedAmountFairValueDisclosureMember2021-12-310000003570us-gaap:FairValueInputsLevel1Memberlng:A2045ConvertibleSeniorNotesMemberus-gaap:EstimateOfFairValueFairValueDisclosureMember2021-12-310000003570lng:OperatingLeaseAssetsMember2022-03-310000003570lng:OperatingLeaseAssetsMember2021-12-310000003570us-gaap:PropertyPlantAndEquipmentMember2022-03-310000003570us-gaap:PropertyPlantAndEquipmentMember2021-12-310000003570lng:CurrentOperatingLeaseLiabilitiesMember2022-03-310000003570lng:CurrentOperatingLeaseLiabilitiesMember2021-12-310000003570us-gaap:OtherCurrentLiabilitiesMember2022-03-310000003570us-gaap:OtherCurrentLiabilitiesMember2021-12-310000003570lng:NonCurrentOperatingLeaseLiabilitiesMember2022-03-310000003570lng:NonCurrentOperatingLeaseLiabilitiesMember2021-12-310000003570us-gaap:OtherNoncurrentLiabilitiesMember2022-03-310000003570us-gaap:OtherNoncurrentLiabilitiesMember2021-12-310000003570us-gaap:OperatingExpenseMember2022-01-012022-03-310000003570us-gaap:OperatingExpenseMember2021-01-012021-03-310000003570lng:DepreciationandAmortizationExpenseMember2022-01-012022-03-310000003570lng:DepreciationandAmortizationExpenseMember2021-01-012021-03-310000003570us-gaap:InterestExpenseMember2022-01-012022-03-310000003570us-gaap:InterestExpenseMember2021-01-012021-03-310000003570srt:MaximumMember2022-03-310000003570lng:LiquefiedNaturalGasMember2022-04-012022-03-310000003570lng:LiquefiedNaturalGasMember2022-01-012021-12-310000003570lng:RegasificationServiceMember2022-04-012022-03-310000003570lng:RegasificationServiceMember2022-01-012021-12-3100000035702022-04-012022-03-3100000035702022-01-012021-12-310000003570lng:NaturalGasSupplyAgreementMemberlng:CorpusChristiLiquefactionMember2021-01-012021-03-310000003570lng:NaturalGasSupplyAgreementMemberlng:CorpusChristiLiquefactionMemberus-gaap:PriceRiskDerivativeMember2021-01-012021-03-310000003570srt:MaximumMemberlng:NaturalGasTransportationAndStorageAgreementsMemberlng:SabinePassLiquefactionLLCAndCheniereCreoleTrailPipelineLPMember2022-01-012022-03-310000003570lng:NaturalGasTransportationAndStorageAgreementsMemberlng:SabinePassLiquefactionLLCAndCheniereCreoleTrailPipelineLPMember2022-01-012022-03-310000003570lng:NaturalGasTransportationAndStorageAgreementsMemberlng:SabinePassLiquefactionLLCAndCheniereCreoleTrailPipelineLPMember2021-01-012021-03-310000003570lng:NaturalGasTransportationAndStorageAgreementsMemberlng:SabinePassLiquefactionLLCAndCheniereCreoleTrailPipelineLPMember2022-03-310000003570lng:NaturalGasTransportationAndStorageAgreementsMemberlng:SabinePassLiquefactionLLCAndCheniereCreoleTrailPipelineLPMember2021-12-310000003570lng:CorpusChristiLiquefactionMemberlng:NaturalGasTransportationAndStorageAgreementsMember2022-01-012022-03-310000003570lng:CorpusChristiLiquefactionMemberlng:NaturalGasTransportationAndStorageAgreementsMember2021-01-012021-03-310000003570lng:CorpusChristiLiquefactionMemberlng:NaturalGasTransportationAndStorageAgreementsMember2022-03-310000003570lng:CorpusChristiLiquefactionMemberlng:NaturalGasTransportationAndStorageAgreementsMember2021-12-310000003570lng:OperationAndMaintenanceAgreementMemberlng:CheniereLNGOMServicesLLCMemberus-gaap:ProductAndServiceOtherMember2021-01-012021-03-310000003570lng:OperationAndMaintenanceAgreementMemberlng:CheniereLNGOMServicesLLCMemberus-gaap:ProductAndServiceOtherMember2022-01-012022-03-310000003570lng:OperationAndMaintenanceAgreementMemberlng:CheniereLNGOMServicesLLCMember2022-03-310000003570lng:OperationAndMaintenanceAgreementMemberlng:CheniereLNGOMServicesLLCMember2021-12-310000003570lng:UnvestedStockMember2022-01-012022-03-310000003570lng:UnvestedStockMember2021-01-012021-03-310000003570lng:A2045ConvertibleSeniorNotesMember2022-01-012022-03-310000003570lng:A2045ConvertibleSeniorNotesMember2021-01-012021-03-3100000035702022-01-252022-01-250000003570us-gaap:SubsequentEventMember2022-04-262022-04-260000003570lng:CustomerAMemberus-gaap:SalesRevenueNetMemberus-gaap:CustomerConcentrationRiskMember2021-01-012021-03-310000003570lng:CustomerAMemberlng:AccountsReceivableAndContractAssetsMemberus-gaap:CustomerConcentrationRiskMember2021-01-012021-12-310000003570us-gaap:SalesRevenueNetMemberlng:CustomerBMemberus-gaap:CustomerConcentrationRiskMember2021-01-012021-03-310000003570lng:CustomerCMemberus-gaap:SalesRevenueNetMemberus-gaap:CustomerConcentrationRiskMember2021-01-012021-03-310000003570lng:CustomerDMemberlng:AccountsReceivableAndContractAssetsMemberus-gaap:CustomerConcentrationRiskMember2022-01-012022-03-31
UNITED STATES
SECURITIES AND EXCHANGE COMMISSION
Washington, D.C. 20549
FORM 10-Q
☒ QUARTERLY REPORT PURSUANT TO SECTION 13 OR 15(d) OF THE SECURITIES EXCHANGE ACT OF 1934
For the quarterly period ended March 31, 2022
or
☐ TRANSITION REPORT PURSUANT TO SECTION 13 OR 15(d) OF THE SECURITIES EXCHANGE ACT OF 1934
For the transition period from to
Commission file number 001-16383
CHENIERE ENERGY, INC.
(Exact name of registrant as specified in its charter)
| | | | | |
| Delaware | 95-4352386 |
| (State or other jurisdiction of incorporation or organization) | (I.R.S. Employer Identification No.) |
700 Milam Street, Suite 1900
Houston, Texas 77002
(Address of principal executive offices) (Zip Code)
(713) 375-5000
(Registrant’s telephone number, including area code)
Securities registered pursuant to Section 12(b) of the Act:
| | | | | | | | |
| Title of each class | Trading Symbol | Name of each exchange on which registered |
| Common Stock, $ 0.003 par value | LNG | NYSE American |
Indicate by check mark whether the registrant (1) has filed all reports required to be filed by Section 13 or 15(d) of the Securities Exchange Act of 1934 during the preceding 12 months (or for such shorter period that the registrant was required to file such reports), and (2) has been subject to such filing requirements for the past 90 days. Yes ☒ No ☐
Indicate by check mark whether the registrant has submitted electronically every Interactive Data File required to be submitted pursuant to Rule 405 of Regulation S-T (§232.405 of this chapter) during the preceding 12 months (or for such shorter period that the registrant was required to submit such files). Yes ☒ No ☐
Indicate by check mark whether the registrant is a large accelerated filer, an accelerated filer, a non-accelerated filer, a smaller reporting company, or an emerging growth company. See the definitions of “large accelerated filer,” “accelerated filer,” “smaller reporting company” and “emerging growth company” in Rule 12b-2 of the Exchange Act.
| | | | | | | | | | | | | | | | | |
| Large accelerated filer | ☒ | | Accelerated filer | ☐ |
| Non-accelerated filer | ☐ | | Smaller reporting company | ☐ |
| | | | Emerging growth company | ☐ |
If an emerging growth company, indicate by check mark if the registrant has elected not to use the extended transition period for complying with any new or revised financial accounting standards provided pursuant to Section 13(a) of the Exchange Act. ☐
Indicate by check mark whether the registrant is a shell company (as defined in Rule 12b-2 of the Exchange Act). Yes ☐ No ☒
As of April 29, 2022, the issuer had 254,139,054 shares of Common Stock outstanding.
CHENIERE ENERGY, INC.
TABLE OF CONTENTS
DEFINITIONS
As used in this quarterly report, the terms listed below have the following meanings:
Common Industry and Other Terms
| | | | | | | | |
| ASU | | Accounting Standards Update |
| Bcf | | billion cubic feet |
| Bcf/d | | billion cubic feet per day |
| Bcf/yr | | billion cubic feet per year |
| Bcfe | | billion cubic feet equivalent |
| DOE | | U.S. Department of Energy |
| EPC | | engineering, procurement and construction |
| FASB | | Financial Accounting Standards Board |
| FERC | | Federal Energy Regulatory Commission |
| FTA countries | | countries with which the United States has a free trade agreement providing for national treatment for trade in natural gas |
| GAAP | | generally accepted accounting principles in the United States |
| Henry Hub | | the final settlement price (in USD per MMBtu) for the New York Mercantile Exchange’s Henry Hub natural gas futures contract for the month in which a relevant cargo’s delivery window is scheduled to begin |
| IPM agreements | | integrated production marketing agreements in which the gas producer sells to us gas on a global LNG index price, less a fixed liquefaction fee, shipping and other costs |
| LIBOR | | London Interbank Offered Rate |
| LNG | | liquefied natural gas, a product of natural gas that, through a refrigeration process, has been cooled to a liquid state, which occupies a volume that is approximately 1/600th of its gaseous state |
| MMBtu | | million British thermal units; one British thermal unit measures the amount of energy required to raise the temperature of one pound of water by one degree Fahrenheit |
| mtpa | | million tonnes per annum |
| | |
| non-FTA countries | | countries with which the United States does not have a free trade agreement providing for national treatment for trade in natural gas and with which trade is permitted |
| SEC | | U.S. Securities and Exchange Commission |
| SOFR | | Secured Overnight Financing Rate |
| SPA | | LNG sale and purchase agreement |
| TBtu | | trillion British thermal units; one British thermal unit measures the amount of energy required to raise the temperature of one pound of water by one degree Fahrenheit |
| Train | | an industrial facility comprised of a series of refrigerant compressor loops used to cool natural gas into LNG |
| TUA | | terminal use agreement |
Abbreviated Legal Entity Structure
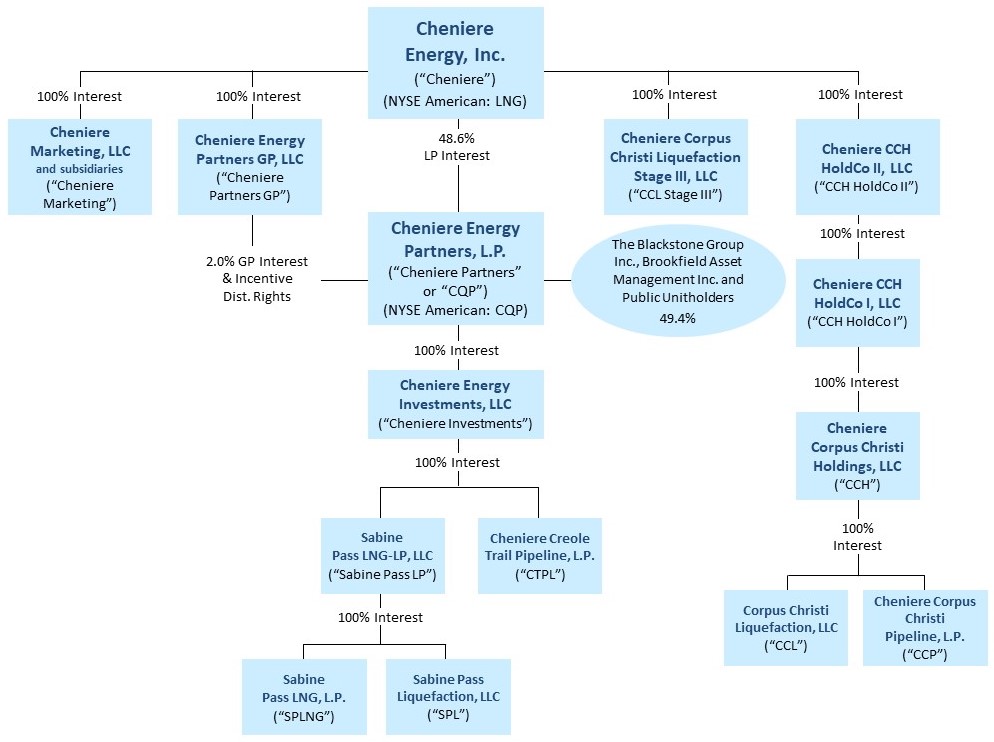
The following diagram depicts our abbreviated legal entity structure as of March 31, 2022, including our ownership of certain subsidiaries, and the references to these entities used in this quarterly report:
Unless the context requires otherwise, references to “Cheniere,” the “Company,” “we,” “us” and “our” refer to Cheniere Energy, Inc. and its consolidated subsidiaries, including our publicly traded subsidiary, CQP.
Unless the context requires otherwise, references to the “CCH Group” refer to CCH, CCL and CCP, collectively.
PART I. FINANCIAL INFORMATION
ITEM 1. CONSOLIDATED FINANCIAL STATEMENTS
CHENIERE ENERGY, INC. AND SUBSIDIARIES
CONSOLIDATED STATEMENTS OF OPERATIONS
(in millions, except per share data)
(unaudited)
| | | | | | | | | | | | | | | | | | | |
| | | Three Months Ended March 31, |
| | | | | 2022 | | 2021 | | |
| Revenues | | | | | | | | | |
| LNG revenues | | | | | $ | 7,340 | | | $ | 2,999 | | | |
| Regasification revenues | | | | | 68 | | | 67 | | | |
| Other revenues | | | | | 76 | | | 24 | | | |
| | | | | | | | | |
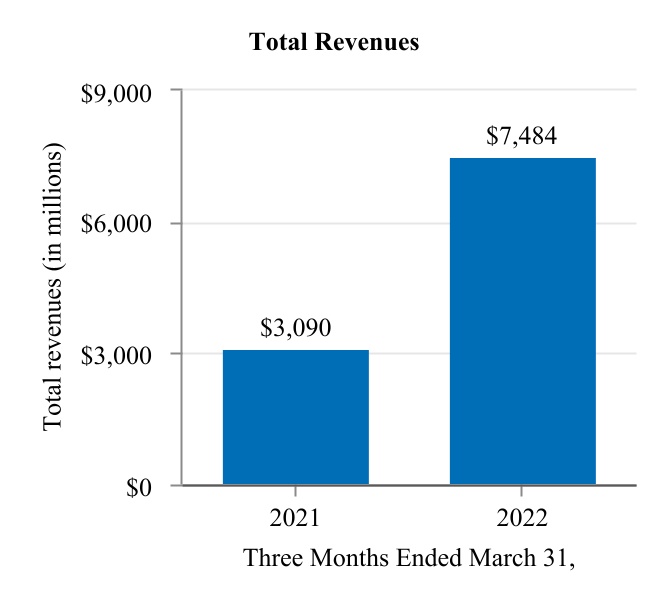
| Total revenues | | | | | 7,484 | | | 3,090 | | | |
| | | | | | | | | |
| Operating costs and expenses | | | | | | | | | |
| Cost of sales (excluding items shown separately below) | | | | | 7,336 | | | 1,386 | | | |
| | | | | | | | | |
| Operating and maintenance expense | | | | | 389 | | | 322 | | | |
| Development expense | | | | | 5 | | | 1 | | | |
| Selling, general and administrative expense | | | | | 96 | | | 81 | | | |
| Depreciation and amortization expense | | | | | 271 | | | 236 | | | |
| | | | | | | | | |
| | | | | | | | | |
| | | | | | | | | |
| | | | | | | | | |
| Total operating costs and expenses | | | | | 8,097 | | | 2,026 | | | |
| | | | | | | | | |
| Income (loss) from operations | | | | | (613) | | | 1,064 | | | |
| | | | | | | | | |
| Other income (expense) | | | | | | | | | |
| Interest expense, net of capitalized interest | | | | | (349) | | | (356) | | | |
| Loss on modification or extinguishment of debt | | | | | (18) | | | (55) | | | |
| Interest rate derivative gain, net | | | | | 3 | | | 1 | | | |
| Other income, net | | | | | 5 | | | 6 | | | |
| Total other expense | | | | | (359) | | | (404) | | | |
| | | | | | | | | |
| Income (loss) before income taxes and non-controlling interest | | | | | (972) | | | 660 | | | |
| Less: income tax provision (benefit) | | | | | (191) | | | 89 | | | |
| Net income (loss) | | | | | (781) | | | 571 | | | |
| Less: net income attributable to non-controlling interest | | | | | 84 | | | 178 | | | |
| Net income (loss) attributable to common stockholders | | | | | $ | (865) | | | $ | 393 | | | |
| | | | | | | | | |
Net income (loss) per share attributable to common stockholders—basic (1) | | | | | $ | (3.41) | | | $ | 1.56 | | | |
Net income (loss) per share attributable to common stockholders—diluted (1) | | | | | $ | (3.41) | | | $ | 1.54 | | | |
| | | | | | | | | |
| Weighted average number of common shares outstanding—basic | | | | | 254.0 | | | 252.9 | | | |
| Weighted average number of common shares outstanding—diluted | | | | | 254.0 | | | 258.9 | | | |
(1)Earnings per share in the table may not recalculate exactly due to rounding because it is calculated based on whole numbers, not the rounded numbers presented.
The accompanying notes are an integral part of these consolidated financial statements.
3
CHENIERE ENERGY, INC. AND SUBSIDIARIES
CONSOLIDATED BALANCE SHEETS (1)
(in millions, except share data)
| | | | | | | | | | | |
| |
| March 31, | | December 31, |
| 2022 | | 2021 |
| ASSETS | (unaudited) | | |
| Current assets | | | |
| Cash and cash equivalents | $ | 2,487 | | | $ | 1,404 | |
| Restricted cash and cash equivalents | 419 | | | 413 | |
| Trade and other receivables, net of current expected credit losses | 1,461 | | | 1,506 | |
| | | |
| Inventory | 571 | | | 706 | |
| Current derivative assets | 215 | | | 55 | |
| Margin deposits | 456 | | | 765 | |
| Other current assets | 96 | | | 207 | |
| Total current assets | 5,705 | | | 5,056 | |
| | | |
| | | |
| Property, plant and equipment, net of accumulated depreciation | 30,314 | | | 30,288 | |
| Operating lease assets | 1,975 | | | 2,102 | |
| | | |
| Derivative assets | 43 | | | 69 | |
| Goodwill | 77 | | | 77 | |
| Deferred tax assets | 1,450 | | | 1,204 | |
| Other non-current assets, net | 491 | | | 462 | |
| Total assets | $ | 40,055 | | | $ | 39,258 | |
| | | |
| LIABILITIES AND STOCKHOLDERS' DEFICIT | | | |
| Current liabilities | | | |
| Accounts payable | $ | 167 | | | $ | 155 | |
| Accrued liabilities | 1,963 | | | 2,299 | |
| | | |
| Current debt, net of discount and debt issuance costs | 62 | | | 366 | |
| Deferred revenue | 120 | | | 155 | |
| Current operating lease liabilities | 527 | | | 535 | |
| Current derivative liabilities | 1,746 | | | 1,089 | |
| Other current liabilities | 20 | | | 94 | |
| Total current liabilities | 4,605 | | | 4,693 | |
| | | |
| Long-term debt, net of premium, discount and debt issuance costs | 28,907 | | | 29,449 | |
| Operating lease liabilities | 1,423 | | | 1,541 | |
| Finance lease liabilities | 57 | | | 57 | |
| | | |
| Derivative liabilities | 6,256 | | | 3,501 | |
| Other non-current liabilities | 66 | | | 50 | |
| | | |
| | | |
| | | |
| Stockholders' deficit | | | |
Preferred stock: $0.0001 par value, 5.0 million shares authorized, none issued | — | | | — | |
Common stock: $0.003 par value, 480.0 million shares authorized; 276.5 million shares and 275.2 million shares issued at March 31, 2022 and December 31, 2021, respectively | 1 | | | 1 | |
| | | |
| | | |
| | | |
Treasury stock: 22.1 million shares and 21.6 million shares at March 31, 2022 and December 31, 2021, respectively, at cost | (988) | | | (928) | |
| Additional paid-in-capital | 4,244 | | | 4,377 | |
| Accumulated deficit | (6,967) | | | (6,021) | |
| Total stockholders' deficit | (3,710) | | | (2,571) | |
| Non-controlling interest | 2,451 | | | 2,538 | |
| Total deficit | (1,259) | | | (33) | |
| Total liabilities and stockholders' deficit | $ | 40,055 | | | $ | 39,258 | |
(1)Amounts presented include balances held by our consolidated variable interest entity (“VIE”), CQP, as further discussed in Note 7—Non-controlling Interest and Variable Interest Entity. As of March 31, 2022, total assets and liabilities of CQP, which are included in our Consolidated Balance Sheets, were $19.2 billion and $21.8 billion, respectively, including $1.2 billion of cash and cash equivalents and $0.1 billion of restricted cash and cash equivalents.
The accompanying notes are an integral part of these consolidated financial statements.
4
CHENIERE ENERGY, INC. AND SUBSIDIARIES
CONSOLIDATED STATEMENTS OF STOCKHOLDERS’ EQUITY (DEFICIT)
(in millions)
(unaudited)
| | | | | | | | | | | | | | | | | | | | | | | | | | | | | | | | | | | | | | | | | | | | | | | |
| Three Months Ended March 31, 2022 | | | | | | | | | | | | | | | |
| Total Stockholders’ Deficit | | | |
| | Common Stock | | Treasury Stock | | Additional Paid-in Capital | | Accumulated Deficit | | Non-controlling Interest | | Total
Deficit |
| | Shares | | Par Value Amount | | Shares | | Amount | | | | |
| | | | | | | | | | | | | | | |
| | | | | | | | | | | | | | | |
| | | | | | | | | | | | | | | |
| | | | | | | | | | | | | | | |
| | | | | | | | | | | | | | | |
| | | | | | | | | | | | | | | |
| | | | | | | | | | | | | | | |
| | | | | | | | | | | | | | | |
| | | | | | | | | | | | | | | |
| | | | | | | | | | | | | | | |
| | | | | | | | | | | | | | | |
| | | | | | | | | | | | | | | |
| | | | | | | | | | | | | | | |
| | | | | | | | | | | | | | | |
| | | | | | | | | | | | | | | |
| | | | | | | | | | | | | | | |
| | | | | | | | | | | | | | | |
| | | | | | | | | | | | | | | |
| | | | | | | | | | | | | | | |
| | | | | | | | | | | | | | | |
| | | | | | | | | | | | | | | |
| | | | | | | | | | | | | | | |
| Balance at December 31, 2021 | 253.6 | | | $ | 1 | | | 21.6 | | | $ | (928) | | | $ | 4,377 | | | $ | (6,021) | | | $ | 2,538 | | | $ | (33) | |
| | | | | | | | | | | | | | | |
| | | | | | | | | | | | | | | |
| | | | | | | | | | | | | | | |
| | | | | | | | | | | | | | | |
| | | | | | | | | | | | | | | |
| | | | | | | | | | | | | | | |
| | | | | | | | | | | | | | | |
| | | | | | | | | | | | | | | |
| | | | | | | | | | | | | | | |
| | | | | | | | | | | | | | | |
| | | | | | | | | | | | | | | |
| | | | | | | | | | | | | | | |
| | | | | | | | | | | | | | | |
| | | | | | | | | | | | | | | |
| | | | | | | | | | | | | | | |
| | | | | | | | | | | | | | | |
| | | | | | | | | | | | | | | |
| | | | | | | | | | | | | | | |
| Vesting of share-based compensation awards | 1.3 | | | — | | | — | | | — | | | — | | | — | | | — | | | — | |
| Share-based compensation | — | | | — | | | — | | | — | | | 38 | | | — | | | — | | | 38 | |
| Issued shares withheld from employees related to share-based compensation, at cost | (0.3) | | | — | | | 0.3 | | | (35) | | | (18) | | | — | | | — | | | (53) | |
| Shares repurchased, at cost | (0.2) | | | — | | | 0.2 | | | (25) | | | — | | | — | | | — | | | (25) | |
Adoption of ASU 2020-06, net of tax (see Note 1) | — | | | — | | | — | | | — | | | (153) | | | 4 | | | — | | | (149) | |
| Net income attributable to non-controlling interest | — | | | — | | | — | | | — | | | — | | | — | | | 84 | | | 84 | |
| | | | | | | | | | | | | | | |
| Distributions to non-controlling interest | — | | | — | | | — | | | — | | | — | | | — | | | (171) | | | (171) | |
Dividends declared ($0.33 per common share) | — | | | — | | | — | | | — | | | — | | | (85) | | | — | | | (85) | |
| Net loss | — | | | — | | | — | | | — | | | — | | | (865) | | | — | | | (865) | |
| Balance at March 31, 2022 | 254.4 | | | $ | 1 | | | 22.1 | | | $ | (988) | | | $ | 4,244 | | | $ | (6,967) | | | $ | 2,451 | | | $ | (1,259) | |
| | | | | | | | | | | | | | | | | | | | | | | | | | | | | | | | | | | | | | | | | | | | | | | |
| Three Months Ended March 31, 2021 | | | | | | | | | | | | | | | |
| Total Stockholders’ Equity | | | |
| | Common Stock | | Treasury Stock | | Additional Paid-in Capital | | Accumulated Deficit | | Non-controlling Interest | | Total
Equity |
| | Shares | | Par Value Amount | | Shares | | Amount | | | | |
| Balance at December 31, 2020 | 252.3 | | | $ | 1 | | | 20.8 | | | $ | (872) | | | $ | 4,273 | | | $ | (3,593) | | | $ | 2,409 | | | $ | 2,218 | |
| Vesting of share-based compensation awards | 1.8 | | | — | | | — | | | — | | | — | | | — | | | — | | | — | |
| Share-based compensation | — | | | — | | | — | | | — | | | 33 | | | — | | | — | | | 33 | |
| Issued shares withheld from employees related to share-based compensation, at cost | (0.6) | | | — | | | 0.6 | | | (42) | | | — | | | — | | | — | | | (42) | |
| Net income attributable to non-controlling interest | — | | | — | | | — | | | — | | | — | | | — | | | 178 | | | 178 | |
| Distributions to non-controlling interest | — | | | — | | | — | | | — | | | — | | | — | | | (160) | | | (160) | |
| Net income | — | | | — | | | — | | | — | | | — | | | 393 | | | — | | | 393 | |
| Balance at March 31, 2021 | 253.5 | | | $ | 1 | | | 21.4 | | | $ | (914) | | | $ | 4,306 | | | $ | (3,200) | | | $ | 2,427 | | | $ | 2,620 | |
| | | | | | | | | | | | | | | |
| | | | | | | | | | | | | | | |
| | | | | | | | | | | | | | | |
| | | | | | | | | | | | | | | |
| | | | | | | | | | | | | | | |
| | | | | | | | | | | | | | | |
| | | | | | | | | | | | | | | |
| | | | | | | | | | | | | | | |
| | | | | | | | | | | | | | | |
| | | | | | | | | | | | | | | |
| | | | | | | | | | | | | | | |
| | | | | | | | | | | | | | | |
| | | | | | | | | | | | | | | |
| | | | | | | | | | | | | | | |
| | | | | | | | | | | | | | | |
| | | | | | | | | | | | | | | |
The accompanying notes are an integral part of these consolidated financial statements.
5
CHENIERE ENERGY, INC. AND SUBSIDIARIES
CONSOLIDATED STATEMENTS OF CASH FLOWS
(in millions)
(unaudited)
| | | | | | | | | | | | | |
| Three Months Ended March 31, |
| March 31, | | |
| 2022 | | 2021 | | |
| Cash flows from operating activities | | | | | |
| Net income (loss) | $ | (781) | | | $ | 571 | | | |
| Adjustments to reconcile net income (loss) to net cash provided by operating activities: | | | | | |
| Depreciation and amortization expense | 271 | | | 236 | | | |
| Share-based compensation expense | 43 | | | 32 | | | |
| Non-cash interest expense | 2 | | | 8 | | | |
| Amortization of debt issuance costs, premium and discount | 15 | | | 20 | | | |
| Reduction of right-of-use assets | 134 | | | 85 | | | |
| Loss on modification or extinguishment of debt | 18 | | | 55 | | | |
| Total losses on derivative instruments, net | 3,592 | | | 74 | | | |
| Net cash provided by (used for) settlement of derivative instruments | (314) | | | 5 | | | |
| | | | | |
| Impairment expense and loss (income) on equity method investments | (5) | | | (7) | | | |
| Deferred taxes | (206) | | | 87 | | | |
| Repayment of paid-in-kind interest related to repurchase of convertible notes | (13) | | | — | | | |
| Other | — | | | 1 | | | |
| Changes in operating assets and liabilities: | | | | | |
| Trade and other receivables, net of current expected credit losses | (16) | | | (3) | | | |
| | | | | |
| Inventory | 133 | | | (16) | | | |
| Margin deposits | 309 | | | (17) | | | |
| Other current assets | 99 | | | 16 | | | |
| Accounts payable and accrued liabilities | (386) | | | 52 | | | |
| | | | | |
| Deferred revenue | (24) | | | (36) | | | |
| Operating lease liabilities | (134) | | | (86) | | | |
| Finance lease liabilities | 1 | | | — | | | |
| Other, net | (83) | | | (11) | | | |
| Net cash provided by operating activities | 2,655 | | | 1,066 | | | |
| | | | | |
| Cash flows from investing activities | | | | | |
| Property, plant and equipment | (178) | | | (190) | | | |
| | | | | |
| | | | | |
| Other | — | | | (10) | | | |
| Net cash used in investing activities | (178) | | | (200) | | | |
| | | | | |
| Cash flows from financing activities | | | | | |
| Proceeds from issuances of debt | 575 | | | 1,800 | | | |
| Redemptions and repayments of debt | (1,615) | | | (2,088) | | | |
| Debt issuance and other financing costs | — | | | (19) | | | |
| Debt modification or extinguishment costs | (13) | | | (40) | | | |
| | | | | |
| Distributions to non-controlling interest | (171) | | | (160) | | | |
| Payments related to tax withholdings for share-based compensation | (53) | | | (42) | | | |
| Repurchase of common stock | (25) | | | — | | | |
| Cash dividends to shareholders | (86) | | | — | | | |
| Other | — | | | 4 | | | |
| Net cash used in financing activities | (1,388) | | | (545) | | | |
| | | | | |
| Net increase in cash, cash equivalents and restricted cash and cash equivalents | 1,089 | | | 321 | | | |
| Cash, cash equivalents and restricted cash and cash equivalents—beginning of period | 1,817 | | | 2,077 | | | |
| Cash, cash equivalents and restricted cash and cash equivalents—end of period | $ | 2,906 | | | $ | 2,398 | | | |
Balances per Consolidated Balance Sheet:
| | | | | | | |
| March 31, |
| 2022 | | |
| Cash and cash equivalents | $ | 2,487 | | | |
| Restricted cash and cash equivalents | 419 | | | |
| | | |
| Total cash, cash equivalents and restricted cash and cash equivalents | $ | 2,906 | | | |
The accompanying notes are an integral part of these consolidated financial statements.
6
CHENIERE ENERGY, INC. AND SUBSIDIARIES
NOTES TO CONSOLIDATED FINANCIAL STATEMENTS
(unaudited)
NOTE 1—NATURE OF OPERATIONS AND BASIS OF PRESENTATION
We operate two natural gas liquefaction and export facilities located in Cameron Parish, Louisiana at Sabine Pass and near Corpus Christi, Texas (respectively, the “Sabine Pass LNG Terminal” and “Corpus Christi LNG Terminal”).
CQP owns the Sabine Pass LNG Terminal which has natural gas liquefaction facilities consisting of six operational Trains, with Train 6 achieving substantial completion on February 4, 2022, for a total production capacity of approximately 30 mtpa of LNG (the “SPL Project”). The Sabine Pass LNG Terminal also has operational regasification facilities that include five LNG storage tanks, vaporizers and two marine berths, with an additional marine berth that is under construction. CQP also owns a 94-mile pipeline that interconnects the Sabine Pass LNG Terminal with a number of large interstate pipelines (the “Creole Trail Pipeline”) through its subsidiary, CTPL. As of March 31, 2022, we owned 100% of the general partner interest and a 48.6% limited partner interest in CQP.
The Corpus Christi LNG Terminal currently has three Trains, for a total production capacity of approximately 15 mtpa of LNG. We also own a 21.5-mile natural gas supply pipeline that interconnects the Corpus Christi LNG Terminal with several interstate and intrastate natural gas pipelines (the “Corpus Christi Pipeline” and together with the Trains, the “CCL Project”) through our subsidiary CCP, as part of the CCH Group. The CCL Project also includes three LNG storage tanks and two marine berths.
Additionally, separate from the CCH Group, we are developing an expansion of the Corpus Christi LNG Terminal adjacent to the CCL Project (“Corpus Christi Stage 3”) through our subsidiary CCL Stage III, for up to seven midscale Trains with an expected total production capacity of over 10 mtpa of LNG. We received approval from FERC in November 2019 to site, construct and operate the expansion project. In March 2022, CCL Stage III issued limited notice to proceed to Bechtel Oil, Gas and Chemicals, Inc. to commence early engineering, procurement and site works.
We have increased available liquefaction capacity at the SPL Project and the CCL Project (collectively, the “Liquefaction Projects”) as a result of debottlenecking and other optimization projects. We hold significant land positions at both the Sabine Pass LNG Terminal and the Corpus Christi LNG Terminal which provide opportunity for further liquefaction capacity expansion. The development of these sites or other projects, including infrastructure projects in support of natural gas supply and LNG demand, will require, among other things, acceptable commercial and financing arrangements before we make a final investment decision (“FID”).
Basis of Presentation
The accompanying unaudited Consolidated Financial Statements of Cheniere have been prepared in accordance with GAAP for interim financial information and in accordance with Rule 10-01 of Regulation S-X. Accordingly, they do not include all of the information and footnotes required by GAAP for complete financial statements and should be read in conjunction with the Consolidated Financial Statements and accompanying notes included in our annual report on Form 10-K for the fiscal year ended December 31, 2021. Reclassifications that are not material to our Consolidated Financial Statements, if any, are made to prior period financial information to conform to the current year presentation.
Results of operations for the three months ended March 31, 2022 are not necessarily indicative of the results of operations that will be realized for the year ending December 31, 2022.
Recent Accounting Standards
ASU 2020-06
In August 2020, the FASB issued ASU 2020-06, Debt—Debt with Conversion and Other Options (Subtopic 470-20) and Derivatives and Hedging—Contracts in Entity’s Own Equity (Subtopic 815-40): Accounting for Convertible Instruments and Contracts in an Entity’s Own Equity. This guidance simplifies the accounting for convertible instruments primarily by eliminating the existing cash conversion and beneficial conversion models within Subtopic 470-20, which will result in fewer embedded conversion options being accounted for separately from the debt host. The guidance also amends and simplifies the calculation of earnings per share relating to convertible instruments. This guidance is effective for annual periods beginning after December 15, 2021, including interim periods within that reporting period, with earlier adoption permitted for fiscal years
CHENIERE ENERGY, INC. AND SUBSIDIARIES
NOTES TO CONSOLIDATED FINANCIAL STATEMENTS—CONTINUED
(unaudited)
beginning after December 15, 2020, including interim periods within that reporting period, using either a full or modified retrospective approach. We adopted this guidance on January 1, 2022 using the modified retrospective approach. The adoption of ASU 2020-06 primarily resulted in the reclassification of the previously bifurcated equity component associated with the 4.25% Convertible Senior Notes due 2045 (the “2045 Cheniere Convertible Senior Notes”) to debt as a result of the elimination of the cash conversion model. As of January 1, 2022, the reclassification resulted in: (1) a $194 million reduction of the equity component recorded in additional paid-in capital, before offsetting tax effect of $41 million, (2) a $189 million increase in the carrying value of our 2045 Cheniere Convertible Senior Notes and (3) a $5 million decrease in accumulated deficit, before offsetting tax effect of $1 million. In December 2021, we issued a notice of redemption for all $625 million aggregate principal amount outstanding of our 2045 Cheniere Convertible Senior Notes, which were redeemed on January 5, 2022. See Note 9—Debt for further discussion of the 2045 Cheniere Convertible Senior Notes.
ASU 2020-04
In March 2020, the FASB issued ASU 2020-04, Reference Rate Reform (Topic 848): Facilitation of the Effects of Reference Rate Reform on Financial Reporting. This guidance primarily provides temporary optional expedients which simplify the accounting for contract modifications to existing contracts expected to arise from the market transition from LIBOR to alternative reference rates. The transition period under this standard is effective March 12, 2020 and will apply through December 31, 2022.
We have interest rate swaps and various credit facilities indexed to LIBOR, as further described in Note 6—Derivative Instruments and Note 9—Debt, respectively. To date, we have amended certain of our credit facilities to incorporate a fallback replacement rate indexed to SOFR as a result of the expected LIBOR transition. We elected to apply the optional expedients as applicable to certain modified terms, however the impact of applying the optional expedients was not material, and we do not expect the transition to a replacement rate indexed to SOFR to have a material impact on our future cash flows. We will continue to elect to apply the optional expedients to qualifying contract modifications in the future.
NOTE 2—RESTRICTED CASH AND CASH EQUIVALENTS
Restricted cash and cash equivalents consist of funds that are contractually or legally restricted as to usage or withdrawal and have been presented separately from cash and cash equivalents on our Consolidated Balance Sheets. Restricted cash and cash equivalents consisted of the following (in millions):
| | | | | | | | | | | | | | |
| | |
| | March 31, | | December 31, |
| | 2022 | | 2021 |
| Restricted cash and cash equivalents | | | | |
| SPL Project | | $ | 136 | | | $ | 98 | |
| | | | |
| CCL Project | | 50 | | | 44 | |
| Cash held by our subsidiaries that is restricted to Cheniere | | 233 | | | 271 | |
| Total restricted cash and cash equivalents | | $ | 419 | | | $ | 413 | |
| | | | |
| | | | |
| | | | |
| | | | |
| | | | |
| | | | |
Pursuant to the accounts agreements entered into with the collateral trustees for the benefit of SPL’s debt holders and CCH’s debt holders, SPL and CCH are required to deposit all cash received into reserve accounts controlled by the collateral trustees. The usage or withdrawal of such cash is restricted to the payment of liabilities related to the Liquefaction Projects and other restricted payments. The majority of the cash held by our subsidiaries that is restricted to Cheniere relates to advance funding for operation and construction needs of the Liquefaction Projects.
CHENIERE ENERGY, INC. AND SUBSIDIARIES
NOTES TO CONSOLIDATED FINANCIAL STATEMENTS—CONTINUED
(unaudited)
NOTE 3—TRADE AND OTHER RECEIVABLES, NET OF CURRENT EXPECTED CREDIT LOSSES
Trade and other receivables, net of current expected credit losses consisted of the following (in millions):
| | | | | | | | | | | | | | |
| | |
| | March 31, | | December 31, |
| | 2022 | | 2021 |
| Trade receivables | | | | |
| SPL and CCL | | $ | 571 | | | $ | 802 | |
| | | | |
| Cheniere Marketing | | 750 | | | 640 | |
| Other receivables | | 140 | | | 64 | |
| Total trade and other receivables, net of current expected credit losses | | $ | 1,461 | | | $ | 1,506 | |
NOTE 4—INVENTORY
Inventory consisted of the following (in millions):
| | | | | | | | | | | | | | |
| | |
| | March 31, | | December 31, |
| | 2022 | | 2021 |
| Materials | | $ | 178 | | | $ | 174 | |
| LNG in-transit | | 210 | | | 312 | |
| LNG | | 135 | | | 153 | |
| Natural gas | | 44 | | | 64 | |
| Other | | 4 | | | 3 | |
| Total inventory | | $ | 571 | | | $ | 706 | |
NOTE 5—PROPERTY, PLANT AND EQUIPMENT, NET OF ACCUMULATED DEPRECIATION
Property, plant and equipment, net of accumulated depreciation consisted of the following (in millions):
| | | | | | | | | | | | | | |
| | |
| | March 31, | | December 31, |
| | 2022 | | 2021 |
| LNG terminal | | | | |
| LNG terminal and interconnecting pipeline facilities | | $ | 33,138 | | | $ | 30,660 | |
| LNG site and related costs | | 442 | | | 441 | |
| LNG terminal construction-in-process | | 809 | | | 2,995 | |
| Accumulated depreciation | | (4,176) | | | (3,912) | |
| Total LNG terminal, net of accumulated depreciation | | 30,213 | | | 30,184 | |
| Fixed assets and other | | | | |
| Computer and office equipment | | 26 | | | 25 | |
| Furniture and fixtures | | 19 | | | 20 | |
| Computer software | | 123 | | | 120 | |
| Leasehold improvements | | 46 | | | 45 | |
| Land | | 1 | | | 1 | |
| Other | | 18 | | | 19 | |
| Accumulated depreciation | | (181) | | | (176) | |
| Total fixed assets and other, net of accumulated depreciation | | 52 | | | 54 | |
| Assets under finance lease | | | | |
| Tug vessels | | 60 | | | 60 | |
| Accumulated depreciation | | (11) | | | (10) | |
| Total assets under finance lease, net of accumulated depreciation | | 49 | | | 50 | |
| Property, plant and equipment, net of accumulated depreciation | | $ | 30,314 | | | $ | 30,288 | |
CHENIERE ENERGY, INC. AND SUBSIDIARIES
NOTES TO CONSOLIDATED FINANCIAL STATEMENTS—CONTINUED
(unaudited)
The following table shows depreciation expense and offsets to LNG terminal costs (in millions):
| | | | | | | | | | | | | | | | | | | | |
| | | | Three Months Ended March 31, |
| | | | | | 2022 | | 2021 | | |
| Depreciation expense | | | | | | $ | 270 | | | $ | 234 | | | |
| Offsets to LNG terminal costs (1) | | | | | | 204 | | | 191 | | | |
(1)We recognize offsets to LNG terminal costs related to the sale of commissioning cargoes because these amounts were earned or loaded prior to the start of commercial operations of the respective Trains of the Liquefaction Projects during the testing phase for its construction.
NOTE 6—DERIVATIVE INSTRUMENTS
We have entered into the following derivative instruments that are reported at fair value:
•interest rate swaps (“Interest Rate Derivatives”) to hedge the exposure to volatility in a portion of the floating-rate interest payments on CCH’s amended and restated term loan credit facility (the “CCH Credit Facility”);
•commodity derivatives consisting of natural gas supply contracts, including those under our IPM agreements, for the commissioning and operation of the Liquefaction Projects and potential future development of Corpus Christi Stage 3 (“Physical Liquefaction Supply Derivatives”) and associated economic hedges (“Financial Liquefaction Supply Derivatives,” and collectively with the Physical Liquefaction Supply Derivatives, the “Liquefaction Supply Derivatives”);
•physical derivatives consisting of liquified natural gas contracts in which we have contractual net settlement (“Physical LNG Trading Derivatives”) and financial derivatives to hedge the exposure to the commodity markets in which we have contractual arrangements to purchase or sell physical LNG (collectively, “LNG Trading Derivatives”); and
•foreign currency exchange (“FX”) contracts to hedge exposure to currency risk associated with cash flows denominated in currencies other than United States dollar (“FX Derivatives”), associated with both LNG Trading Derivatives and operations in countries outside of the United States.
We recognize our derivative instruments as either assets or liabilities and measure those instruments at fair value. None of our derivative instruments are designated as cash flow or fair value hedging instruments, and changes in fair value are recorded within our Consolidated Statements of Operations to the extent not utilized for the commissioning process, in which case it is capitalized.
The following table shows the fair value of our derivative instruments that are required to be measured at fair value on a recurring basis (in millions):
| | | | | | | | | | | | | | | | | | | | | | | | | | | | | | | | | | | | | | | | | | | | | | | |
| Fair Value Measurements as of |
| March 31, 2022 | | December 31, 2021 |
| Quoted Prices in Active Markets
(Level 1) | | Significant Other Observable Inputs
(Level 2) | | Significant Unobservable Inputs
(Level 3) | | Total | | Quoted Prices in Active Markets
(Level 1) | | Significant Other Observable Inputs
(Level 2) | | Significant Unobservable Inputs
(Level 3) | | Total |
| Interest Rate Derivatives liability | $ | — | | | $ | (12) | | | $ | — | | | $ | (12) | | | $ | — | | | $ | (40) | | | $ | — | | | $ | (40) | |
| | | | | | | | | | | | | | | |
| Liquefaction Supply Derivatives asset (liability) | (75) | | | 9 | | | (7,423) | | | (7,489) | | | 7 | | | (9) | | | (4,036) | | | (4,038) | |
| LNG Trading Derivatives liability | (8) | | | (260) | | | — | | | (268) | | | (22) | | | (378) | | | — | | | (400) | |
| FX Derivatives asset | — | | | 25 | | | — | | | 25 | | | — | | | 12 | | | — | | | 12 | |
| | | | | | | | | | | | | | | |
We value our Interest Rate Derivatives using an income-based approach utilizing observable inputs to the valuation model including interest rate curves, risk adjusted discount rates, credit spreads and other relevant data. We value our LNG Trading Derivatives and our Liquefaction Supply Derivatives using a market or option-based approach incorporating present value techniques, as needed, using observable commodity price curves, when available, and other relevant data. We value our FX Derivatives with a market approach using observable FX rates and other relevant data.
CHENIERE ENERGY, INC. AND SUBSIDIARIES
NOTES TO CONSOLIDATED FINANCIAL STATEMENTS—CONTINUED
(unaudited)
The fair value of our Physical Liquefaction Supply Derivatives and LNG Trading Derivatives are predominantly driven by observable and unobservable market commodity prices and, as applicable to our natural gas supply contracts, our assessment of the associated events deriving fair value, including, but not limited to, evaluation of whether the respective market exists from the perspective of market participants as infrastructure is developed.
We include our Physical LNG Trading Derivatives and a portion of our Physical Liquefaction Supply Derivatives as Level 3 within the valuation hierarchy as the fair value is developed through the use of internal models which incorporate significant unobservable inputs. In instances where observable data is unavailable, consideration is given to the assumptions that market participants would use in valuing the asset or liability. This includes assumptions about market risks, such as future prices of energy units for unobservable periods, liquidity and volatility.
The Level 3 fair value measurements of our Physical LNG Trading Derivatives and the natural gas positions within our Physical Liquefaction Supply Derivatives could be materially impacted by a significant change in certain natural gas and international LNG prices. The following table includes quantitative information for the unobservable inputs for our Level 3 Physical Liquefaction Supply Derivatives as of March 31, 2022:
| | | | | | | | | | | | | | | | | | | | | | | | | | |
| | Net Fair Value Liability
(in millions) | | Valuation Approach | | Significant Unobservable Input | | Range of Significant Unobservable Inputs / Weighted Average (1) |
| Physical Liquefaction Supply Derivatives | | $(7,423) | | Market approach incorporating present value techniques | | Henry Hub basis spread | | $(1.578) - $0.215 / $(0.094) |
| | | | Option pricing model | | International LNG pricing spread, relative to Henry Hub (2) | | 101% - 533% / 190% |
| | | | | | | | |
(1)Unobservable inputs were weighted by the relative fair value of the instruments.
(2)Spread contemplates U.S. dollar-denominated pricing.
Increases or decreases in basis or pricing spreads, in isolation, would decrease or increase, respectively, the fair value of our Physical LNG Trading Derivatives and our Physical Liquefaction Supply Derivatives.
The following table shows the changes in the fair value of our Level 3 Physical LNG Trading Derivatives and Physical Liquefaction Supply Derivatives (in millions):
| | | | | | | | | | | | | | | | | | | | |
| | | | Three Months Ended March 31, |
| | | | | | 2022 | | 2021 | | |
| Balance, beginning of period | | | | | | $ | (4,036) | | | $ | 241 | | | |
| Realized and mark-to-market losses: | | | | | | | | | | |
| Included in cost of sales | | | | | | (3,540) | | | (129) | | | |
| | | | | | | | | | |
| Purchases and settlements: | | | | | | | | | | |
| Purchases | | | | | | (3) | | | (14) | | | |
| Settlements | | | | | | 156 | | | 33 | | | |
| | | | | | | | | | |
| Balance, end of period | | | | | | $ | (7,423) | | | $ | 131 | | | |
| Change in unrealized losses relating to instruments still held at end of period | | | | | | $ | (3,540) | | | $ | (129) | | | |
Except for Interest Rate Derivatives, all counterparty derivative contracts provide for the unconditional right of set-off in the event of default. We have elected to report derivative assets and liabilities arising from those derivative contracts with the same counterparty and the unconditional contractual right of set-off on a net basis. The use of derivative instruments exposes us to counterparty credit risk, or the risk that a counterparty will be unable to meet its commitments in instances when our derivative instruments are in an asset position. Additionally, counterparties are at risk that we will be unable to meet our commitments in instances where our derivative instruments are in a liability position. We incorporate both our own nonperformance risk and the respective counterparty’s nonperformance risk in fair value measurements. In adjusting the fair value of our derivative contracts for the effect of nonperformance risk, we have considered the impact of any applicable credit enhancements, such as collateral postings, set-off rights and guarantees.
CHENIERE ENERGY, INC. AND SUBSIDIARIES
NOTES TO CONSOLIDATED FINANCIAL STATEMENTS—CONTINUED
(unaudited)
Interest Rate Derivatives
CCH has entered into interest rate swaps to protect against volatility of future cash flows and hedge a portion of the variable interest payments on the CCH Credit Facility.
As of March 31, 2022, we had the following Interest Rate Derivatives outstanding:
| | | | | | | | | | | | | | | | | | | | | | | | | | | | | | | | |
| | Notional Amounts | | | | | | |
| | March 31, 2022 | | December 31, 2021 | | Latest Maturity Date | | Weighted Average Fixed Interest Rate Paid | | Variable Interest Rate Received |
| | | | | | | | | | |
| | | | | | | | | | |
| Interest Rate Derivatives | | $4.5 billion | | $4.5 billion | | May 31, 2022 | | 2.30% | | One-month LIBOR |
| | | | | | | | | | |
| | | | | | | | | | |
The following table shows the effect and location of our Interest Rate Derivatives on our Consolidated Statements of Operations (in millions):
| | | | | | | | | | | | | | | | | | | | | | | | | | |
| | | | | | | Gain Recognized in Consolidated Statements of Operations |
| | Consolidated Statements of Operations Location | | | | Three Months Ended March 31, |
| | | | | | | 2022 | | 2021 | | |
| Interest Rate Derivatives | | Interest rate derivative gain, net | | | | | | $ | 3 | | | $ | 1 | | | |
| | | | | | | | | | | | |
| | | | | | | | | | | | |
| | | | | | | | | | | | |
Commodity Derivatives
SPL, CCL and CCL Stage III have entered into Liquefaction Supply Derivatives which are primarily indexed to the natural gas market and international LNG indices. The remaining minimum terms of the index-based physical natural gas supply contracts range up to approximately 16 years, some of which commence upon the satisfaction of certain events or states of affairs. The terms of the Financial Liquefaction Supply Derivatives range up to approximately three years.
Commencing in first quarter of 2021, we have entered into physical LNG transactions that provide for contractual net settlement. Such transactions are accounted for as LNG Trading Derivatives, and are designed to economically hedge exposure to the commodity markets in which we sell LNG. We have entered into, and may from time to time enter into, financial LNG Trading Derivatives in the form of swaps, forwards, options or futures. The terms of LNG Trading Derivatives range up to approximately two years.
The following table shows the notional amounts of our Liquefaction Supply Derivatives and LNG Trading Derivatives (collectively, “Commodity Derivatives”):
| | | | | | | | | | | | | | | | | | | | | | | |
| March 31, 2022 | | December 31, 2021 |
| Liquefaction Supply Derivatives (1) | | LNG Trading Derivatives | | Liquefaction Supply Derivatives | | LNG Trading Derivatives |
| Notional amount, net (in TBtu) | 13,036 | | | 36 | | | 11,238 | | | 33 | |
| | | | | | | |
(1)Excludes notional amounts associated with extension options that were uncertain to be taken as of March 31, 2022.
CHENIERE ENERGY, INC. AND SUBSIDIARIES
NOTES TO CONSOLIDATED FINANCIAL STATEMENTS—CONTINUED
(unaudited)
The following table shows the effect and location of our Commodity Derivatives recorded on our Consolidated Statements of Operations (in millions):
| | | | | | | | | | | | | | | | | | | | | | | |
| | | | | | | Gain (Loss) Recognized in Consolidated Statements of Operations |
| Consolidated Statements of Operations Location (1) | | | | Three Months Ended March 31, |
| | | | | | 2022 | | 2021 | | |
| | | | | | | | | | | |
| LNG Trading Derivatives | LNG revenues | | | | | | $ | (247) | | | $ | (62) | | | |
| LNG Trading Derivatives | Cost of sales | | | | | | 90 | | | 28 | | | |
| Liquefaction Supply Derivatives (2) | LNG revenues | | | | | | (5) | | | 1 | | | |
| Liquefaction Supply Derivatives (2) | Cost of sales | | | | | | (3,461) | | | (63) | | | |
| | | | | | | | | | | |
| | | | | | | | | | | |
(1)Fair value fluctuations associated with commodity derivative activities are classified and presented consistently with the item economically hedged and the nature and intent of the derivative instrument.
(2)Does not include the realized value associated with derivative instruments that settle through physical delivery.
FX Derivatives
Cheniere Marketing has entered into FX Derivatives to protect against the volatility in future cash flows attributable to changes in international currency exchange rates. The FX Derivatives economically hedge the foreign currency exposure arising from cash flows expended for both physical and financial LNG transactions that are denominated in a currency other than the United States dollar. The terms of FX Derivatives range up to approximately one year.
The total notional amount of our FX Derivatives was $920 million and $762 million as of March 31, 2022 and December 31, 2021, respectively.
The following table shows the effect and location of our FX Derivatives recorded on our Consolidated Statements of Operations (in millions):
| | | | | | | | | | | | | | | | | | | | | | | |
| | | | | | Gain (Loss) Recognized in Consolidated Statements of Operations |
| Consolidated Statements of Operations Location | | | | Three Months Ended March 31, |
| | | | | | 2022 | | 2021 | | |
| FX Derivatives | LNG revenues | | | | | | $ | 28 | | | $ | 21 | | | |
| | | | | | | | | | | |
CHENIERE ENERGY, INC. AND SUBSIDIARIES
NOTES TO CONSOLIDATED FINANCIAL STATEMENTS—CONTINUED
(unaudited)
Fair Value and Location of Derivative Assets and Liabilities on the Consolidated Balance Sheets
The following table shows the fair value and location of our derivative instruments on our Consolidated Balance Sheets (in millions):
| | | | | | | | | | | | | | | | | | | | | | | | | | | | | | | |
| March 31, 2022 |
| Interest Rate Derivatives | | | | Liquefaction Supply Derivatives (1) | | LNG Trading Derivatives (2) | | FX Derivatives | | Total |
| Consolidated Balance Sheets Location | | | | | | | | | | | |
| Current derivative assets | $ | — | | | | | $ | 45 | | | $ | 145 | | | $ | 25 | | | $ | 215 | |
| Derivative assets | — | | | | | 43 | | | — | | | — | | | 43 | |
| Total derivative assets | — | | | | | 88 | | | 145 | | | 25 | | | 258 | |
| | | | | | | | | | | |
| Current derivative liabilities | (12) | | | | | (1,321) | | | (413) | | | — | | | (1,746) | |
| Derivative liabilities | — | | | | | (6,256) | | | — | | | — | | | (6,256) | |
| Total derivative liabilities | (12) | | | | | (7,577) | | | (413) | | | — | | | (8,002) | |
| | | | | | | | | | | |
| Derivative asset (liability), net | $ | (12) | | | | | $ | (7,489) | | | $ | (268) | | | $ | 25 | | | $ | (7,744) | |
| | | | | | | | | | | |
| December 31, 2021 |
| Interest Rate Derivatives | | | | Liquefaction Supply Derivatives (1) | | LNG Trading Derivatives (2) | | FX Derivatives | | Total |
| Consolidated Balance Sheets Location | | | | | | | | | | | |
| Current derivative assets | $ | — | | | | | $ | 38 | | | $ | 2 | | | $ | 15 | | | $ | 55 | |
| Derivative assets | — | | | | | 69 | | | — | | | — | | | 69 | |
| Total derivative assets | — | | | | | 107 | | | 2 | | | 15 | | | 124 | |
| | | | | | | | | | | |
| Current derivative liabilities | (40) | | | | | (644) | | | (402) | | | (3) | | | (1,089) | |
| Derivative liabilities | — | | | | | (3,501) | | | — | | | — | | | (3,501) | |
| Total derivative liabilities | (40) | | | | | (4,145) | | | (402) | | | (3) | | | (4,590) | |
| | | | | | | | | | | |
| Derivative asset (liability), net | $ | (40) | | | | | $ | (4,038) | | | $ | (400) | | | $ | 12 | | | $ | (4,466) | |
(1)Does not include collateral posted with counterparties by us of $96 million and $20 million as of March 31, 2022 and December 31, 2021, respectively, which are included in margin deposits in our Consolidated Balance Sheets.
(2)Does not include collateral posted with counterparties by us of $360 million and $745 million, as of March 31, 2022 and December 31, 2021, respectively, which are included in margin deposits in our Consolidated Balance Sheets.
CHENIERE ENERGY, INC. AND SUBSIDIARIES
NOTES TO CONSOLIDATED FINANCIAL STATEMENTS—CONTINUED
(unaudited)
Consolidated Balance Sheets Presentation
The following table shows the fair value of our derivatives outstanding on a gross and net basis (in millions) for our derivative instruments that are presented on a net basis on our Consolidated Balance Sheets:
| | | | | | | | | | | | | | | | | | | | | | | | |
| | | | | | Liquefaction Supply Derivatives | | LNG Trading Derivatives | | FX Derivatives |
| | | | | |
| As of March 31, 2022 | | | | | | | | | | |
| Gross assets | | | | | | $ | 113 | | | $ | 198 | | | $ | 62 | |
| Offsetting amounts | | | | | | (25) | | | (53) | | | (37) | |
| Net assets | | | | | | $ | 88 | | | $ | 145 | | | $ | 25 | |
| | | | | | | | | | |
| Gross liabilities | | | | | | $ | (8,072) | | | $ | (419) | | | $ | — | |
| Offsetting amounts | | | | | | 495 | | | 6 | | | — | |
| Net liabilities | | | | | | $ | (7,577) | | | $ | (413) | | | $ | — | |
| | | | | | | | | | |
| As of December 31, 2021 | | | | | | | | | | |
| Gross assets | | | | | | $ | 155 | | | $ | 10 | | | $ | 48 | |
| Offsetting amounts | | | | | | (48) | | | (8) | | | (33) | |
| Net assets | | | | | | $ | 107 | | | $ | 2 | | | $ | 15 | |
| | | | | | | | | | |
| Gross liabilities | | | | | | $ | (4,382) | | | $ | (551) | | | $ | (10) | |
| Offsetting amounts | | | | | | 237 | | | 149 | | | 7 | |
| Net liabilities | | | | | | $ | (4,145) | | | $ | (402) | | | $ | (3) | |
| | | | | | | | | | |
| | | | | | | | | | |
| | | | | | | | | | |
| | | | | | | | | | |
| | | | | | | | | | |
| | | | | | | | | | |
| | | | | | | | | | |
| | | | | | | | | | |
| | | | | | | | | | |
| | | | | | | | | | |
| | | | | | | | | | |
| | | | | | | | | | |
| | | | | | | | | | |
| | | | | | | | | | |
| | | | | | | | | | |
| | | | | | | | | | |
| | | | | | | | | | |
| | | | | | | | | | |
| | | | | | | | | | |
| | | | | | | | | | |
| | | | | | | | | | |
| | | | | | | | | | |
| | | | | | | | | | |
| | | | | | | | | | |
NOTE 7—NON-CONTROLLING INTEREST AND VARIABLE INTEREST ENTITY
We own a 48.6% limited partner interest in CQP in the form of 239.9 million common units, with the remaining non-controlling limited partner interest held by Blackstone Inc., Brookfield Asset Management Inc. and the public. We also own 100% of the general partner interest and the incentive distribution rights in CQP. CQP is accounted for as a consolidated VIE.
CHENIERE ENERGY, INC. AND SUBSIDIARIES
NOTES TO CONSOLIDATED FINANCIAL STATEMENTS—CONTINUED
(unaudited)
The following table presents the summarized assets and liabilities (in millions) of CQP, our consolidated VIE, which are included in our Consolidated Balance Sheets. The assets in the table below may only be used to settle obligations of CQP. In addition, there is no recourse to us for the consolidated VIE’s liabilities. The assets and liabilities in the table below include third party assets and liabilities of CQP only and exclude intercompany balances that eliminate in consolidation.
| | | | | | | | | | | | | | |
| | |
| | March 31, | | December 31, |
| | 2022 | | 2021 |
| ASSETS | | | | |
| Current assets | | | | |
| Cash and cash equivalents | | $ | 1,156 | | | $ | 876 | |
| Restricted cash and cash equivalents | | 136 | | | 98 | |
| Trade and other receivables, net of current expected credit losses | | 434 | | | 580 | |
| Other current assets | | 266 | | | 285 | |
| Total current assets | | 1,992 | | | 1,839 | |
| | | | |
| | | | |
| Property, plant and equipment, net of accumulated depreciation | | 16,915 | | | 16,830 | |
| Other non-current assets, net | | 309 | | | 316 | |
| | | | |
| Total assets | | $ | 19,216 | | | $ | 18,985 | |
| | | | |
| LIABILITIES | | | | |
| Current liabilities | | | | |
| | | | |
| Accrued liabilities | | $ | 1,164 | | | $ | 1,077 | |
| | | | |
| Other current liabilities | | 404 | | | 200 | |
| | | | |
| Total current liabilities | | 1,568 | | | 1,277 | |
| | | | |
| Long-term debt, net of premium, discount and debt issuance costs | | 17,184 | | | 17,177 | |
| | | | |
| Other non-current liabilities | | 3,086 | | | 100 | |
| Total liabilities | | $ | 21,838 | | | $ | 18,554 | |
| | | | |
| | | | |
| | | | |
| | | | |
| | | | |
NOTE 8—ACCRUED LIABILITIES
Accrued liabilities consisted of the following (in millions):
| | | | | | | | | | | | | | |
| | |
| | March 31, | | December 31, |
| | 2022 | | 2021 |
| Accrued natural gas purchases | | $ | 1,162 | | | $ | 1,323 | |
| Accrued derivative settlements | | 35 | | | 329 | |
| Interest costs and related debt fees | | 367 | | | 214 | |
| LNG terminals and related pipeline costs | | 281 | | | 144 | |
| Compensation and benefits | | 46 | | | 180 | |
| Accrued LNG inventory | | 7 | | | 34 | |
| | | | |
| Other accrued liabilities | | 65 | | | 75 | |
| Total accrued liabilities | | $ | 1,963 | | | $ | 2,299 | |
CHENIERE ENERGY, INC. AND SUBSIDIARIES
NOTES TO CONSOLIDATED FINANCIAL STATEMENTS—CONTINUED
(unaudited)
NOTE 9—DEBT
Our debt consisted of the following (in millions):
| | | | | | | | | | | | | | |
| | |
| | March 31, | | December 31, |
| | 2022 | | 2021 |
| SPL: | | | | |
| Senior Secured Notes: | | | | |
| | | | |
5.625% due 2023 | | $ | 1,500 | | | $ | 1,500 | |
5.75% due 2024 | | 2,000 | | | 2,000 | |
5.625% due 2025 | | 2,000 | | | 2,000 | |
5.875% due 2026 | | 1,500 | | | 1,500 | |
5.00% due 2027 | | 1,500 | | | 1,500 | |
4.200% due 2028 | | 1,350 | | | 1,350 | |
4.500% due 2030 | | 2,000 | | | 2,000 | |
4.27% weighted average rate due 2037 | | 1,282 | | | 1,282 | |
| Total SPL Senior Secured Notes | | 13,132 | | | 13,132 | |
$1.2 billion Working Capital Revolving Credit and Letter of Credit Reimbursement Agreement (the “2020 SPL Working Capital Facility”) | | — | | | — | |
| Total debt - SPL | | 13,132 | | | 13,132 | |
| | | | |
| CQP: | | | | |
| Senior Notes: | | | | |
| | | | |
| | | | |
4.500% due 2029 | | 1,500 | | | 1,500 | |
4.000% due 2031 | | 1,500 | | | 1,500 | |
3.25% due 2032 | | 1,200 | | | 1,200 | |
| Total CQP Senior Notes | | 4,200 | | | 4,200 | |
| CQP Credit Facilities executed in 2019 (“2019 CQP Credit Facilities”) | | — | | | — | |
| Total debt - CQP | | 4,200 | | | 4,200 | |
| | | | |
| CCH: | | | | |
| Senior Secured Notes: | | | | |
7.000% due 2024 | | 1,250 | | | 1,250 | |
5.875% due 2025 | | 1,500 | | | 1,500 | |
5.125% due 2027 | | 1,500 | | | 1,500 | |
3.700% due 2029 | | 1,500 | | | 1,500 | |
3.72% weighted average rate due 2039 | | 2,721 | | | 2,721 | |
| Total CCH Senior Secured Notes | | 8,471 | | | 8,471 | |
| CCH Credit Facility (1) | | 1,439 | | | 1,728 | |
$1.2 billion CCH Working Capital Facility (“CCH Working Capital Facility”) (2) | | — | | | 250 | |
| Total debt - CCH | | 9,910 | | | 10,449 | |
| | | | |
| Cheniere: | | | | |
4.625% Senior Secured Notes due 2028 | | 2,000 | | | 2,000 | |
| | | | |
2045 Cheniere Convertible Senior Notes (3) | | — | | | 625 | |
$1.25 billion Cheniere Revolving Credit Facility (“Cheniere Revolving Credit Facility”) | | — | | | — | |
| | | | |
| Total debt - Cheniere | | 2,000 | | | 2,625 | |
| | | | |
Cheniere Marketing: trade finance facilities and letter of credit facility (2) | | — | | | — | |
| Total debt | | 29,242 | | | 30,406 | |
| | | | |
| Current portion of long-term debt | | (62) | | | (117) | |
| Short-term debt | | — | | | (250) | |
| Unamortized premium, discount and debt issuance costs, net | | (273) | | | (590) | |
| Total long-term debt, net of premium, discount and debt issuance costs | | $ | 28,907 | | | $ | 29,449 | |
(1)A portion of the outstanding balance that is due within one year is classified as current portion of long-term debt.
(2)These debt instruments are classified as short-term debt.
(3)The redemption of these notes was financed with borrowings under the Cheniere Revolving Credit Facility, which is a long-term debt instrument. Therefore, the 2045 Cheniere Convertible Senior Notes were classified as long-term debt as of December 31, 2021. See Convertible Notes section below for further discussion of the redemption.
CHENIERE ENERGY, INC. AND SUBSIDIARIES
NOTES TO CONSOLIDATED FINANCIAL STATEMENTS—CONTINUED
(unaudited)
Credit Facilities
Below is a summary of our committed credit facilities outstanding as of March 31, 2022 (in millions):
| | | | | | | | | | | | | | | | | | | | | | | | | | | | | | | | | | | | | | | | |
| | | | | | | | 2020 SPL Working Capital Facility | | 2019 CQP Credit Facilities | | CCH Credit Facility | | CCH Working Capital Facility | | Cheniere Revolving Credit Facility | | |
| Total facility size | | | | | | | | $ | 1,200 | | | $ | 750 | | | $ | 1,439 | | | $ | 1,200 | | | $ | 1,250 | | | |
| | | | | | | | | | | | | | | | | | |
| Less: | | | | | | | | | | | | | | | | | | |
| Outstanding balance | | | | | | | | — | | | — | | | 1,439 | | | — | | | — | | | |
| | | | | | | | | | | | | | | | | | |
| Letters of credit issued | | | | | | | | 368 | | | — | | | — | | | 276 | | | — | | | |
| Available commitment | | | | | | | | $ | 832 | | | $ | 750 | | | $ | — | | | $ | 924 | | | $ | 1,250 | | | |
| | | | | | | | | | | | | | | | | | |
| Priority ranking | | | | | | | | Senior secured | | Senior secured | | Senior secured | | Senior secured | | Senior secured | | |
| Interest rate on available balance | | | | | | | | LIBOR plus 1.125% - 1.750% or base rate plus 0.125% - 0.750% | | LIBOR plus 1.25% - 2.125% or base rate plus 0.25% - 1.125% | | LIBOR plus 1.75% or base rate plus 0.75% (1) | | LIBOR plus 1.25% - 1.75% or base rate plus 0.25% - 0.75% (1) | | LIBOR plus 1.250% - 2.375% or base rate plus 0.250% - 1.375% (1) | | |
| Weighted average interest rate of outstanding balance | | | | | | | | n/a | | n/a | | 2.21% | | n/a | | n/a | | |
| Commitment fees on undrawn balance | | | | | | | | 0.20% | | 0.49% | | n/a | | 0.50% | | 0.25% | | |
| Maturity date | | | | | | | | March 19, 2025 | | May 29, 2024 | | June 30, 2024 | | June 29, 2023 | | October 28, 2026 | | |
(1)These facilities were amended in 2021 to establish a SOFR-indexed replacement rate for LIBOR.
Convertible Notes
On December 6, 2021, we issued a notice of redemption for all $625 million aggregate principal amount outstanding of the 2045 Cheniere Convertible Senior Notes. The notice of redemption allowed holders to elect to convert their notes at any time prior to a specified deadline on December 31, 2021, with settlement of such converted notes in cash, as elected by us, on January 5, 2022. The impact of holders electing conversion was immaterial to the Consolidated Financial Statements. The 2045 Cheniere Convertible Senior Notes not converted were redeemed on January 5, 2022 with borrowings under the Cheniere Revolving Credit Facility.
Restrictive Debt Covenants
The indentures governing our senior notes and other agreements underlying our debt contain customary terms and events of default and certain covenants that, among other things, may limit us, our subsidiaries’ and its restricted subsidiaries’ ability to make certain investments or pay dividends or distributions. SPL, CQP and CCH are restricted from making distributions under agreements governing their respective indebtedness generally until, among other requirements, deposits are made into any required debt service reserve accounts and a historical debt service coverage ratio and projected debt service coverage ratio of at least 1.25:1.00 is satisfied.
As of March 31, 2022, each of our issuers was in compliance with all covenants related to their respective debt agreements.
CHENIERE ENERGY, INC. AND SUBSIDIARIES
NOTES TO CONSOLIDATED FINANCIAL STATEMENTS—CONTINUED
(unaudited)
Interest Expense
Total interest expense, net of capitalized interest, including interest expense related to our convertible notes, consisted of the following (in millions):
| | | | | | | | | | | | | | | | | | | | |
| | | | | Three Months Ended March 31, |
| | | | | | 2022 | | 2021 | | |
| Interest cost on convertible notes: | | | | | | | | | | |
| Interest per contractual rate | | | | | | $ | — | | | $ | 12 | | | |
| Amortization of debt discount | | | | | | — | | | 5 | | | |
| Amortization of debt issuance costs | | | | | | — | | | — | | | |
| Total interest cost related to convertible notes | | | | | | — | | | 17 | | | |
| Interest cost on debt and finance leases excluding convertible notes | | | | | | 372 | | | 400 | | | |
| Total interest cost | | | | | | 372 | | | 417 | | | |
| Capitalized interest | | | | | | (23) | | | (61) | | | |
| Total interest expense, net of capitalized interest | | | | | | $ | 349 | | | $ | 356 | | | |
Fair Value Disclosures
The following table shows the carrying amount and estimated fair value of our debt (in millions):
| | | | | | | | | | | | | | | | | | | | | | | | | | |
| | | March 31, 2022 | | December 31, 2021 |
| | | Carrying
Amount | | Estimated
Fair Value | | Carrying
Amount | | Estimated
Fair Value |
Senior notes — Level 2 (1) | | $ | 24,550 | | | $ | 25,196 | | | $ | 24,550 | | | $ | 26,725 | |
Senior notes — Level 3 (2) | | 3,253 | | | 3,356 | | | 3,253 | | | 3,693 | |
| | | | | | | | |
| | | | | | | | |
| | | | | | | | |
| 2045 Cheniere Convertible Senior Notes — Level 1 (3) | | — | | | — | | | 625 | | | 526 | |
(1)The Level 2 estimated fair value was based on quotes obtained from broker-dealers or market makers of these senior notes and other similar instruments.
(2)The Level 3 estimated fair value was calculated based on inputs that are observable in the market or that could be derived from, or corroborated with, observable market data, including our stock price and interest rates based on debt issued by parties with comparable credit ratings to us and inputs that are not observable in the market.
(3)The Level 1 estimated fair value was based on unadjusted quoted prices in active markets for identical liabilities that we had the ability to access at the measurement date.
The estimated fair value of our credit facilities approximates the principal amount outstanding because the interest rates are variable and reflective of market rates and the debt may be repaid, in full or in part, at any time without penalty.
CHENIERE ENERGY, INC. AND SUBSIDIARIES
NOTES TO CONSOLIDATED FINANCIAL STATEMENTS—CONTINUED
(unaudited)
NOTE 10—LEASES
Our leased assets consist primarily of LNG vessel time charters (“vessel charters”) and additionally include tug vessels, office space and facilities and land sites. All of our leases are classified as operating leases except for our tug vessels supporting the Corpus Christi LNG Terminal, which are classified as finance leases.
The following table shows the classification and location of our right-of-use assets and lease liabilities on our Consolidated Balance Sheets (in millions):
| | | | | | | | | | | | | | | | | |
| | | |
| | | March 31, | | December 31, |
| Consolidated Balance Sheets Location | | 2022 | | 2021 |
| Right-of-use assets—Operating | Operating lease assets | | $ | 1,975 | | | $ | 2,102 | |
| Right-of-use assets—Financing | Property, plant and equipment, net of accumulated depreciation | | 49 | | | 50 | |
| Total right-of-use assets | | | $ | 2,024 | | | $ | 2,152 | |
| | | | | |
| Current operating lease liabilities | Current operating lease liabilities | | $ | 527 | | | $ | 535 | |
| Current finance lease liabilities | Other current liabilities | | 2 | | | 2 | |
| Non-current operating lease liabilities | Operating lease liabilities | | 1,423 | | | 1,541 | |
| Non-current finance lease liabilities | Finance lease liabilities | | 57 | | | 57 | |
| Total lease liabilities | | | $ | 2,009 | | | $ | 2,135 | |
The following table shows the classification and location of our lease costs on our Consolidated Statements of Operations (in millions):
| | | | | | | | | | | | | | | | | | | | | | | |
| Consolidated Statements of Operations Location | | | | Three Months Ended March 31, |
| | | | | | 2022 | | 2021 | | |
| Operating lease cost (a) | Operating costs and expenses (1) | | | | | | $ | 202 | | | $ | 151 | | | |
| Finance lease cost: | | | | | | | | | | | |
| Amortization of right-of-use assets | Depreciation and amortization expense | | | | | | 1 | | | 1 | | | |
| Interest on lease liabilities | Interest expense, net of capitalized interest | | | | | | 2 | | | 2 | | | |
| | | | | | | | | | | |
| Total lease cost | | | | | | | $ | 205 | | | $ | 154 | | | |
| | | | | | | | | | | |
| (a) Included in operating lease cost: | | | | | | | | | | | |
| Short-term lease costs | | | | | | | $ | 41 | | | $ | 51 | | | |
| Variable lease costs | | | | | | | 9 | | | 2 | | | |
(1)Presented in cost of sales, operating and maintenance expense or selling, general and administrative expense consistent with the nature of the asset under lease.
Future annual minimum lease payments for operating and finance leases as of March 31, 2022 are as follows (in millions):
| | | | | | | | | | | |
| Years Ending December 31, | Operating Leases (1) | | Finance Leases |
| 2022 | $ | 450 | | | $ | 10 | |
| 2023 | 514 | | | 10 | |
| 2024 | 457 | | | 10 | |
| 2025 | 244 | | | 10 | |
| 2026 | 218 | | | 10 | |
| Thereafter | 294 | | | 117 | |
| Total lease payments | 2,177 | | | 167 | |
| Less: Interest | (227) | | | (108) | |
| Present value of lease liabilities | $ | 1,950 | | | $ | 59 | |
(1)Does not include approximately $3.2 billion of legally binding minimum payments primarily for vessel charters which were executed as of March 31, 2022 but will commence in future periods and have fixed minimum lease terms of up to 10 years.
CHENIERE ENERGY, INC. AND SUBSIDIARIES
NOTES TO CONSOLIDATED FINANCIAL STATEMENTS—CONTINUED
(unaudited)
The following table shows the weighted-average remaining lease term and the weighted-average discount rate for our operating leases and finance leases:
| | | | | | | | | | | | | | | | | | | | | | | |
| March 31, 2022 | | December 31, 2021 |
| Operating Leases | | Finance Leases | | Operating Leases | | Finance Leases |
| Weighted-average remaining lease term (in years) | 5.4 | | 16.4 | | 5.6 | | 16.7 |
| Weighted-average discount rate (1) | 3.5% | | 16.2% | | 3.6% | | 16.2% |
(1)The finance leases commenced prior to the adoption of the current leasing standard under GAAP. In accordance with previous accounting guidance, the implied rate is based on the fair value of the underlying assets.
The following table includes other quantitative information for our operating and finance leases (in millions):
| | | | | | | | | | | | | |
| Three Months Ended March 31, |
| 2022 | | 2021 | | |
| Cash paid for amounts included in the measurement of lease liabilities: | | | | | |
| Operating cash flows from operating leases | $ | 151 | | | $ | 97 | | | |
| Operating cash flows from finance leases | 2 | | | 2 | | | |
| | | | | |
| Right-of-use assets obtained in exchange for operating lease liabilities | 7 | | | 507 | | | |
LNG Vessel Subcharters
From time to time, we sublease certain LNG vessels under charter to third parties while retaining our existing obligation to the original lessor. As of March 31, 2022 and December 31, 2021, we had $4 million and $15 million future minimum sublease payments to be received from LNG vessel subcharters. The following table shows the sublease income recognized in other revenues on our Consolidated Statements of Operations (in millions):
| | | | | | | | | | | | | | | | | | | | |
| | | | Three Months Ended March 31, |
| | | | | | 2022 | | 2021 | | |
| Fixed income | | | | | | $ | 32 | | | $ | 3 | | | |
| Variable income | | | | | | 19 | | | 1 | | | |
| Total sublease income | | | | | | $ | 51 | | | $ | 4 | | | |
NOTE 11—REVENUES FROM CONTRACTS WITH CUSTOMERS
The following table represents a disaggregation of revenue earned from contracts with customers (in millions):
| | | | | | | | | | | | | | | | | | | | |
| | | | Three Months Ended March 31, |
| | | | | | 2022 | | 2021 | | |
| LNG revenues | | | | | | $ | 7,564 | | | $ | 3,039 | | | |
| Regasification revenues | | | | | | 68 | | | 67 | | | |
| Other revenues | | | | | | 25 | | | 20 | | | |
| | | | | | | | | | |
| Total revenues from customers | | | | | | 7,657 | | | 3,126 | | | |
| Net derivative loss (1) | | | | | | (224) | | | (40) | | | |
| Other (2) | | | | | | 51 | | | 4 | | | |
| Total revenues | | | | | | $ | 7,484 | | | $ | 3,090 | | | |
(2)Includes revenues from LNG vessel subcharters. See Note 10—Leases for additional information about our subleases.
Contract Assets and Liabilities
The following table shows our contract assets, net of current expected credit losses, which are classified as other current assets and other non-current assets, net on our Consolidated Balance Sheets (in millions):
| | | | | | | | | | | | | | |
| | |
| | March 31, | | December 31, |
| | 2022 | | 2021 |
| Contract assets, net of current expected credit losses | | $ | 149 | | | $ | 140 | |
CHENIERE ENERGY, INC. AND SUBSIDIARIES
NOTES TO CONSOLIDATED FINANCIAL STATEMENTS—CONTINUED
(unaudited)
The following table reflects the changes in our contract liabilities, which we classify as deferred revenue and other non-current liabilities on our Consolidated Balance Sheets (in millions):
| | | | | | | | | | |
| | |
| | Three Months Ended March 31, 2022 | | |
| Deferred revenue, beginning of period | | $ | 194 | | | |
| Cash received but not yet recognized in revenue | | 169 | | | |
| Revenue recognized from prior period deferral | | (194) | | | |
| Deferred revenue, end of period | | $ | 169 | | | |
Transaction Price Allocated to Future Performance Obligations
Because many of our sales contracts have long-term durations, we are contractually entitled to significant future consideration which we have not yet recognized as revenue. The following table discloses the aggregate amount of the transaction price that is allocated to performance obligations that have not yet been satisfied:
| | | | | | | | | | | | | | | | | | | | | | | | | | |
| | March 31, 2022 | | December 31, 2021 |
| | Unsatisfied Transaction Price (in billions) | | Weighted Average Recognition Timing (years) (1) | | Unsatisfied Transaction Price (in billions) | | Weighted Average Recognition Timing (years) (1) |
| LNG revenues | | $ | 107.1 | | | 9 | | $ | 107.1 | | | 9 |
| Regasification revenues | | 1.8 | | | 4 | | 1.9 | | | 4 |
| Total revenues | | $ | 108.9 | | | | | $ | 109.0 | | | |
(1)The weighted average recognition timing represents an estimate of the number of years during which we shall have recognized half of the unsatisfied transaction price.
We have elected the following exemptions which omit certain potential future sources of revenue from the table above:
(1)We omit from the table above all performance obligations that are part of a contract that has an original expected duration of one year or less.
(2)The table above excludes substantially all variable consideration under our SPAs and TUAs. We omit from the table above all variable consideration that is allocated entirely to a wholly unsatisfied performance obligation or to a wholly unsatisfied promise to transfer a distinct good or service that forms part of a single performance obligation when that performance obligation qualifies as a series. The amount of revenue from variable fees that is not included in the transaction price will vary based on the future prices of Henry Hub throughout the contract terms, to the extent customers elect to take delivery of their LNG, and adjustments to the consumer price index. Certain of our contracts contain additional variable consideration based on the outcome of contingent events and the movement of various indexes. We have not included such variable consideration in the transaction price to the extent the consideration is considered constrained due to the uncertainty of ultimate pricing and receipt. Approximately 66% and 51% of our LNG revenues from contracts included in the table above during the three months ended March 31, 2022 and 2021, respectively, were related to variable consideration received from customers. During the three months ended March 31, 2022 and 2021, approximately 6% and 3%, respectively, of our regasification revenues were related to variable consideration received from customers.
We may enter into contracts to sell LNG that are conditioned upon one or both of the parties achieving certain milestones such as reaching FID on a certain liquefaction Train, obtaining financing or achieving substantial completion of a Train and any related facilities. These contracts are considered completed contracts for revenue recognition purposes and are included in the transaction price above when the conditions are considered probable of being met.
CHENIERE ENERGY, INC. AND SUBSIDIARIES
NOTES TO CONSOLIDATED FINANCIAL STATEMENTS—CONTINUED
(unaudited)
NOTE 12—RELATED PARTY TRANSACTIONS
Natural Gas Supply Agreements
CCL Natural Gas Supply Agreement
CCL was party to a natural gas supply agreement with a related party in the ordinary course of business, to obtain a fixed minimum daily volume of feed gas for the operation of the CCL Project. The related party entity was acquired by a non-related party on November 1, 2021; therefore, as of such date, this agreement ceased to be considered a related party agreement. During the three months ended March 31, 2021, we recorded $35 million of cost of sales related to this agreement, of which $1 millionwas related to Liquefaction Supply Derivatives gain.
Natural Gas Transportation and Storage Agreements
SPL is party to various natural gas transportation and storage agreements and CTPL is party to an operational balancing agreement with a related party in the ordinary course of business for the operation of the SPL Project, with initial primary terms of up to 10 years with extension rights. This related party is partially owned by Brookfield Asset Management, Inc., who indirectly acquired a portion of CQP’s limited partner interests in September 2020. We recorded operating and maintenance expense of $12 million and $10 million during the three months ended March 31, 2022 and 2021, respectively. Additionally, we recorded accrued liabilities of $5 million and $4 million as of March 31, 2022 and December 31, 2021, respectively, with this related party.
CCL is party to natural gas transportation agreements with Midship Pipeline Company, LLC (“Midship Pipeline”) in the ordinary course of business for the operation of the CCL Project, for a period of 10 years which began in May 2020. We account for our investment in Midship Holdings, LLC, which manages the business and affairs of Midship Pipeline, as an equity method investment. We recorded operating and maintenance expense of $2 million during both the three months ended March 31, 2022 and 2021. Additionally, we recorded accrued liabilities of $1 million as of both March 31, 2022 and December 31, 2021 with this related party.
Operation and Maintenance Service Agreements
Cheniere LNG O&M Services, LLC (“O&M Services”), our wholly owned subsidiary, provides the development, construction, operation and maintenance services to Midship Pipeline pursuant to agreements in which O&M Services receives an agreed upon fee and reimbursement of costs incurred. O&M Services recorded $2 million in each of the three months ended March 31, 2022 and 2021, of other revenues and $1 million and $2 million of other receivables as of March 31, 2022 and December 31, 2021, respectively, for services provided to Midship Pipeline under these agreements.
NOTE 13—INCOME TAXES
We recorded an income tax benefit of $191 million and income tax provision of $89 million during the three months ended March 31, 2022 and 2021, respectively.
Our effective tax rate of 19.7% for the three months ended March 31, 2022 corresponds to an income tax benefit recorded for the period and was lower than the statutory income tax rate primarily due to income allocated to non-controlling interest that is not taxable to Cheniere partially offset by tax benefits related to stock-based compensation awards that vested in the quarter. Our effective tax rate of 13.5% for the three months ended March 31, 2021 corresponds to an income tax provision recorded for the period and was lower than the statutory income tax rate primarily due to income allocated to non-controlling interest that is not taxable to Cheniere.
Our effective tax rate is subject to variation prospectively due to variability in our pre-tax and taxable earnings and the proportion of such earnings attributable to non-controlling interests.
CHENIERE ENERGY, INC. AND SUBSIDIARIES
NOTES TO CONSOLIDATED FINANCIAL STATEMENTS—CONTINUED
(unaudited)
NOTE 14—NET INCOME (LOSS) PER SHARE ATTRIBUTABLE TO COMMON STOCKHOLDERS
The following table reconciles basic and diluted weighted average common shares outstanding (in millions, except per share data):
| | | | | | | | | | | | | | | | | | | | |
| | | | Three Months Ended March 31, |
| | | | | | 2022 | | 2021 | | |
| Net income (loss) attributable to common stockholders | | | | | | $ | (865) | | | $ | 393 | | | |
| | | | | | | | | | |
| Weighted average common shares outstanding: | | | | | | | | | | |
| Basic | | | | | | 254.0 | | | 252.9 | | | |
| Dilutive unvested stock | | | | | | — | | | 1.5 | | | |
| Dilutive convertible securities | | | | | | — | | | 4.5 | | | |
| Diluted | | | | | | 254.0 | | | 258.9 | | | |
| | | | | | | | | | |
Net income (loss) per share attributable to common stockholders—basic (1) | | | | | | $ | (3.41) | | | $ | 1.56 | | | |
Net income (loss) per share attributable to common stockholders—diluted (1) | | | | | | $ | (3.41) | | | $ | 1.54 | | | |
(1)Earnings per share in the table may not recalculate exactly due to rounding because it is calculated based on whole numbers, not the rounded numbers presented.
Potentially dilutive securities that were not included in the diluted net income (loss) per share computations because their effects would have been anti-dilutive were as follows (in millions):
| | | | | | | | | | | | | | | | | | |
| | | | Three Months Ended March 31, |
| | | | | | 2022 | | 2021 | | |
| Unvested stock (1) | | | | | | 2.0 | | | 1.9 | | | |
| | | | | | | | | | |
| | | | | | | | | | |
| | | | | | | | | | |
| 2045 Cheniere Convertible Senior Notes (2) | | | | | | 0.3 | | | — | | | |
| Total potentially dilutive common shares | | | | | | 2.3 | | | 1.9 | | | |
(1)Includes the impact of unvested shares containing performance conditions to the extent that the underlying performance conditions are satisfied based on actual results as of the respective dates.
(2)As described in Note 9—Debt, the 2045 Cheniere Convertible Senior Notes were redeemed or converted in cash on January 5, 2022. However, the adoption of ASU 2020-06 on January 1, 2022 required a presumption of share settlement for the purpose of calculating the impact to diluted earnings per share during the period the notes were outstanding in 2022. Such impact was anti-dilutive as a result of the reported net loss attributable to common shareholders during the period. See Note 1—Nature of Operations and Basis of Presentation for further discussion of our adoption of ASU 2020-06.
NOTE 15—STOCKHOLDERS’ DEFICIT
Share Repurchase Programs
On September 7, 2021, the Board of Directors authorized a reset in the previously existing share repurchase program to $1.0 billion, inclusive of any amounts remaining under the previous authorization as of September 30, 2021, for an additional three years beginning on October 1, 2021. The following table presents information with respect to repurchases of common stock (in millions, except per share data):
| | | | | | | | | | | | | | | | | |
| | | Three Months Ended March 31, |
| | | | | 2022 | | 2021 | | |
| Aggregate common stock repurchased | | | | | 0.24 | | | — | | | |
| Weighted average price paid per share | | | | | $ | 104.21 | | | $ | — | | | |
| Total amount paid | | | | | $ | 25 | | | $ | — | | | |
As of March 31, 2022, we had up to $973 million of the share repurchase program available.
CHENIERE ENERGY, INC. AND SUBSIDIARIES
NOTES TO CONSOLIDATED FINANCIAL STATEMENTS—CONTINUED
(unaudited)
Dividends
On January 25, 2022, we declared a quarterly dividend of $0.33 per share of common stock that was paid on February 28, 2022 to shareholders of record as of February 7, 2022. On April 26, 2022, we declared a quarterly dividend of $0.33 per share of common stock that is payable on May 17, 2022 to shareholders of record as of May 10, 2022.
NOTE 16—CUSTOMER CONCENTRATION
The following table shows external customers with revenues of 10% or greater of total revenues from external customers and external customers with trade and other receivables, net of current expected credit losses and contract assets, net of current expected credit losses balances of 10% or greater of total trade and other receivables, net of current expected credit losses from external customers and contract assets, net of current expected credit losses from external customers, respectively:
| | | | | | | | | | | | | | | | | | | | | | | | | | | | | | | | |
| | | | | | Percentage of Total Revenues from External Customers | | Percentage of Trade and Other Receivables, Net and Contract Assets, Net from External Customers |
| | | | Three Months Ended March 31, | | March 31, | | December 31, |
| | | | | | |
| | | | | | 2022 | | 2021 | | | | 2022 | | 2021 |
| Customer A | | | | | | * | | 15% | | | | * | | 10% |
| Customer B | | | | | | * | | 12% | | | | * | | * |
| Customer C | | | | | | * | | 13% | | | | * | | * |
| Customer D | | | | | | * | | * | | | | 10% | | * |
| | | | | | | | | | | | | | |
| | | | | | | | | | | | | | |
| | | | | | | | | | | | | | |
| | | | | | | | | | | | | | |
* Less than 10%
NOTE 17—SUPPLEMENTAL CASH FLOW INFORMATION
The following table provides supplemental disclosure of cash flow information (in millions):
| | | | | | | | | | | | | |
| Three Months Ended March 31, |
| 2022 | | 2021 | | |
| Cash paid during the period for interest on debt, net of amounts capitalized | $ | 195 | | | $ | 211 | | | |
| Cash paid for income taxes, net of refunds | 4 | | | — | | | |
| Non-cash investing and financing activities: | | | | | |
| Property, plant and equipment, net of accumulated depreciation funded with accounts payable and accrued liabilities | 400 | | | 360 | | | |
| | | | | |
| | | | | |
ITEM 2. MANAGEMENT’S DISCUSSION AND ANALYSIS OF FINANCIAL CONDITION AND RESULTS OF OPERATIONS
Information Regarding Forward-Looking Statements
This quarterly report contains certain statements that are, or may be deemed to be, “forward-looking statements” within the meaning of Section 27A of the Securities Act of 1933, as amended (the “Securities Act”), and Section 21E of the Securities Exchange Act of 1934, as amended (the “Exchange Act”). All statements, other than statements of historical or present facts or conditions, included herein or incorporated herein by reference are “forward-looking statements.” Included among “forward-looking statements” are, among other things:
•statements that we expect to commence or complete construction of our proposed LNG terminals, liquefaction facilities, pipeline facilities or other projects, or any expansions or portions thereof, by certain dates, or at all;
•statements regarding future levels of domestic and international natural gas production, supply or consumption or future levels of LNG imports into or exports from North America and other countries worldwide or purchases of natural gas, regardless of the source of such information, or the transportation or other infrastructure or demand for and prices related to natural gas, LNG or other hydrocarbon products;
•statements regarding any financing transactions or arrangements, or our ability to enter into such transactions;
•statements relating to Cheniere’s capital deployment, including intent, ability, extent, and timing of capital expenditures, debt repayment, dividends, and share repurchases;
•statements regarding our future sources of liquidity and cash requirements;
•statements relating to the construction of our Trains and pipelines, including statements concerning the engagement of any EPC contractor or other contractor and the anticipated terms and provisions of any agreement with any EPC or other contractor, and anticipated costs related thereto;
•statements regarding any SPA or other agreement to be entered into or performed substantially in the future, including any revenues anticipated to be received and the anticipated timing thereof, and statements regarding the amounts of total LNG regasification, natural gas liquefaction or storage capacities that are, or may become, subject to contracts;
•statements regarding counterparties to our commercial contracts, construction contracts and other contracts;
•statements regarding our planned development and construction of additional Trains or pipelines, including the financing of such Trains or pipelines;
•statements that our Trains, when completed, will have certain characteristics, including amounts of liquefaction capacities;
•statements regarding our business strategy, our strengths, our business and operation plans or any other plans, forecasts, projections, or objectives, including anticipated revenues, capital expenditures, maintenance and operating costs and cash flows, any or all of which are subject to change;
•statements regarding legislative, governmental, regulatory, administrative or other public body actions, approvals, requirements, permits, applications, filings, investigations, proceedings or decisions;
•statements regarding our anticipated LNG and natural gas marketing activities;
•statements regarding the COVID-19 pandemic and its impact on our business and operating results, including any customers not taking delivery of LNG cargoes, the ongoing creditworthiness of our contractual counterparties, any disruptions in our operations or construction of our Trains and the health and safety of our employees, and on our customers, the global economy and the demand for LNG; and
•any other statements that relate to non-historical or future information.
All of these types of statements, other than statements of historical or present facts or conditions, are forward-looking statements. In some cases, forward-looking statements can be identified by terminology such as “may,” “will,” “could,” “should,” “achieve,” “anticipate,” “believe,” “contemplate,” “continue,” “estimate,” “expect,” “intend,” “plan,” “potential,” “predict,” “project,” “pursue,” “target,” the negative of such terms or other comparable terminology. The forward-looking statements contained in this quarterly report are largely based on our expectations, which reflect estimates and assumptions
made by our management. These estimates and assumptions reflect our best judgment based on currently known market conditions and other factors. Although we believe that such estimates are reasonable, they are inherently uncertain and involve a number of risks and uncertainties beyond our control. In addition, assumptions may prove to be inaccurate. We caution that the forward-looking statements contained in this quarterly report are not guarantees of future performance and that such statements may not be realized or the forward-looking statements or events may not occur. Actual results may differ materially from those anticipated or implied in forward-looking statements as a result of a variety of factors described in this quarterly report and in the other reports and other information that we file with the SEC, including those discussed under “Risk Factors” in our annual report on Form 10-K for the fiscal year ended December 31, 2021. All forward-looking statements attributable to us or persons acting on our behalf are expressly qualified in their entirety by these risk factors. These forward-looking statements speak only as of the date made, and other than as required by law, we undertake no obligation to update or revise any forward-looking statement or provide reasons why actual results may differ, whether as a result of new information, future events or otherwise.
Introduction
The following discussion and analysis presents management’s view of our business, financial condition and overall performance and should be read in conjunction with our Consolidated Financial Statements and the accompanying notes. This information is intended to provide investors with an understanding of our past performance, current financial condition and outlook for the future.
Our discussion and analysis includes the following subjects:
Overview
Cheniere, a Delaware corporation, is a Houston-based energy infrastructure company primarily engaged in LNG-related businesses. We provide clean, secure and affordable LNG to integrated energy companies, utilities and energy trading companies around the world. We aspire to conduct our business in a safe and responsible manner, delivering a reliable, competitive and integrated source of LNG to our customers.
LNG is natural gas (methane) in liquid form. The LNG we produce is shipped all over the world, turned back into natural gas (called “regasification”) and then transported via pipeline to homes and businesses and used as an energy source that is essential for heating, cooking and other industrial uses. Natural gas is a cleaner-burning, abundant and affordable source of energy. When LNG is converted back to natural gas, it can be used instead of coal, which reduces the amount of pollution traditionally produced from burning fossil fuels, like sulfur dioxide and particulate matter that enters the air we breathe. Additionally, compared to coal, it produces significantly fewer carbon emissions. By liquefying natural gas, we are able to reduce its volume by 600 times so that we can load it onto special LNG carriers designed to keep the LNG cold and in liquid form for efficient transport overseas.
We own and operate the natural gas liquefaction and export facility located in Cameron Parish, Louisiana at Sabine Pass (the “Sabine Pass LNG Terminal”), one of the largest LNG production facilities in the world, through our ownership interest in and management agreements with CQP, which is a publicly traded limited partnership that we formed in 2007. As of March 31, 2022, we owned 100% of the general partner interest and a 48.6% limited partner interests in CQP. The Sabine Pass LNG Terminal has six operational Trains, with Train 6 achieving substantial completion on February 4, 2022, for a total production capacity of approximately 30 mtpa of LNG (the “SPL Project”). The Sabine Pass LNG Terminal also has operational regasification facilities that include five LNG storage tanks with aggregate capacity of approximately 17 Bcfe, two existing marine berths and one under construction that can each accommodate vessels with nominal capacity of up to 266,000 cubic meters and vaporizers with regasification capacity of approximately 4 Bcf/d. CQP also owns a 94-mile pipeline through its
subsidiary, CTPL, that interconnects the Sabine Pass LNG Terminal with a number of large interstate pipelines (the “Creole Trail Pipeline”).
We also own and operate the natural gas liquefaction and export facility located near Corpus Christi, Texas (the “Corpus Christi LNG Terminal”) through CCL, which has natural gas liquefaction facilities consisting of three operational Trains for a total production capacity of approximately 15 mtpa of LNG. Additionally, we own and operate through CCP a 21.5-mile natural gas supply pipeline that interconnects the Corpus Christi LNG Terminal with several interstate and intrastate natural gas pipelines (the “Corpus Christi Pipeline” and together with the Trains, the “CCL Project”). The CCL Project also includes three LNG storage tanks with aggregate capacity of approximately 10 Bcfe and two marine berths that can each accommodate vessels with nominal capacity of up to 266,000 cubic meters.
We are the largest producer of LNG in the United States and the second largest LNG producer globally, based on the total production capacity of our asset platforms of approximately 45 mtpa as of March 31, 2022.
Additionally, separate from the CCH Group, we are developing an expansion of the Corpus Christi LNG Terminal adjacent to the CCL Project (“Corpus Christi Stage 3”) through our subsidiary CCL Stage III for up to seven midscale Trains with an expected total production capacity of over 10 mtpa of LNG. We received approval from FERC in November 2019 to site, construct and operate the expansion project.
Our customer arrangements provide us with significant, stable and long-term cash flows. We contract our anticipated production capacity under SPAs, in which our customers are generally required to pay a fixed fee with respect to the contracted volumes irrespective of their election to cancel or suspend deliveries of LNG cargoes, and under IPM agreements, in which the gas producer sells to us gas on a global LNG index price, less a fixed liquefaction fee, shipping and other costs. We have contracted over 95% of the total production capacity from the SPL Project and the CCL Project (collectively, the “Liquefaction Projects”), including those contracts executed to support Corpus Christi Stage 3, through the 2020s and over 90% contracted through the mid-2030s. Excluding contracts with terms less than 10 years, our SPAs and IPM agreements had approximately 17 years of weighted average remaining life as of March 31, 2022. We also market and sell LNG produced by the Liquefaction Projects that is not required for other customers through our integrated marketing function. In March 2022, the DOE authorized the export of an additional 152.64 Bcf/yr and 108.16 Bcf/yr of domestically produced LNG by vessel from the Sabine Pass LNG Terminal and the Corpus Christi LNG Terminal, respectively, through December 31, 2050 to non-FTA countries, that were previously authorized for FTA countries only. For further discussion of the contracted future cash flows under our revenue arrangements, see the liquidity and capital resources disclosures in our annual report on Form 10-K for the fiscal year ended December 31, 2021.
We remain focused on operational excellence and customer satisfaction. Increasing demand for LNG has allowed us to expand our liquefaction infrastructure in a financially disciplined manner. We have increased available liquefaction capacity at our Liquefaction Projects as a result of debottlenecking and other optimization projects. We hold significant land positions at both the Sabine Pass LNG Terminal and the Corpus Christi LNG Terminal, which provide opportunity for further liquefaction capacity expansion. The development of these sites or other projects, including infrastructure projects in support of natural gas supply and LNG demand, will require, among other things, acceptable commercial and financing arrangements before we can make a final investment decision (“FID”).
Additionally, we are committed to the responsible and proactive management of our most important environmental, social and governance (“ESG”) impacts, risks and opportunities. We published our 2020 Corporate Responsibility (“CR”) report, which details our strategy and progress on ESG issues, as well as our efforts on integrating climate considerations into our business strategy and taking a leadership position on increased environmental transparency, including conducting a climate scenario analysis and our plan to provide LNG customers with Cargo Emission Tags. In April 2022, we announced a collaboration with natural gas midstream companies, methane detection technology providers and leading academic institutions to implement quantification, monitoring, reporting and verification of greenhouse gas emissions at natural gas gathering, processing, transmission and storage systems specific to our supply chain. Our CR report is available at cheniere.com/IMPACT. Information on our website, including the CR report, is not incorporated by reference into this Quarterly Report on Form 10-Q.
Overview of Significant Events
Our significant events since January 1, 2022 and through the filing date of this Form 10-Q include the following:
Strategic
•In May 2022, CCL Stage III entered into an IPM agreement with ARC Resources U.S. Corp, a subsidiary of ARC Resources, Ltd., to purchase 140,000 MMBtu per day of natural gas at a price based on JKM, for a term of approximately 15 years commencing with commercial operations of Train 7 of Corpus Christi Stage 3, subject to FID of Corpus Christi Stage 3.
•In March 2022, CCL Stage III entered into an EPC contract with Bechtel Oil, Gas and Chemicals, Inc. (“Bechtel”) for Corpus Christi Stage 3 for a contract price of approximately $5.5 billion, subject to adjustment only by change order. CCL Stage III also issued a limited notice to proceed to Bechtel to commence early engineering, procurement and site works.
•In March 2022, CCL amended its existing long-term SPA with Engie SA (“Engie”), increasing the volume Engie has agreed to purchase from CCL to approximately 0.9 mtpa of LNG on a free-on-board basis, and extending the term to approximately 20 years, which began in September 2021.
•In February 2022, CCL Stage III amended the IPM agreement previously entered into with EOG Resources, Inc. (“EOG”), increasing the volume and term of natural gas supply from 140,000 MMBtu per day for 10 years, to 420,000 MMBtu per day for 15 years, with pricing continuing to be based on the Platts Japan Korea Marker (“JKM”). Under the amended IPM agreement, supply is targeted to commence upon completion of Trains 1, 4 and 5 of Corpus Christi Stage 3. In addition, the previously executed gas supply agreement, under which EOG sells 300,000 MMBtu per day to CCL Stage III at a price indexed to Henry Hub, has been extended by 5 years, resulting in a 15 year term that is expected to commence upon start-up of the amended IPM agreement.
Operational
•As of April 30, 2022, over 2,100 cumulative LNG cargoes totaling over 145 million tonnes of LNG have been produced, loaded and exported from the Liquefaction Projects.
•On February 4, 2022, substantial completion of Train 6 of the SPL Project was achieved.
Financial
•During the three months ended March 31, 2022, we used $1.1 billion of available cash to reduce our outstanding indebtedness, of which over $0.8 billion was the redemption or prepayment of long-term indebtedness pursuant to our capital allocation plan, including the early redemption of our 4.25% Convertible Senior Notes due 2045 (the “2045 Cheniere Convertible Senior Notes”) in January 2022.
•Also in line with our capital allocation plan, during the three months ended March 31, 2022, we repurchased 238,537 shares of our common stock as part of our share repurchase program for $25 million and paid a quarterly dividend of $0.33 per share of common stock on February 28, 2022.
Results of Operations
The following charts summarize the total revenues and total LNG volumes loaded from our Liquefaction Projects during the three months ended March 31, 2022 and 2021:
The following table summarizes the volumes of operational and commissioning LNG cargoes that were loaded from the Liquefaction Projects, which were recognized on our Consolidated Financial Statements:
| | | | | | | | | | | | | | | |
| | | Three Months Ended March 31, 2022 |
| (in TBtu) | | | | | Operational | | Commissioning |
| Volumes loaded during the current period | | | | | 572 | | | 13 | |
| Volumes loaded during the prior period but recognized during the current period | | | | | 49 | | | 1 | |
| Less: volumes loaded during the current period and in transit at the end of the period | | | | | (40) | | | — | |
| Total volumes recognized in the current period | | | | | 581 | | | 14 | |
Net income (loss) attributable to common stockholders
| | | | | | | | | | | | | | | | | | | | | | | | | | | | | | |
| | | Three Months Ended March 31, | | | | | |
| (in millions, except per share data) | | | | | | | 2022 | | 2021 | | | | Variance | | | |
| Net income (loss) attributable to common stockholders | | | | | | | $ | (865) | | | $ | 393 | | | | | $ | (1,258) | | | | | | |
Net income (loss) per share attributable to common stockholders—basic | | | | | | | (3.41) | | | 1.56 | | | | | (4.97) | | | | | | |
Net income (loss) per share attributable to common stockholders—diluted | | | | | | | (3.41) | | | 1.54 | | | | | (4.95) | | | | | | |
Our net loss attributable to common stockholders was $865 million for the three months ended March 31, 2022, compared to net income attributable to common stockholders of $393 million for the three months ended March 31, 2021. The $1.3 billion decrease was primarily due to an increase in derivative losses from changes in fair value and settlements of $3.5 billion (pre-tax and excluding the impact of non-controlling interest) between the periods, as further described below, and lower contribution from certain portfolio optimization activities. This impact was partially offset by increases in gross margin on LNG delivered per MMBtu and, to a lesser extent, an increase in volume delivered during the three months ended March 31, 2022 from the comparable period in 2021, as well as a decrease in the income tax provision.
Substantially all derivative losses relate to the use of commodity derivative instruments indexed to international LNG prices, primarily related to our IPM agreements. While operationally we utilize commodity derivatives to mitigate price volatility for commodities procured or sold over a period of time, as a result of significant appreciation in forward international LNG commodity curves during the three months ended March 31, 2022, we recognized $3.1 billion of non-cash unfavorable changes in fair value attributed to positions indexed to such prices (pre-tax and excluding the impact of non-controlling interest).
Derivative instruments, which in addition to managing exposure to commodity-related marketing and price risks are utilized to manage exposure to changing interest rates and foreign exchange volatility, are reported at fair value on our Consolidated Financial Statements. For commodity derivative instruments related to our IPM agreements, the underlying transactions being economically hedged are accounted for under the accrual method of accounting, whereby revenues and expenses are recognized only upon delivery, receipt or realization of the underlying transaction. Because the recognition of derivative instruments at fair value has the effect of recognizing gains or losses relating to future period exposure, and given the significant volumes, long-term duration and volatility in price basis for certain of our derivative contracts, use of derivative instruments may result in continued volatility of our results of operations based on changes in market pricing, counterparty credit risk and other relevant factors, notwithstanding the operational intent to mitigate risk exposure over time.
Revenues
| | | | | | | | | | | | | | | | | | | | | | | | | | | | | | | |
| | | Three Months Ended March 31, | | | | | | |
| (in millions) | | | | | | | 2022 | | 2021 | | | | Variance | | | | |
| LNG revenues | | | | | | | $ | 7,340 | | | $ | 2,999 | | | | | $ | 4,341 | | | | | | | |
| Regasification revenues | | | | | | | 68 | | | 67 | | | | | 1 | | | | | | | |
| Other revenues | | | | | | | 76 | | | 24 | | | | | 52 | | | | | | | |
| | | | | | | | | | | | | | | | | | | |
| Total revenues | | | | | | | $ | 7,484 | | | $ | 3,090 | | | | | $ | 4,394 | | | | | | | |
Total revenues increased during the three months ended March 31, 2022 from the comparable period in 2021, primarily as a result of increased revenues per MMBtu and, to a lesser extent, from higher volume of LNG delivered between the periods. Revenues per MMBtu of LNG were higher due to appreciation in international LNG prices resulting in improved market prices recognized by our integrated marketing function, as well as increases in Henry Hub prices. The volume of LNG delivered between the periods increased primarily as a result of production from Train 3 of the CCL Project and Train 6 of the SPL Project, which achieved substantial completion on March 26, 2021 and February 4, 2022, respectively.
Prior to substantial completion of a Train, amounts received from the sale of commissioning cargoes from that Train are offset against LNG terminal construction-in-process, because these amounts are earned or loaded during the testing phase for the construction of that Train. During the three months ended March 31, 2022 and 2021, we realized offsets to LNG terminal costs of $204 million and $191 million, corresponding to 15 TBtu and 25 TBtu respectively, that were related to the sale of commissioning cargoes from the Liquefaction Projects.
LNG revenues include gains and losses from derivative instruments, which include the realized value associated with a portion of derivative instruments that settle through physical delivery. We recognized offsets to revenues of $224 million and $39 million during the three months ended March 31, 2022 and 2021, respectively, related to the gains and losses from derivative instruments primarily due to shifts in forward commodity curves. Also included in LNG revenues are sales of certain unutilized natural gas procured for the liquefaction process and other revenues, which was $70 million and $104 million during the three months ended March 31, 2022 and 2021, respectively.
The following table presents the components of LNG revenues and the corresponding LNG volumes delivered:
| | | | | | | | | | | | | | | | | |
| | | Three Months Ended March 31, |
| | | | | | 2022 | | 2021 | | |
LNG revenues (in millions): | | | | | | | | | |
| LNG from the Liquefaction Projects sold under third party long-term agreements (1) | | | | | $ | 4,138 | | | $ | 2,319 | | | |
| LNG from the Liquefaction Projects sold by our integrated marketing function under short-term agreements | | | | | 3,098 | | | 519 | | | |
| LNG procured from third parties | | | | | 258 | | | 96 | | | |
| | | | | | | | | |
| Net derivative losses | | | | | (224) | | | (39) | | | |
| Other revenues | | | | | 70 | | | 104 | | | |
| Total LNG revenues | | | | | $ | 7,340 | | | $ | 2,999 | | | |
| | | | | | | | | |
Volumes delivered as LNG revenues (in TBtu): | | | | | | | | | |
| LNG from the Liquefaction Projects sold under third party long-term agreements (1) | | | | | 470 | | | 381 | | | |
| LNG from the Liquefaction Projects sold by our integrated marketing function under short-term agreements | | | | | 111 | | | 61 | | | |
| LNG procured from third parties | | | | | 11 | | | 14 | | | |
| Total volumes delivered as LNG revenues | | | | | 592 | | | 456 | | | |
| | | | | | | | | |
| | | | | | | | | |
(1)Long-term agreements include agreements with an initial tenure of 12 months or more.
Operating costs and expenses
| | | | | | | | | | | | | | | | | | | | | | | | | | | | | | | |
| | | Three Months Ended March 31, | | | | | | | | |
| (in millions) | | | | | | | 2022 | | 2021 | | | | Variance | | | | |
| Cost of sales | | | | | | | $ | 7,336 | | | $ | 1,386 | | | | | $ | 5,950 | | | | | | | |
| | | | | | | | | | | | | | | | | | | |
| Operating and maintenance expense | | | | | | | 389 | | | 322 | | | | | 67 | | | | | | | |
| Development expense | | | | | | | 5 | | | 1 | | | | | 4 | | | | | | | |
| Selling, general and administrative expense | | | | | | | 96 | | | 81 | | | | | 15 | | | | | | | |
| Depreciation and amortization expense | | | | | | | 271 | | | 236 | | | | | 35 | | | | | | | |
| | | | | | | | | | | | | | | | | | | |
| | | | | | | | | | | | | | | | | | | |
| | | | | | | | | | | | | | | | | | | |
| | | | | | | | | | | | | | | | | | | |
| Total operating costs and expenses | | | | | | | $ | 8,097 | | | $ | 2,026 | | | | | $ | 6,071 | | | | | | | |
| | | | | | | | | | | | | | | | | | | |
| | | | | | | | | | | | | | | | | | | |
| | | | | | | | | | | | | | | | | | | |
Our total operating costs and expenses increased during the three months ended March 31, 2022 from the comparable period in 2021, primarily as a result of increased cost of sales. Cost of sales includes costs incurred directly for the production and delivery of LNG from the Liquefaction Projects, to the extent those costs are not utilized for the commissioning process. Cost of sales increased during the three months ended March 31, 2022 from the comparable 2021 period, primarily due to unfavorable changes in our commodity derivatives to secure natural gas feedstock for the Liquefaction Projects, which was driven by unfavorable shifts in international forward commodity curves, as discussed above under Net income (loss) attributable to common stockholders, as well as increased pricing of natural gas feedstock as a result of higher U.S. natural gas prices and, to a lesser extent, from increased volume of LNG delivered. Cost of sales also includes costs associated with the sale of certain unutilized natural gas procured for the liquefaction process and a portion of derivative instruments that settle through physical delivery, variable transportation and storage costs, port and canal fees and other costs to convert natural gas into LNG.
Operating and maintenance expense primarily includes costs associated with operating and maintaining the Liquefaction Projects. During the three months ended March 31, 2022, operating and maintenance expense increased from the comparable period in 2021, primarily due to increased natural gas transportation and storage capacity demand charges, generally as a result of additional Trains that were in operation between the periods. Operating and maintenance expense also includes third party service and maintenance, payroll and benefit costs, insurance, regulatory costs and other operating costs.
Depreciation and amortization expense increased during the three months ended March 31, 2022 from the comparable period in 2021 as a result of commencing operations of Train 3 of the CCL Project in March 2021 and Train 6 of the SPL Project in February 2022.
We expect our operating costs and expenses to generally increase as Train 6 of the SPL Project achieved substantial completion on February 4, 2022, although we expect certain costs will not proportionally increase with the number of operational Trains as cost efficiencies will be realized.
Other expense
| | | | | | | | | | | | | | | | | | | | | | | | | | | | | |
| | | Three Months Ended March 31, | | | | | | |
| (in millions) | | | | | | | 2022 | | 2021 | | | | Variance |
| Interest expense, net of capitalized interest | | | | | | | $ | 349 | | | $ | 356 | | | | | $ | (7) | | | | | |
| Loss on modification or extinguishment of debt | | | | | | | 18 | | | 55 | | | | | (37) | | | | | |
| Interest rate derivative loss, net | | | | | | | (3) | | | (1) | | | | | (2) | | | | | |
| Other expense, net | | | | | | | (5) | | | (6) | | | | | 1 | | | | | |
| Total other expense | | | | | | | $ | 359 | | | $ | 404 | | | | | $ | (45) | | | | | |
Interest expense, net of capitalized interest, decreased during the three months ended March 31, 2022 from the comparable 2021 period as a result of lower interest costs as a result of refinancing higher cost debt and repayment of debt in accordance with our capital allocation plan, partially offset by the portion of total interest costs that was eligible for capitalization due to the completion of construction of Train 3 of the CCL Project in March 2021 and Train 6 of the SPL Project in February 2022. During the three months ended March 31, 2022 and 2021, we incurred $372 million and $417 million of total interest cost, respectively, of which we capitalized $23 million and $61 million, respectively, which was primarily related to interest costs incurred for the construction of the Liquefaction Projects.
Income tax provision (benefit)
| | | | | | | | | | | | | | | | | | | | | | | | | | | | | |
| | | Three Months Ended March 31, | | | | | | |
| (in millions) | | | | | | | 2022 | | 2021 | | | | Variance |
| Income (loss) before income taxes and non-controlling interest | | | | | | | $ | (972) | | | $ | 660 | | | | | $ | (1,632) | | | | | |
| Income tax provision (benefit) | | | | | | | $ | (191) | | | $ | 89 | | | | | $ | (280) | | | | | |
| Effective tax rate | | | | | | | 19.7 | % | | 13.5 | % | | | | 6.2 | % | | | | |
We recorded an income tax benefit of $191 million and income tax provision of $89 million during the three months ended March 31, 2022 and 2021, respectively.
Our effective tax rate of 19.7% for the three months ended March 31, 2022 corresponds to an income tax benefit recorded for the period and was lower than the statutory income tax rate primarily due to income allocated to non-controlling interest that is not taxable to Cheniere partially offset by tax benefits related to stock-based compensation awards that vested in the quarter. Our effective tax rate of 13.5% for the three months ended March 31, 2021 corresponds to an income tax provision recorded for the period and was lower than the statutory income tax rate primarily due to income allocated to non-controlling interest that is not taxable to Cheniere.
Our effective tax rate is subject to variation prospectively due to variability in our pre-tax and taxable earnings and the proportion of such earnings attributable to non-controlling interests.
Net income attributable to non-controlling interest
| | | | | | | | | | | | | | | | | | | | | | | | | | | | | |
| | | Three Months Ended March 31, | | | | | | |
| (in millions) | | | | | | | 2022 | | 2021 | | | | Variance |
| Net income attributable to non-controlling interest | | | | | | | $ | 84 | | | $ | 178 | | | | | $ | (94) | | | | | |
Net income attributable to non-controlling interest decreased during the three months ended March 31, 2022 from the three months ended March 31, 2021 primarily due to an decrease in consolidated net income recognized by CQP, which decreased from net income of $347 million in the three months ended March 31, 2021 to $159 million in the three months ended March 31, 2022.
During the three months ended March 31, 2022, in fulfillment of a prior commitment to collateralize financing for Train 6 of the SPL Project, Cheniere provided to SPL certain SPAs aggregating approximately 21 million tonnes of LNG to be delivered between 2023 and 2035 and an IPM agreement to purchase 140,000 MMBtu per day of natural gas for a term of
approximately 15 years beginning in early 2023. As a result, net income attributable to non-controlling interest will be impacted in future periods as volumes are delivered under the transferred contracts and by unrealized gains and losses on the IPM agreement, which is accounted for as a derivative.
Liquidity and Capital Resources
The following information describes our ability to generate and obtain adequate amounts of cash to meet our requirements in the short term and the long term. In the short term, we expect to meet our cash requirements using operating cash flows and available liquidity, consisting of cash and cash equivalents, restricted cash and cash equivalents and available commitments under our credit facilities. In the long term, we expect to meet our cash requirements using operating cash flows and other future potential sources of liquidity, which may include debt and equity offerings by us or our subsidiaries. The table below provides a summary of our available liquidity (in millions).
| | | | | | | |
| March 31, 2022 | | |
| Cash and cash equivalents (1) | $ | 2,487 | | | |
| Restricted cash and cash equivalents designated for the following purposes: | | | |
| | | |
| SPL Project | 136 | | | |
| | | |
| | | |
| CCL Project | 50 | | | |
| Cash held by our subsidiaries that is restricted to Cheniere | 233 | | | |
| Available commitments under our credit facilities (2): | | | |
| | | |
| $1.2 billion Working Capital Revolving Credit and Letter of Credit Reimbursement Agreement | 832 | | | |
| CQP Credit Facilities executed in 2019 | 750 | | | |
| | | |
| | | |
| $1.2 billion CCH Working Capital Facility (“CCH Working Capital Facility”) | 924 | | | |
$1.25 billion Cheniere Revolving Credit Facility (“Cheniere Revolving Credit Facility”) | 1,250 | | | |
| | | |
| Total available commitments under our credit facilities | 3,756 | | | |
| | | |
| Total available liquidity | $ | 6,662 | | | |
(1)Amounts presented include balances held by our consolidated variable interest entity, CQP, as discussed in Note 7—Non-controlling Interest and Variable Interest Entity of our Notes to Consolidated Financial Statements. As of March 31, 2022, assets of CQP, which are included in our Consolidated Balance Sheets, included $1.2 billion of cash and cash equivalents. (2)Available commitments represent total commitments less loans outstanding and letters of credit issued under each of our credit facilities as of March 31, 2022. See Note 9—Debt of our Notes to Consolidated Financial Statements for additional information on our credit facilities and other debt instruments.
Our liquidity position subsequent to March 31, 2022 is driven by future sources of liquidity and future cash requirements. Future sources of liquidity are expected to be composed of (1) cash receipts from executed contracts, under which we are contractually entitled to future consideration, and (2) additional sources of liquidity, from which we expect to receive cash although the cash is not underpinned by executed contracts. Future cash requirements are expected to be composed of (1) cash payments under executed contracts, under which we are contractually obligated to make payments, and (2) additional cash requirements, under which we expect to make payments although we are not contractually obligated to make the payments under executed contracts.
Although material sources of liquidity and material cash requirements are presented below from a consolidated standpoint, SPL, CQP, CCH and Cheniere operate with independent capital structures. Certain restrictions under debt and equity instruments executed by our subsidiaries limit each entity’s ability to distribute cash, including the following:
•SPL and CCH are required to deposit all cash received into restricted cash and cash equivalents accounts under certain of their debt agreements. The usage or withdrawal of such cash is restricted to the payment of liabilities related to the Liquefaction Projects and other restricted payments. The majority of the cash held by SPL and CCH that is restricted to Cheniere relates to advance funding for operation and construction of the Liquefaction Projects;
•CQP is required under its partnership agreement to distribute to unitholders all available cash on hand at the end of a quarter less the amount of any reserves established by its general partner. Beginning with the distribution related to the first quarter of 2022, the quarterly distributions by CQP are expected to be comprised of a base amount plus a variable amount equal to the remaining available cash per unit, which takes into consideration, among other things,
amounts reserved for annual debt repayment and capital allocation goals, anticipated capital expenditures to be funded with cash, and cash reserves to provide for the proper conduct of CQP’s business.
•Our 48.6% limited partner interest, 100% general partner interest and incentive distribution rights in CQP limit our right to receive cash held by CQP to the amounts specified by the provisions of CQP’s partnership agreement; and
•SPL, CQP and CCH are restricted by affirmative and negative covenants included in certain of their debt agreements in their ability to make certain payments, including distributions, unless specific requirements are satisfied.
Notwithstanding the restrictions noted above, we believe that sufficient flexibility exists within the Cheniere complex to enable each independent capital structure to meet its currently anticipated cash requirements. The sources of liquidity at SPL, CQP and CCH primarily fund the cash requirements of the respective entity, and any remaining liquidity not subject to restriction, as supplemented by liquidity provided by Cheniere Marketing, is available to enable Cheniere to meet its cash requirements.
Sources and Uses of Cash
The following table summarizes the sources and uses of our cash, cash equivalents and restricted cash and cash equivalents (in millions). The table presents capital expenditures on a cash basis; therefore, these amounts differ from the amounts of capital expenditures, including accruals, which are referred to elsewhere in this report. Additional discussion of these items follows the table.
| | | | | | | | | | | | | |
| Three Months Ended March 31, |
| 2022 | | 2021 | | |
| | | | | |
| Net cash provided by operating activities | $ | 2,655 | | | $ | 1,066 | | | |
| Net cash used in investing activities | (178) | | | (200) | | | |
| Net cash used in financing activities | (1,388) | | | (545) | | | |
| | | | | |
| | | | | |
| | | | | |
| | | | | |
| | | | | |
| | | | | |
| | | | | |
| | | | | |
| | | | | |
| | | | | |
| | | | | |
| | | | | |
| | | | | |
| | | | | |
| | | | | |
| | | | | |
| | | | | |
| Net increase in cash, cash equivalents and restricted cash and cash equivalents | $ | 1,089 | | | $ | 321 | | | |
| | | | | |
| | | | | |
Operating Cash Flows
Our operating cash net inflows during the three months ended March 31, 2022 and 2021 were $2,655 million and $1,066 million, respectively. The $1,589 million increase in operating cash inflows in 2022 compared to 2021 was primarily related to increased cash receipts from the sale of LNG cargoes due to higher revenue per MMBtu and to a lesser extent higher volume of LNG delivered. Partially offsetting these operating cash inflows were higher operating cash outflows primarily due to higher natural gas feedstock costs and lower contribution from certain portfolio optimization activities.
Investing Cash Flows
Our investing cash net outflows in both years primarily was for the construction costs for the Liquefaction Projects. The $22 million decrease in 2022 compared to 2021 was primarily due to the completion of Train 6 of the SPL Project in February 2022, which was under construction throughout 2021. These costs are capitalized as construction-in-process until achievement of substantial completion.
Financing Cash Flows
During the three months ended March 31, 2022, total debt paid, net of issuances, was $1,040 million. During the three months ended March 31, 2021, total debt paid, net of issuances, was $288 million. See tables below for additional details.
Debt Issuances and Related Financing Costs
The following table shows the issuances of debt, including intra-quarter borrowings (in millions):
| | | | | | | | | | | | | | | | |
| | Three Months Ended March 31, |
| | 2022 | | 2021 | | |
| | | | | | |
| | | | | | |
| | | | | | |
| | | | | | |
| | | | | | |
| CQP: | | | | | | |
| | | | | | |
4.000% Senior Notes due 2031 | | $ | — | | | $ | 1,500 | | | |
| | | | | | |
| | | | | | |
| | | | | | |
| | | | | | |
| | | | | | |
| | | | | | |
| | | | | | |
| | | | | | |
| | | | | | |
| Cheniere: | | | | | | |
| | | | | | |
| Cheniere Revolving Credit Facility | | 575 | | | 300 | | | |
| | | | | | |
| Total issuances | | $ | 575 | | | $ | 1,800 | | | |
During the three months ended March 31, 2022 and 2021, we incurred debt issuance costs and other financing costs of zero and $19 million, respectively, related to the debt issuances above and closing of credit facilities during the respective periods.
Debt Redemptions and Repayments and Related Modification or Extinguishment Costs
The following table shows the redemptions and repayments of debt, including intra-quarter repayments (in millions):
| | | | | | | | | | | | | | | | |
| | Three Months Ended March 31, |
| | 2022 | | 2021 | | |
| | | | | | |
| | | | | | |
| | | | | | |
| | | | | | |
| | | | | | |
| CQP: | | | | | | |
5.250% Senior Notes due 2025 | | $ | — | | | $ | (1,500) | | | |
| | | | | | |
| | | | | | |
| | | | | | |
| CCH: | | | | | | |
CCH Working Capital Facility | | (250) | | | (140) | | | |
| CCH amended and restated term loan facility | | (290) | | | — | | | |
| | | | | | |
| Cheniere: | | | | | | |
| 2045 Cheniere Convertible Senior Notes | | (500) | | | — | | | |
| Cheniere Revolving Credit Facility | | (575) | | | (300) | | | |
| Cheniere’s term loan facility | | — | | | (148) | | | |
| | | | | | |
| Total redemption and repayments | | $ | (1,615) | | | $ | (2,088) | | | |
| | | | | | |
| | | | | | |
| | | | | | |
| | | | | | |
| | | | | | |
| | | | | | |
| | | | | | |
| | | | | | |
| | | | | | |
| | | | | | |
| | | | | | |
| | | | | | |
| | | | | | |
| | | | | | |
| | | | | | |
| | | | | | |
| | | | | | |
| | | | | | |
| | | | | | |
| | | | | | |
During the three months ended March 31, 2022 and 2021, we paid debt modification or extinguishment costs of $13 million and $40 million, respectively, related to these redemptions and repayments.
Non-Controlling Interest Distributions
CQP paid distributions of $171 million and $160 million during the three months ended March 31, 2022 and 2021, respectively, to non-controlling interests since we own a 48.6% limited partner interest in CQP and the remaining non-controlling interest is held by Blackstone Inc., Brookfield Asset Management Inc. and the public.
Repurchase of Common Stock
During the three months ended March 31, 2022, we paid $25 million to repurchase approximately 0.24 million shares of our common stock under our share repurchase program. We did not have any share repurchases during the three months ended March 31, 2021.
Cash Dividends to Shareholders
On January 25, 2022, we declared a quarterly dividend of $0.33 per share of common stock that was paid on February 28, 2022 to shareholders of record as of February 7, 2022, for a total payment of $86 million. We did not pay dividends during the three months ended March 31, 2021.
On April 26, 2022, we declared a quarterly dividend of $0.33 per share of common stock that is payable on May 17, 2022 to shareholders of record as of May 10, 2022.
Summary of Critical Accounting Estimates
The preparation of Consolidated Financial Statements in conformity with GAAP requires management to make certain estimates and assumptions that affect the amounts reported in the Consolidated Financial Statements and the accompanying notes. There have been no significant changes to our critical accounting estimates from those disclosed in our annual report on Form 10-K for the fiscal year ended December 31, 2021.
Recent Accounting Standards
ITEM 3. QUANTITATIVE AND QUALITATIVE DISCLOSURES ABOUT MARKET RISK
Marketing and Trading Commodity Price Risk
We have entered into commodity derivatives consisting of natural gas supply contracts for the commissioning and operation of the SPL Project, the CCL Project and potential future development of Corpus Christi Stage 3 (“Liquefaction Supply Derivatives”). We have also entered into physical and financial derivatives to hedge the exposure to the commodity markets in which we have contractual arrangements to purchase or sell physical LNG (collectively, “LNG Trading Derivatives”). In order to test the sensitivity of the fair value of the Liquefaction Supply Derivatives and the LNG Trading Derivatives to changes in underlying commodity prices, management modeled a 10% change in the commodity price for natural gas for each delivery location and a 10% change in the commodity price for LNG, respectively, as follows (in millions):
| | | | | | | | | | | | | | | | | | | | | | | |
| March 31, 2022 | | December 31, 2021 |
| Fair Value | | Change in Fair Value | | Fair Value | | Change in Fair Value |
| Liquefaction Supply Derivatives | $ | (7,489) | | | $ | 1,749 | | | $ | (4,038) | | | $ | 903 | |
| LNG Trading Derivatives | (268) | | | 26 | | | (400) | | | 38 | |
Interest Rate Risk
We are exposed to interest rate risk primarily when we incur debt related to project financing. Interest rate risk is managed in part by replacing outstanding floating-rate debt with fixed-rate debt with varying maturities. CCH has entered into interest rate swaps to hedge the exposure to volatility in a portion of the floating-rate interest payments under the CCH Credit Facility (“Interest Rate Derivatives”). In order to test the sensitivity of the fair value of the Interest Rate Derivatives to changes in interest rates, management modeled a 10% change in the forward one-month LIBOR curve across the remaining terms of the Interest Rate Derivatives as follows (in millions):
| | | | | | | | | | | | | | | | | | | | | | | |
| March 31, 2022 | | December 31, 2021 |
| Fair Value | | Change in Fair Value | | Fair Value | | Change in Fair Value |
| Interest Rate Derivatives | $ | (12) | | | $ | 1 | | | $ | (40) | | | $ | — | |
| | | | | | | |
Foreign Currency Exchange Risk
We have entered into foreign currency exchange (“FX”) contracts to hedge exposure to currency risk associated with operations in countries outside of the United States (“FX Derivatives”). In order to test the sensitivity of the fair value of the FX Derivatives to changes in FX rates, management modeled a 10% change in FX rate between the U.S. dollar and the applicable foreign currencies as follows (in millions):
| | | | | | | | | | | | | | | | | | | | | | | |
| March 31, 2022 | | December 31, 2021 |
| Fair Value | | Change in Fair Value | | Fair Value | | Change in Fair Value |
| FX Derivatives | $ | 25 | | | $ | 2 | | | $ | 12 | | | $ | 2 | |
ITEM 4. CONTROLS AND PROCEDURES
We maintain a set of disclosure controls and procedures that are designed to ensure that information required to be disclosed by us in the reports filed by us under the Exchange Act, is recorded, processed, summarized and reported within the time periods specified in the SEC’s rules and forms. As of the end of the period covered by this report, we evaluated, under the supervision and with the participation of our management, including our Chief Executive Officer and our Chief Financial Officer, the effectiveness of our disclosure controls and procedures pursuant to Rule 13a-15 of the Exchange Act. Based on that evaluation, our Chief Executive Officer and our Chief Financial Officer concluded that our disclosure controls and procedures are effective.
During the most recent fiscal quarter, there have been no changes in our internal control over financial reporting that have materially affected, or are reasonably likely to materially affect, our internal control over financial reporting.
PART II. OTHER INFORMATION
ITEM 1. LEGAL PROCEEDINGS
We may in the future be involved as a party to various legal proceedings, which are incidental to the ordinary course of business. We regularly analyze current information and, as necessary, provide accruals for probable liabilities on the eventual disposition of these matters. Other than discussed below, there have been no material changes to the legal proceedings disclosed in our annual report on Form 10-K for the fiscal year ended December 31, 2021.
Louisiana Department of Environmental Quality (“LDEQ”) Matter
Certain of our subsidiaries are in discussions with the LDEQ to resolve self-reported deviations arising from operation of the Sabine Pass LNG Terminal and the commissioning of the SPL Project, and relating to certain requirements under its Title V Permit. The matter involves deviations self-reported to LDEQ pursuant to the Title V Permit and covering the time period from January 1, 2012 through March 25, 2016. On April 11, 2016, certain of our subsidiaries received a Consolidated Compliance Order and Notice of Potential Penalty (the “Compliance Order”) from LDEQ covering deviations self-reported during that time period. Certain of our subsidiaries continue to work with LDEQ to resolve the matters identified in the Compliance Order. We do not expect that any ultimate sanction will have a material adverse impact on our financial results.
Pipeline and Hazardous Materials Safety Administration (“PHMSA”) Matter
In February 2018, the PHMSA issued a Corrective Action Order (the “CAO”) to SPL in connection with a minor LNG leak from one tank and minor vapor release from a second tank at the Sabine Pass LNG Terminal (the “2018 SPL tank incident”). These two tanks have been taken out of operational service while we conduct analysis, repair and remediation. On April 20, 2018, SPL and PHMSA executed a Consent Agreement and Order (the “Consent Order”) that replaces and supersedes the CAO. On July 9, 2019, PHMSA and FERC issued a joint letter setting out operating conditions required to be met prior to SPL returning the tanks to service. In July 2021, PHMSA issued a Notice of Probable Violation (“NOPV”) and Proposed Civil Penalty to SPL alleging violations of federal pipeline safety regulations relating to the 2018 SPL tank incident and proposing civil penalties totaling $2,214,900. On September 16, 2021, PHMSA issued an Amended NOPV that reduced the proposed penalty to $1,458,200. On October 12, 2021, SPL responded to the Amended NOPV, electing not to contest the alleged violations in the Amended NOPV and electing to pay the proposed reduced penalty. PHMSA notified SPL in a letter dated November 9, 2021 that the case was considered “closed.” On March 9, 2022, PHMSA and FERC issued conditional approval to return one of the two tanks to service. SPL continues to coordinate with PHMSA and FERC to address the matters relating to the 2018 SPL tank incident, including repair approach and related analysis. We do not expect that the Consent Order and related analysis, repair and remediation or resolution of the NOPV will have a material adverse impact on our financial results or operations.
ITEM 1A. RISK FACTORS
ITEM 2. UNREGISTERED SALES OF EQUITY SECURITIES AND USE OF PROCEEDS
Purchase of Equity Securities by the Issuer and Affiliated Purchasers
The following table summarizes stock repurchases for the three months ended March 31, 2022:
| | | | | | | | | | | | | | | | | | | | | | | | | | |
| Period | | Total Number of Shares Purchased (1) | | Average Price Paid Per Share (2) | | Total Number of Shares Purchased as a Part of Publicly Announced Plans | | Approximate Dollar Value of Shares That May Yet Be Purchased Under the Plans (3) |
| January 1 - 31, 2022 | | 239,320 | | $104.20 | | 238,537 | | $972,714,359 |
| February 1 - 28, 2022 | | 298,073 | | $119.38 | | — | | $972,714,359 |
| March 1 - 31, 2022 | | — | | $— | | — | | $972,714,359 |
Total | | 537,393 | | $112.62 | | 238,537 | | |
(1)Includes issued shares surrendered to us by participants in our share-based compensation plans for payment of applicable tax withholdings on the vesting of share-based compensation awards. Associated shares surrendered by participants are repurchased pursuant to terms of the plan and award agreements and not as part of the publicly announced share repurchase plan.
(2)The price paid per share was based on the average trading price of our common stock on the dates on which we repurchased the shares.
(3)On September 7, 2021, the Board of Directors authorized an increase in the previously announced share repurchase program to $1.0 billion, inclusive of any amounts remaining under the previous authorization as of September 30, 2021, for an additional three years beginning on October 1, 2021. For additional information, see Note 15—Stockholders' Deficit.
ITEM 6. EXHIBITS
| | | | | | | | | | | | | |
| | | | |
| Exhibit No. | | Description | | | | | |
| | | | | | | |
| | | | | | | |
| 10.1* | | | | | | | |
| | | | | | | |
| | | | | | | |
| | | | | | | |
| | | | | | | |
| | | | | | | |
| | | | | | | |
| 10.2* | | Change orders to the Lump Sum Turnkey Agreement for the Engineering, Procurement and Construction of the Sabine Pass LNG Stage 4 Liquefaction Facility, dated November 7, 2018, by and between SPL and Bechtel Oil Gas and Chemicals, Inc.: (i) the Change Order CO-00058 COVID-19 Impacts 3Q2021, dated January 6, 2022, (ii) CO-00059 Spill Containment SIL 2 Interlock, dated January 11, 2022, (iii) the Change Order CO-00060 Third Berth Soil Preparation Provisional Sum Closure, dated March 15, 2022, (iv) the Change Order CO-00061 COVID-19 Impacts 4Q2021, dated March 15, 2022 and (v) the Change Order CO-00062 FERC Condition 61, dated March 15, 2022 | | | | | |
| 31.1* | | | | | | | |
| 31.2* | | | | | | | |
| 32.1** | | | | | | | |
| 32.2** | | | | | | | |
| 101.INS* | | XBRL Instance Document | | | | | |
| 101.SCH* | | XBRL Taxonomy Extension Schema Document | | | | | |
| 101.CAL* | | XBRL Taxonomy Extension Calculation Linkbase Document | | | | | |
| 101.DEF* | | XBRL Taxonomy Extension Definition Linkbase Document | | | | | |
| 101.LAB* | | XBRL Taxonomy Extension Labels Linkbase Document | | | | | |
| 101.PRE* | | XBRL Taxonomy Extension Presentation Linkbase Document | | | | | |
| 104* | | Cover Page Interactive Data File (formatted as Inline XBRL and contained in Exhibit 101) | | | | | |
| | | | | |
| |
| * | Filed herewith. |
| ** | Furnished herewith. |
| |
Pursuant to the requirements of the Securities Exchange Act of 1934, the registrant has duly caused this report to be signed on its behalf by the undersigned, thereunto duly authorized.
| | | | | | | | | | | |
| | CHENIERE ENERGY, INC. |
| | |
| | | |
| | | |
| | | |
| | | |
| | | |
| | | |
| Date: | May 3, 2022 | By: | /s/ Zach Davis |
| | | Zach Davis |
| | | Executive Vice President and Chief Financial Officer |
| | | (on behalf of the registrant and
as principal financial officer) |
| | | |
| Date: | May 3, 2022 | By: | /s/ David Slack |
| | | David Slack |
| | | Vice President and Chief Accounting Officer |
| | | (on behalf of the registrant and
as principal accounting officer) |